the Creative Commons Attribution 4.0 License.
the Creative Commons Attribution 4.0 License.
 | 09 Aug 2024
An improved global pressure and zenith wet delay model with optimized vertical correction considering the spatiotemporal variability in multiple height-scale factors
Chunhua Jiang
Xiang Gao
Huizhong Zhu
Shuaimin Wang
Sixuan Liu
Shaoni Chen
Guangsheng Liu
Atmospheric pressure and zenith wet delay (ZWD) are essential for global navigation satellite system (GNSS) tropospheric correction and precipitable water vapor (PWV) retrieval. As the development progresses of real-time GNSS kinematic technology, moving platforms, such as airborne and shipborne, require high-quality tropospheric delay information to pre-correct errors. Most existing tropospheric models are only applicable to the Earth's surface and exhibit poor accuracies in high-altitude areas due to simple vertical fitting functions and limited temporal resolution of the underlying parameters. Hence, an improved global empirical pressure and ZWD model is developed using 5-year ERA5 hourly reanalysis data, called IGPZWD, which takes seasonal and intraday variations into consideration. The vertical accuracy and applicability of IGPZWD model are further optimized by introducing the annual and semi-annual harmonics for pressure and ZWD height-scale factors of exponential function with three orders. Taking the ERA5 and radiosonde profile data in 2020 as reference, the pressure and ZWD of IGPZWD model show superior performance compared to those of three state-of-the-art models, i.e., GPT3, IGPT, and GTrop. Furthermore, IGPZWD-predicted zenith tropospheric delay (ZTD) yields improvements of up to 65.7 %, 2.4 %, and 7.8 % over that of GPT3, RGPT3, and GTrop models on a global scale, respectively. The proposed vertical correction algorithm effectively weakens the impact of accumulation error caused by excessive height difference, achieving optimal accuracy and feasibility in the high-altitude area. The IGPZWD model can be extensively applied in GNSS kinematic precision positioning, as well as atmospheric water vapor sounding.
- Article
(22666 KB) - Full-text XML
- BibTeX
- EndNote


Tropospheric delay is a typical error in the application of microwave-based space-geodetic techniques (Hofmeister and Böhm, 2017; Xu et al., 2023; Lu et al., 2023). In the field of global navigation satellite systems (GNSSs), zenith tropospheric delay (ZTD) is correlated to station coordinates and receiver clock error (J. Li et al., 2023). Accurate external prior ZTD can effectively improve the positioning precision and enhance the convergence speed (Tregoning and Herring, 2006; Sun et al., 2019a; Zhang et al., 2022). Besides, the troposphere contains diverse atmospheric information. Accurate precipitable water vapor (PWV) can be derived by the combination of ZTD, atmospheric pressure, and weighted mean temperature and applied as an important indicator for regional and global numerical weather forecasting and meteorological monitoring (Wang et al., 2016; Li et al., 2022). In general, the slant path delay (SPD) of the GNSS signal is divided into hydrostatic delay and non-hydrostatic (wet) delay components, each of which can be expressed as the multiplication of the zenith delay and mapping function (Landskron and Böhm, 2018). The zenith hydrostatic delay (ZHD) can be accurately determined, according to the Saastamoinen model, with measured instantaneous pressure as the input, while the zenith wet delay (ZWD) is generally estimated as an unknown parameter (Saastamoinen, 1972; Hadas et al., 2017; Zhang et al., 2021; Yang et al., 2023). Hence, accurate pressure and ZWD are crucial prerequisites for obtaining reliable prior tropospheric delay information.
Generally, accurate pressure, temperature, and humidity observations can be obtained from meteorological instruments. But most GNSS stations are not equipped with meteorological sensors, and the spatial distribution of automatic weather stations cannot meet the growing demands of high-precision positioning. Numerical weather models (NWMs) provide high-quality reanalysis products, but these atmospheric data come with release latency and a heavy storage burden (Zhang et al., 2019; Su et al., 2021). As a trade-off, multiple empirical models have been constructed using historical reanalysis data which can predict tropospheric parameters for real-time GNSS applications (Leandro et al., 2006, 2008; Boehm et al., 2007; Lagler et al., 2013; Böhm et al., 2015; Landskron and Böhm, 2018). Unfortunately, such models mainly incorporate annual and semi-annual harmonics to reflect the long-term pattern in parameters, which makes it difficult to capture short-term fluctuations. Therefore, some scholars have developed the models which introduced the diurnal and semi-diurnal terms using hourly reanalysis data, such as the TropGrid2 model (Schüler, 2014), the ITG model (Yao et al., 2015), the WHU_CPT model (Zhang et al., 2018), and the IGPT model (Li et al., 2021).
To reduce the accuracy loss caused by the height difference between model grid and target position, multiple fitting functions are used to simulate the vertical nonlinear variations in the pressure and ZWD. Regarding the pressure, typical vertical correction methods include the original and modified standard extrapolation model (Berg, 1948; Su et al., 2021), the hydrostatics and ideal gas equation (Wang et al., 2007), the exponential model related to the virtual temperature (Yao et al., 2015; Böhm et al., 2015), and the adiabatic model based on the temperature lapse rate (Benjamin and Miller, 1990; Mao et al., 2021; Sun et al., 2023). ZWD exhibits complex vertical variation due to the dynamic nature of water vapor. An exponential fitting function with a single decay coefficient is typically applied for the vertical correction of ZWD, but some studies reveal that the ZWD height-scale factor shows obvious regional differences and periodic characteristics (Kouba, 2008; Sun et al., 2017; Yao et al., 2018; Huang et al., 2021a; Huang et al., 2023). Accordingly, substantial efforts have been made to construct optimized regional and global ZWD vertical correction models which take seasonal variation or long-term linear trend into consideration, for instance, the GTrop model (Sun et al., 2019b), the GZWD-H model (Huang et al., 2021b), the TZ model (Xu et al., 2023), and the HPZI model (Zhao et al., 2024). Furthermore, the piecewise function and stratification methods have been verified to be applicable and feasible for the vertical correction of ZWD (Li et al., 2015; Yao and Hu, 2018; Hu and Yao, 2019; Zhu et al., 2022).
With the development of GNSS infrastructure, moving platforms such as unpiloted aerial vehicles (UAVs) and shipborne and moving vehicles provide massive spatial data for navigation and positioning (Wang et al., 2022; Zhang et al., 2023). Nonetheless, the complex weather and geographical condition, insufficient meteorological data, and limited satellite observation geometry pose great challenges to kinematic GNSS solutions (Rocken et al., 2005; Webb et al., 2016; Penna et al., 2018). Generally, accurate and reliable tropospheric delay constraints can effectively enhance the performance of positioning. Xia et al. (2023) comprehensively considered the seasonal and intraday variations in the elevation normalization factor and developed a real-time ZTD model, and the vertical convergence speed was improved by 37.4 % after the ZTD constraints were utilized for the float precise point positioning (PPP). Besides, four-layer and single-layer ZTD models are established using the piecewise exponential function as the key vertical adjustment scheme for ZTD, which reduced the convergence time by 60.0 % and 33.3 % compared to the standard PPP, respectively (Zhang et al., 2020). An optimized GPT3 model (RGPT3) is constructed using random forest (RF), achieving 12.3 % and 7.9 % improvement in vertical convergence speed and accuracy (L. Li et al., 2023). However, most of the current tropospheric models are only applicable to the Earth's surface. Although some tropospheric vertical profile models perform well in the high-altitude areas, there are still specific shortcomings such as insufficient periodic terms, fixed application scenarios, and limited vertical accuracy.
To overcome the above drawbacks, an empirical global pressure and ZWD grid model with broader operating space named IGPZWD is constructed using ERA5 hourly data from 2015 to 2019 in this contribution. Initially, the annual, semi-annual, diurnal, and semi-diurnal periods of atmospheric pressure and ZWD are taken into consideration. Thereafter, the optimal exponential fitting function with three orders is introduced as the core vertical correction scheme. Finally, the height-scale factors are estimated by least squares algorithm refined up to semi-annual harmonics. Furthermore, the accuracy and reliability of IGPZWD are comprehensively evaluated and validated against ERA5 and radiosonde data in 2020.
2.1 Data sources
The fifth generation European Centre for Medium-Range Weather Forecasts (ECMWF) atmospheric reanalysis (ERA5) benefits from a four-dimensional variational (4D-Var) assimilation solution and an integrated forecasting system (IFS), which provides high spatiotemporal resolution and high-accuracy atmospheric state variables over globe (Hersbach et al., 2020). ERA5 provides 3D pressure level products with a vertical resolution of 37 levels and 2D single-level data. The atmospheric parameters are provided with a horizontal resolution of 0.25° × 0.25°, and the hourly data can more accurately reflect the short-term variation in the meteorological parameters (Jiang et al., 2023). In this contribution, ERA5 hourly temperature, pressure, specific humidity, and geopotential data on the pressure level, surface pressure, 2 m dew point temperature, and 2 m temperature on a single level from 2015 to 2019 are utilized to construct the IGPZWD model, and the accuracy of the new model is verified using data in 2020.
The Integrated Global Radiosonde Archive (IGRA) consists of radiosonde and pilot balloon observations from more than 2800 globally distributed stations, and surface and upper-air meteorological data become available in near-real time from about 800 stations worldwide (Ingleby et al., 2016). Atmospheric temperature, pressure, and water vapor pressure data profiles at 00:00 coordinated universal time (UTC) and 12:00 UTC in 2020 are obtained from the IGRA. Generally, sensor quality and weather events have a serious impact on raw measurements, which result in missing data and outliers. Hence, the low-quality radiosonde data profiles which meet the following quality control standards are eliminated. (1) The height difference between two successive levels is greater than 2 km. (2) The pressure difference between two successive levels is greater than 200 hPa. (3) The height of the top-level data is <10 km. (4) The effective observation records of the profile are <20. Finally, the geographical distribution of the 565 selected radiosonde stations is presented in Fig. 1.
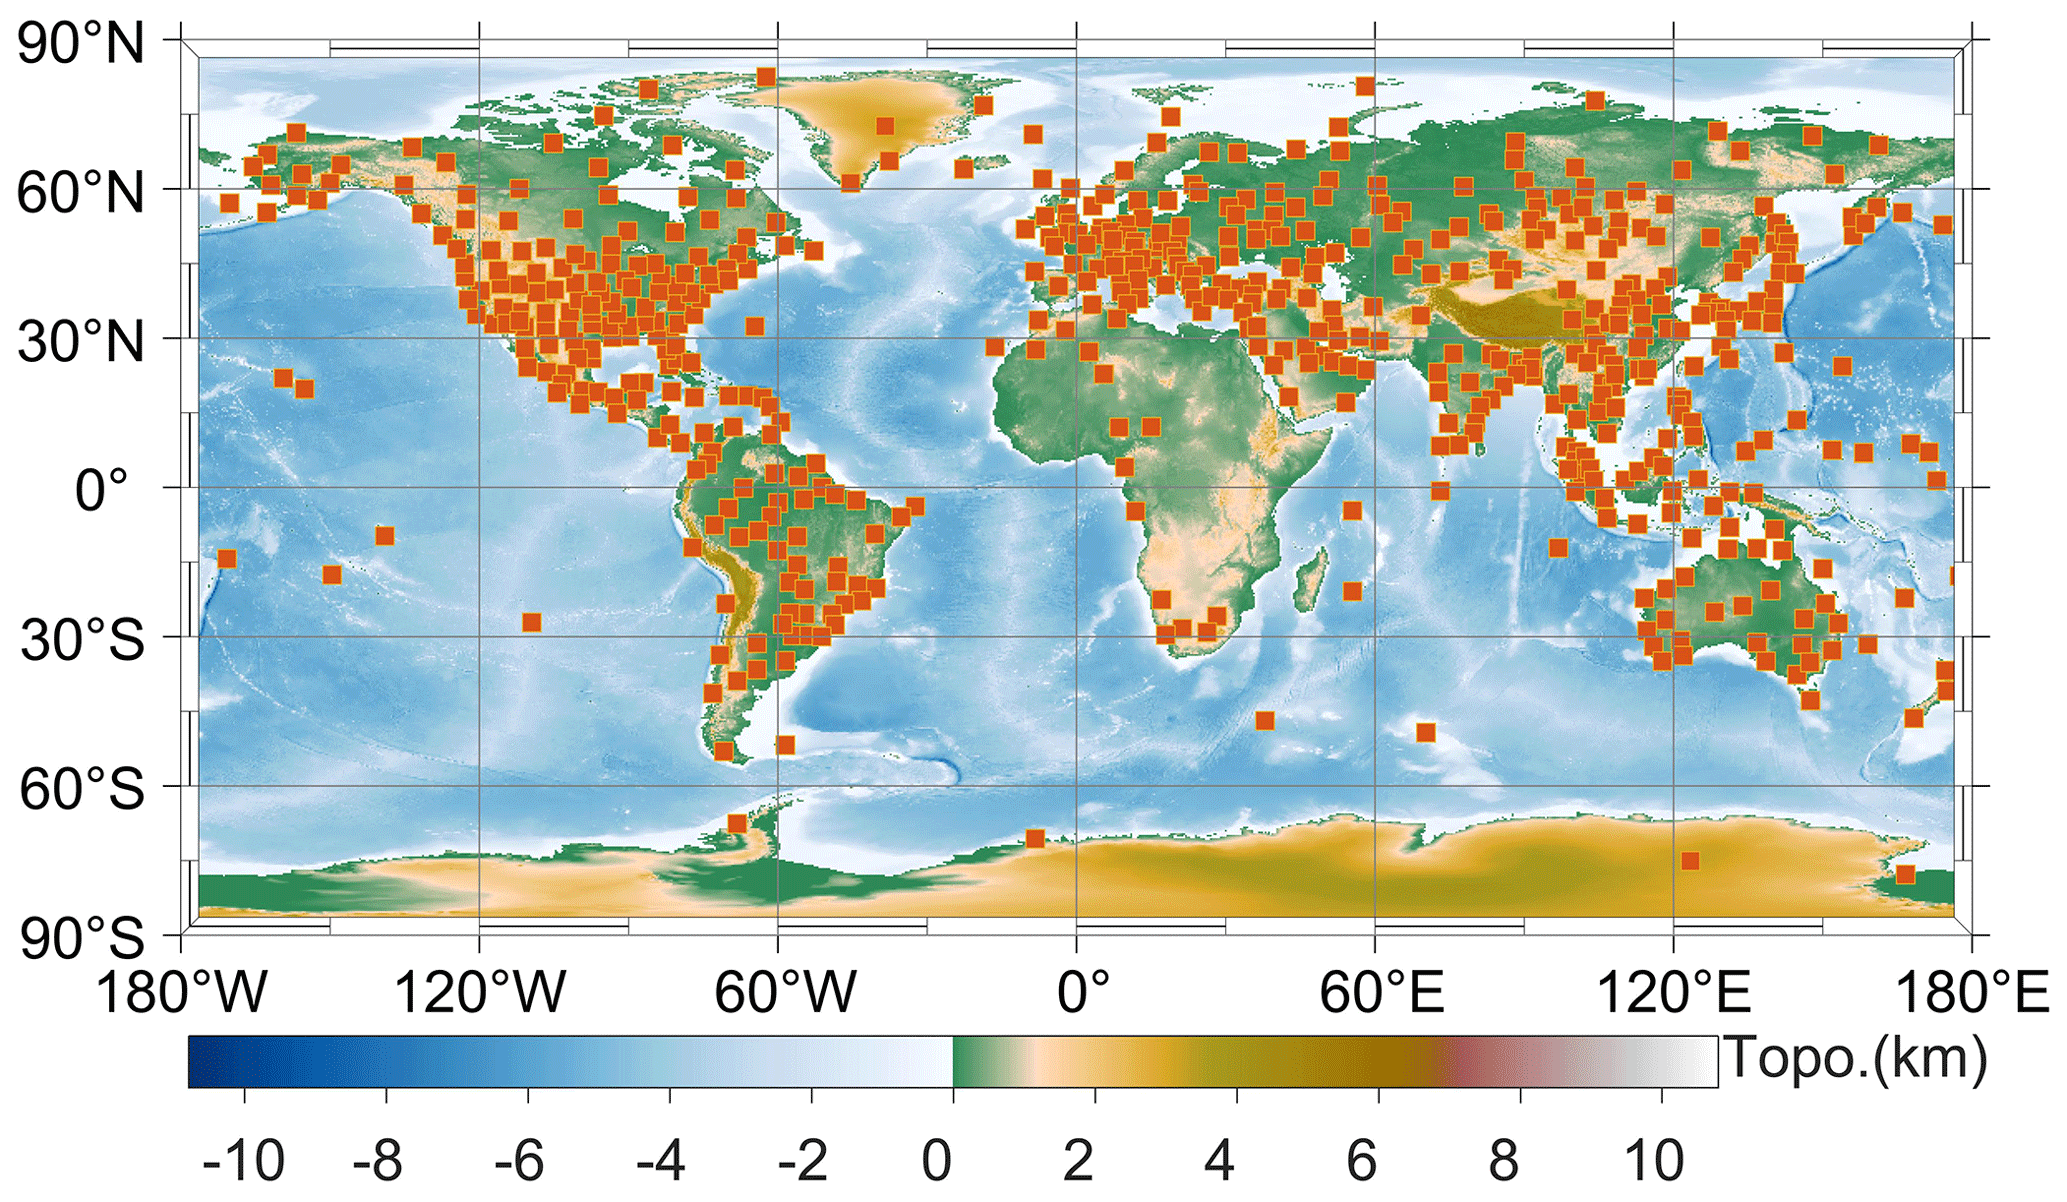
Figure 1The geographical distribution of 565 selected radiosonde stations.
2.2 Inversion Strategies for ZWD and ZTD
The ERA5 and radiosonde ZWD profiles are calculated according to the numerical integration method as follows (Thayer, 1974; Askne and Nordius, 1987; Jiang et al., 2023):
where K hPa−1, and K3=375 463 K2 hPa−1. Htop and H0 are the heights of the top and bottom levels of the parameter profile. Q, P, T, dew, and e are the specific humidity, pressure, temperature, 2 m dew point temperature, and water vapor pressure for each level, respectively. The radiosonde ZTD profile is derived from a combination of the Saastamoinen model and integration method (Fernandes et al., 2021). The specific process is as follows:
where K1=77.604 K hPa−1, and K2=64.79 K hPa−1. Ptop is the pressure of the top level, and φ is the grid latitude in radians. ZHDtop denotes the zenith hydrostatic delay above the top level, which is added to the integral ZTD, ensuring the accuracy of radiosonde ZTD as a reference value (Huang et al., 2023; Fan et al., 2023).
3.1 The spatiotemporal variation characteristics of surface pressure and ZWD
To reasonably account for the spatiotemporal dependency of the pressure and ZWD, the annual mean values, annual, semi-annual, diurnal, and semi-diurnal amplitudes of global ERA5 surface pressure and ZWD from 2015 to 2019 are determined by a least squares algorithm, which are surfaced as presented in Fig. 2. The annual mean pressure in high-altitude areas such as Greenland, the Tibetan Plateau, and Antarctica are generally small due to the low atmosphere density. The annual and semi-annual amplitudes in the middle and high latitudes are higher than those in the low latitudes. The geographical distribution of the diurnal and semi-diurnal amplitudes is opposite, indicating strong intraday variations in pressure in the low latitudes. The magnitude of ZWD is positively correlated with the atmospheric water vapor content, resulting in higher annual mean values in the tropics characterized by high temperature and abundant rainfall. Correspondingly, the ZWDs exhibit strong seasonal and intraday variations in these areas. Evident annual and semi-annual amplitudes of ZWD are observed in southern North America, northern Africa, and southeastern Asia, where the corresponding values exceed 50 mm. Additionally, ZWDs exhibit relatively high diurnal and semi-diurnal amplitudes in the tropical coastal area, and these intraday variations cannot be fully absorbed by the seasonal signal residuals in the modeling. It is demonstrated that the temporal variations in pressure and ZWD mainly depend on geolocation, and the intraday periods cannot be ignored. Therefore, a regular 1° grid is chosen to simulate the spatial variations in pressure and ZWD, and the following harmonic function is employed to account for the seasonal and intraday variations in the two parameters at each grid point:
where a0 is the annual mean value of pressure or ZWD. al, bl, cm, and dm are the coefficients of annual, semi-annual, diurnal, and semi-diurnal periodic terms, respectively. DOY and HOD denote the day of the year and the hour of the day, respectively.
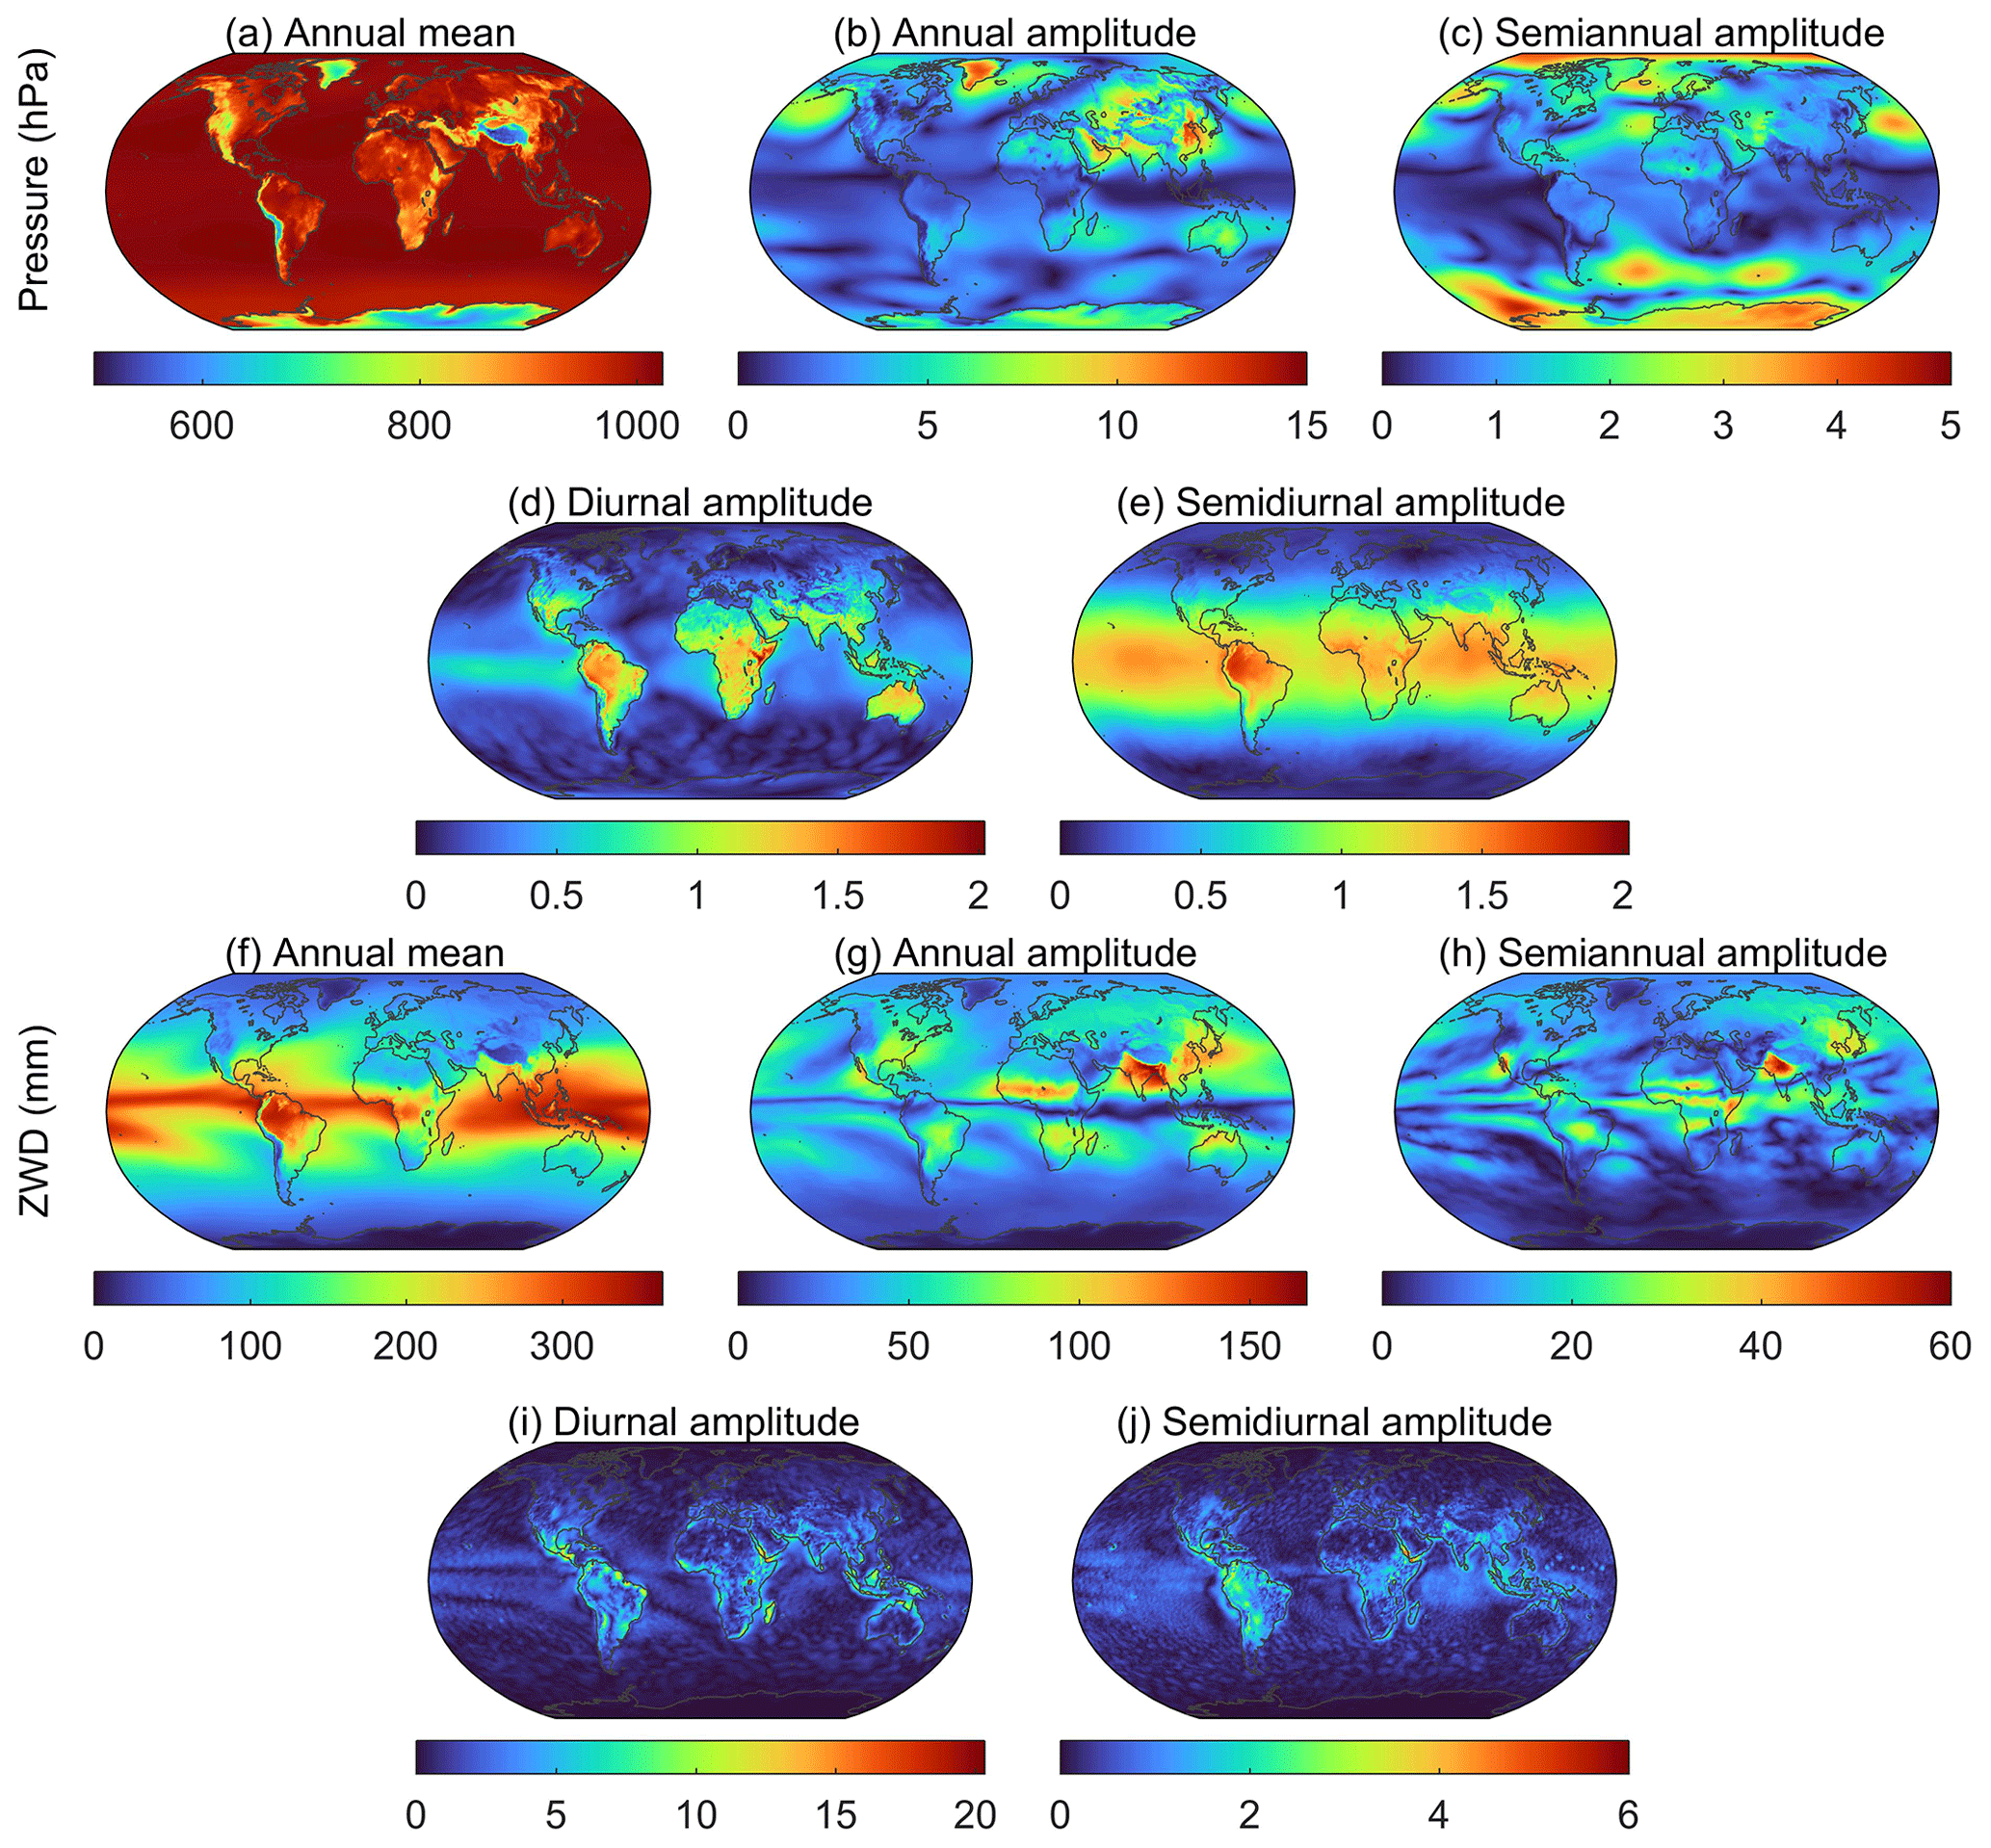
Figure 2The annual mean values, annual amplitude, semi-annual amplitude, diurnal, and semi-diurnal amplitudes of global ERA5 surface pressure (a–e) and ZWD (f–j) from 2015 to 2019. Note that the color bar scales of each subgraph are different.
3.2 Vertical fitting algorithm for pressure and ZWD
With the assumption of hydrostatic equilibrium, the dry-air differential equation for the determination of pressure based on temperature is expressed as follows (Kleijer, 2004):
where gm denotes mean gravity acceleration, and Rd=287.06 ± 0.01 J−1 kg−1. The temperature is nearly linear with height in the troposphere and stratosphere, and thus the lapse rate (λ) can be regarded as a constant value over a short vertical range. Substituting into Eq. (8), the pressure corresponding to the temperature at the sea level height (T0) and target height (Th) can be expressed as follows:
where , and thus, the above equation is integrated as follows:
Based on Taylor series expansion, Eq. (11) can be further expressed as follows:
According to the study of Wang et al. (2022), the vertical ZWD profiles can also be accurately fitted using a multi-order exponential function, and the corresponding equation is as follows:
where ZWD0 and ZWDh are the ZWD at sea level and a certain height above sea level (h), respectively. βPn and βWn denote the nth order height-scale factors of pressure and ZWD, respectively, which are determined by nonlinear least squares algorithm to achieve vertical correction without temperature as input.
The accuracies of pressure and ZWD fitted by exponential functions (EFs) of the order of 1 to 4 are investigated to determine the optimal one. The fitting results and residual profiles of six grid points at different geolocations are illustrated in Fig. 3. Evidently, the EFO1 struggles to simulate the nonlinear vertical variation in pressure. It generally underestimates the pressure in the range of 3–6 km, and the surface residuals even exceed 15 hPa. The EFO2 improves the fitting effect compared to the EFO1 but exhibits large residuals at the grid points of 20.5° N, 120.5° W and 50.5° N, 120.5° W. Notably, the EFO3 and EFO4 exhibit optimal performance and small vertical residuals which stay within ±2 hPa. Regarding the ZWD, the fitting residuals of EFO1 are obviously large below 3 km and exceed 70 m at the grid point of 0.5° S, 120° E. In the lower troposphere, the absolute residuals of EFO2 at the three tropical grid points are still more than 30 mm, whereas the residuals of EFO3 and EFO4 stay within ±15 mm at all six grid points. The above results demonstrate that EFO3 and EFO4 can accurately capture complicated vertical variations in pressure and ZWD.
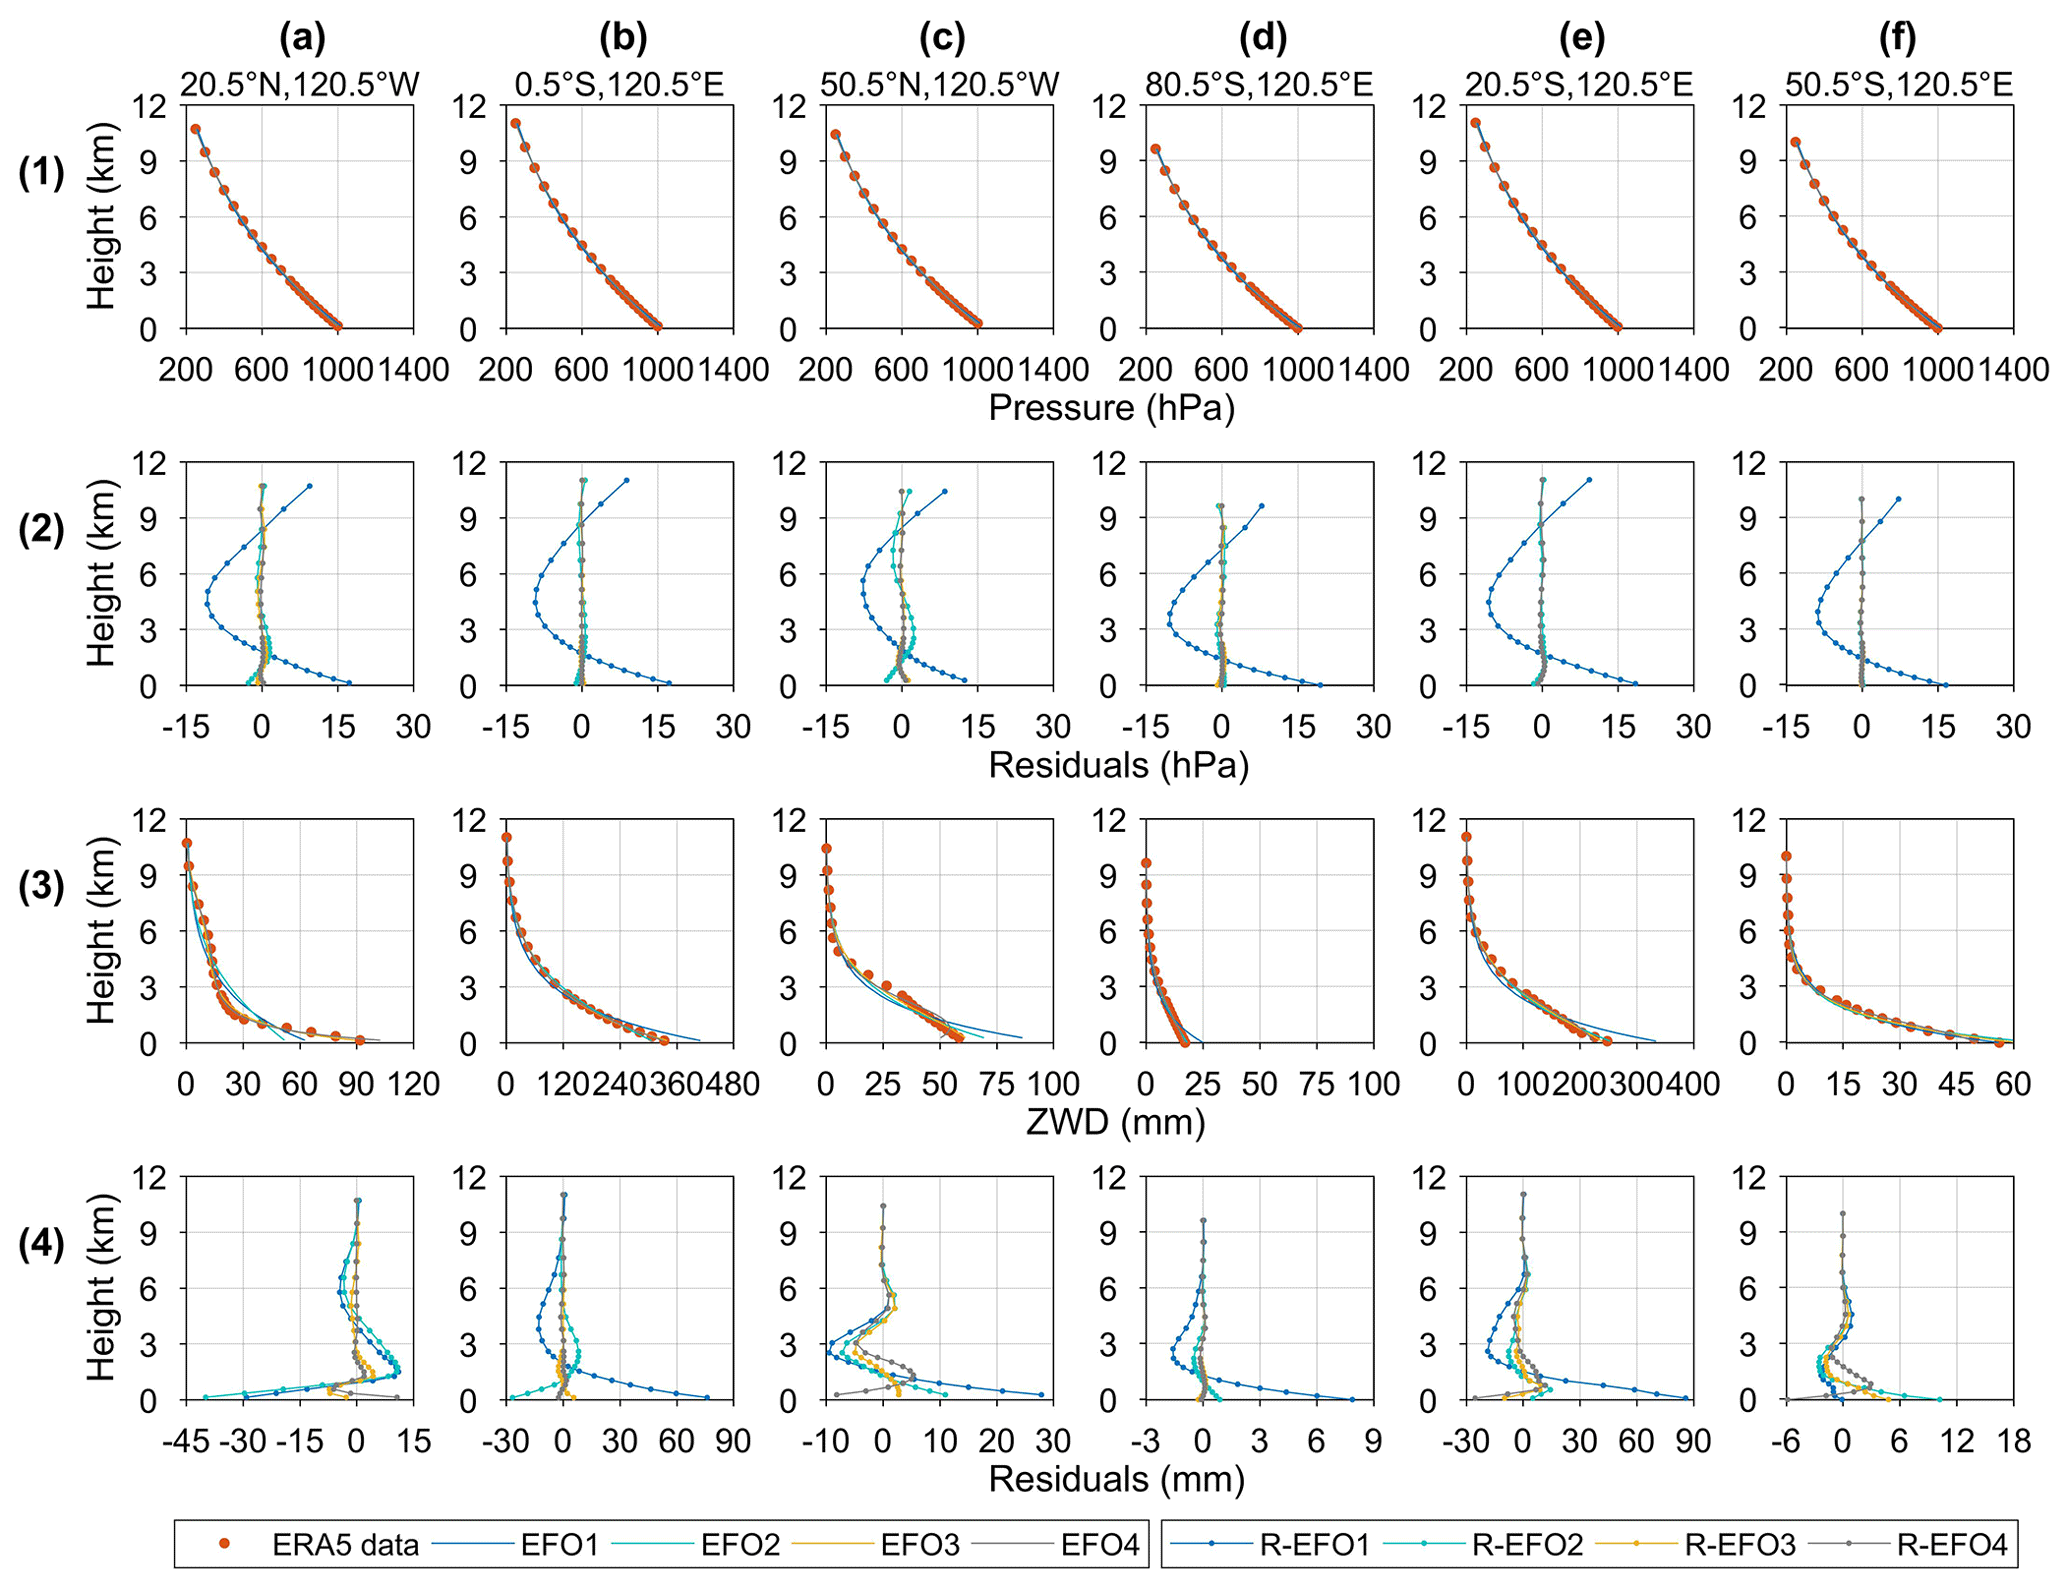
Figure 3The vertical data profiles (red dots), the exponential approximations, and fitting residual profiles of pressure (a1–f2) and ZWD (a3–f4) at six representative ERA5 grid points. EFO1, EFO2, EFO3, and EFO4 denote the exponential fitting function of the order of 1, 2, 3, and 4, respectively. R-EOF1, R-EOF2, R-EOF3, and R-EOF4 are the corresponding fitting residuals of the four solutions.
The global mean and maximum root mean square (rms) values of fitting residuals obtained by the four solutions are shown in Fig. 4. It is illustrated that the mean rms of the pressure fitted using EFO3 and EFO4 is less than 0.3 hPa on a global scale; they are clearly superior to those of EFO1 and EFO2. As for ZWD, EFO2 outperforms EFO1, but the maximum rms values still exceed 17 mm. EFO3 generally performs identically to the EFO4, and their mean rms values are less than 3.5 mm. As summarized above, the EFO1 and EFO2 cannot reasonably account for the vertical characteristics of ZWD and pressure. Hence, the EFO3 with relatively fewer coefficients is adopted as the core vertical correction function, which can be further expressed as follows:
where Pr and ZWDr are the pressure and ZWD at the reference height (hr), respectively. Pt and ZWDt are the pressure and ZWD at the target height (ht), respectively.
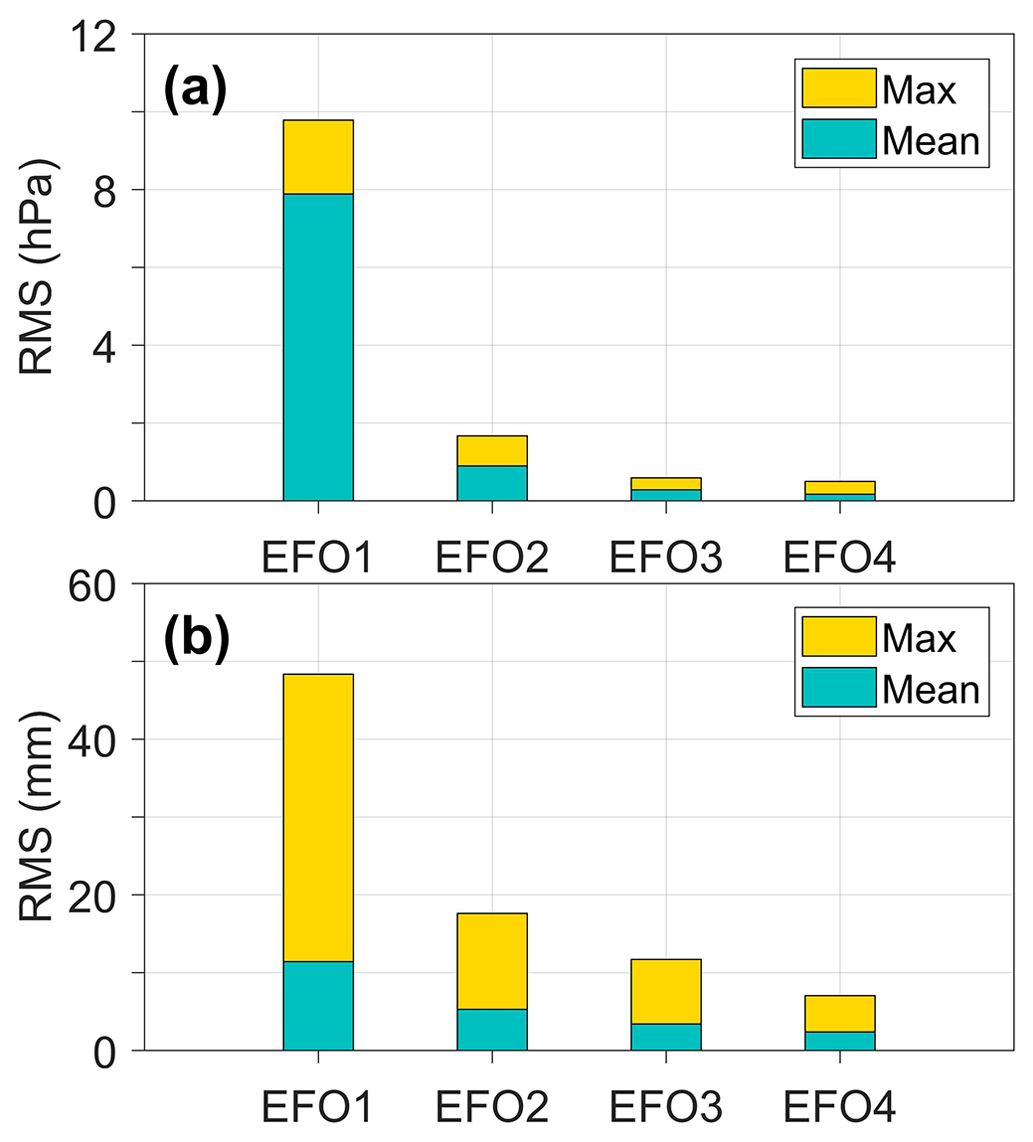
Figure 4The global mean and maximum rms values for pressure (a) and ZWD (b) fitted using EFO1, EFO2, EFO3, and EFO4.
3.3 Vertical fitting algorithm for pressure and ZWD
The fast Fourier transform is introduced to explore the periodicity of pressure and ZWD height-scale factors. As illustrated in Fig. 5, the height-scale factors mainly show annual and semi-annual periods.
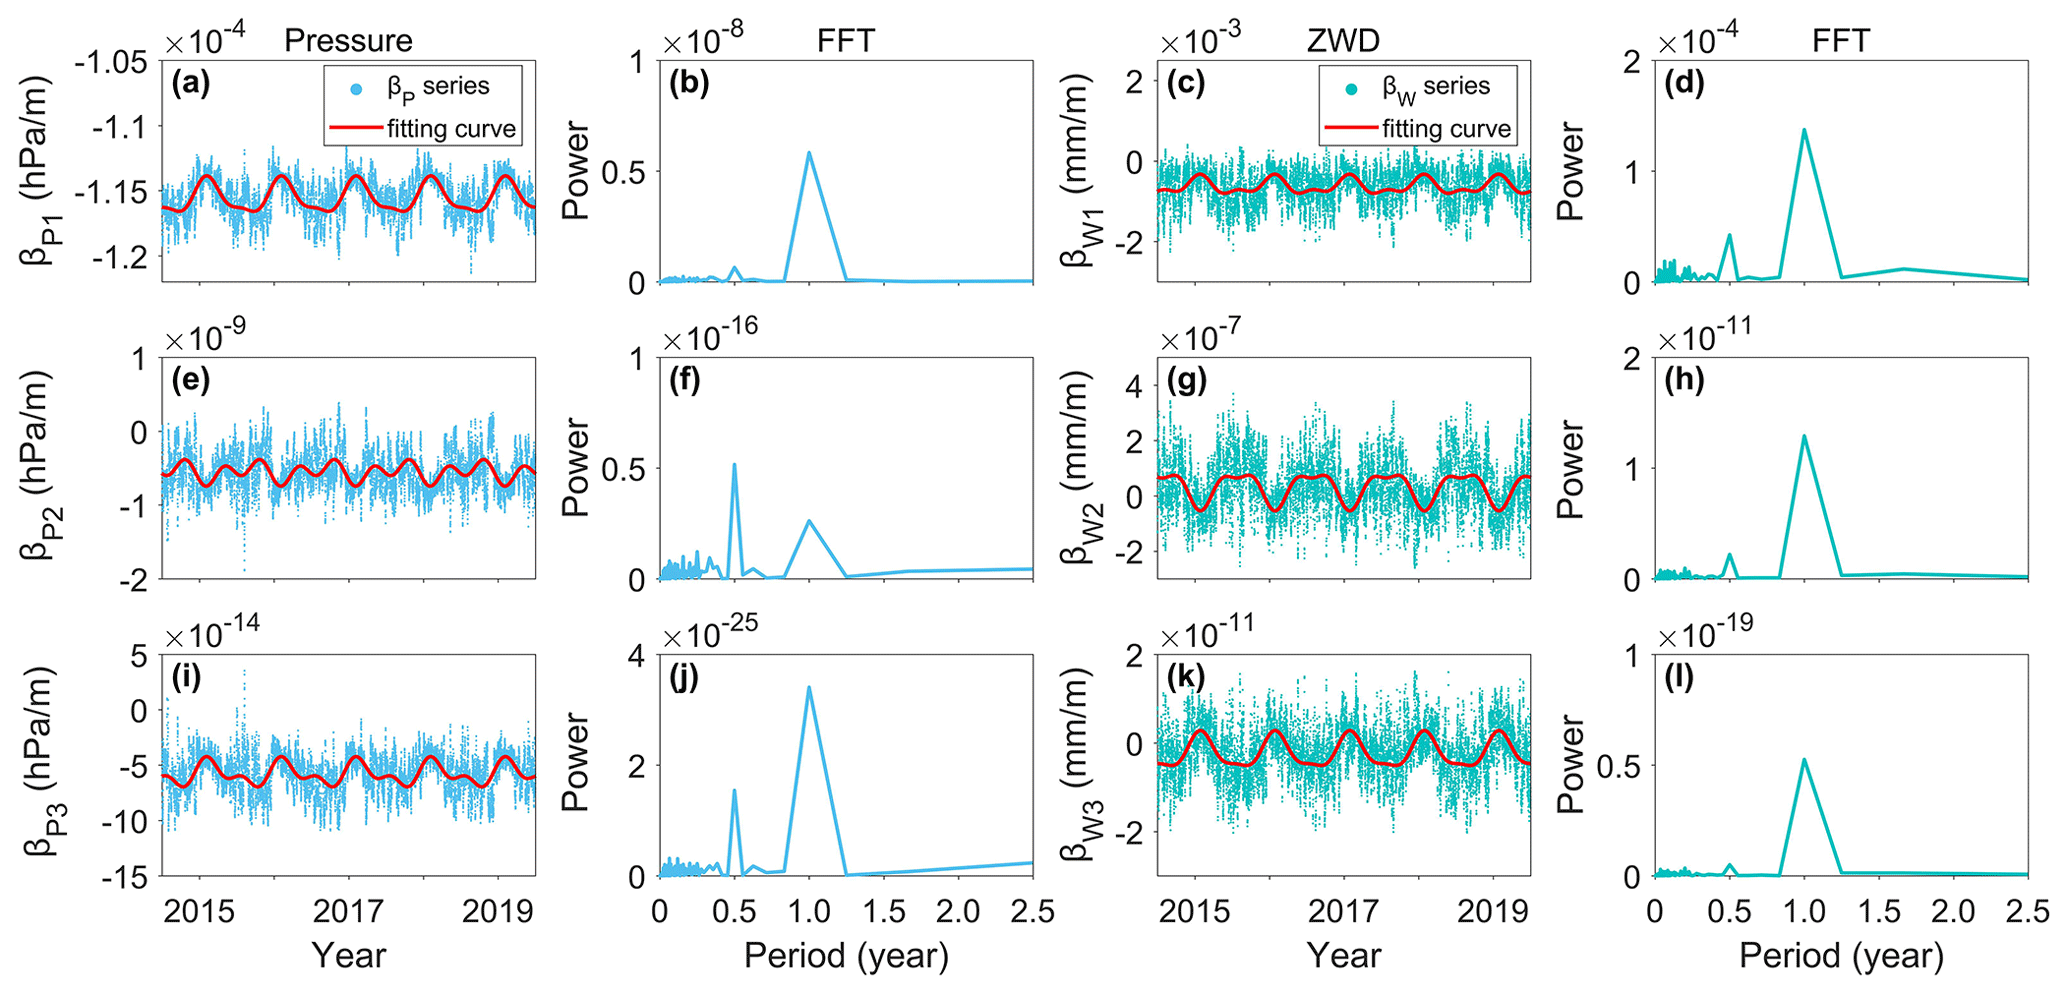
Figure 5The time series, fitting curves, and power spectral density of βP and βW of the first (a–d), second (e–h), and third (i–l) orders at the grid point of 20.5° N, 120.5° W.
To further investigate the spatiotemporal characteristics of pressure and ZWD height-scale factors, the annual mean and annual and semi-annual amplitudes of βP and βW are surfaced as presented in Figs. 6 and 7, respectively. The absolute annual mean values of βP1 gradually increase from the Equator to the poles, exhibiting larger negative values in the Tibetan Plateau and the Andes mountains than the other regions in the same latitudes. The annual mean values of βP2 and βP3 show evident differences between ocean and land, particularly in the mid-latitudes of the western hemisphere. Additionally, large annual and semi-annual amplitudes of the three height-scale factors can be found at high latitudes. If the seasonal variations cannot be properly accounted for, large errors will be introduced in the vertical extrapolation of pressure. Regarding the ZWD, the annual mean values of the three height-scale factors show typical atmospheric circulation patterns which are characterized by the sharp gradient changes from ocean to land in the Intertropical Convergence Zone (ITCZ). Large annual and semi-annual amplitudes of βW1, βW2 and βW3 are observed in northern Africa and the South Atlantic. The above findings demonstrate that three height-scale factors of pressure and ZWD are not constant values in time or space.
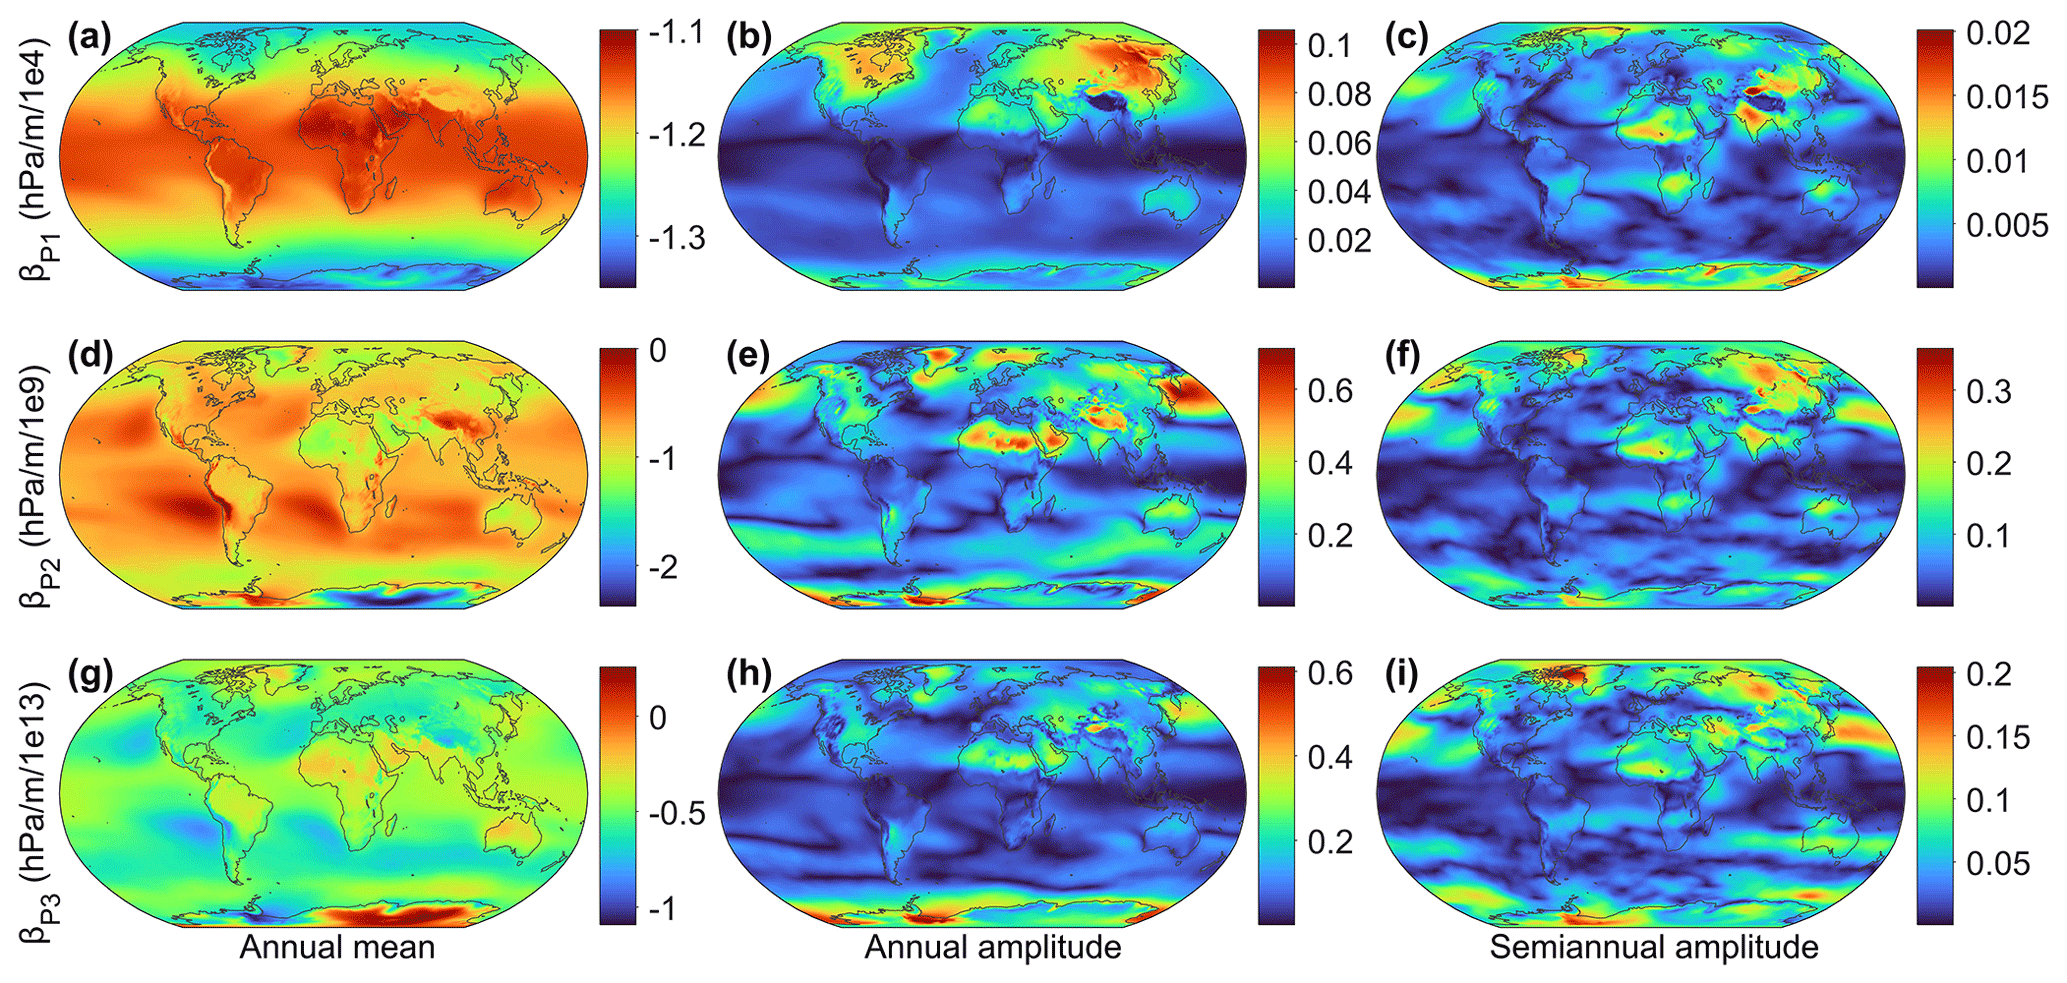
Figure 6Distributions of the annual mean values and annual and semi-annual amplitudes of βP1 (a–c), βP2 (d–f), and βP3 (g–i). Note that the color bar scales of each subgraph are different.
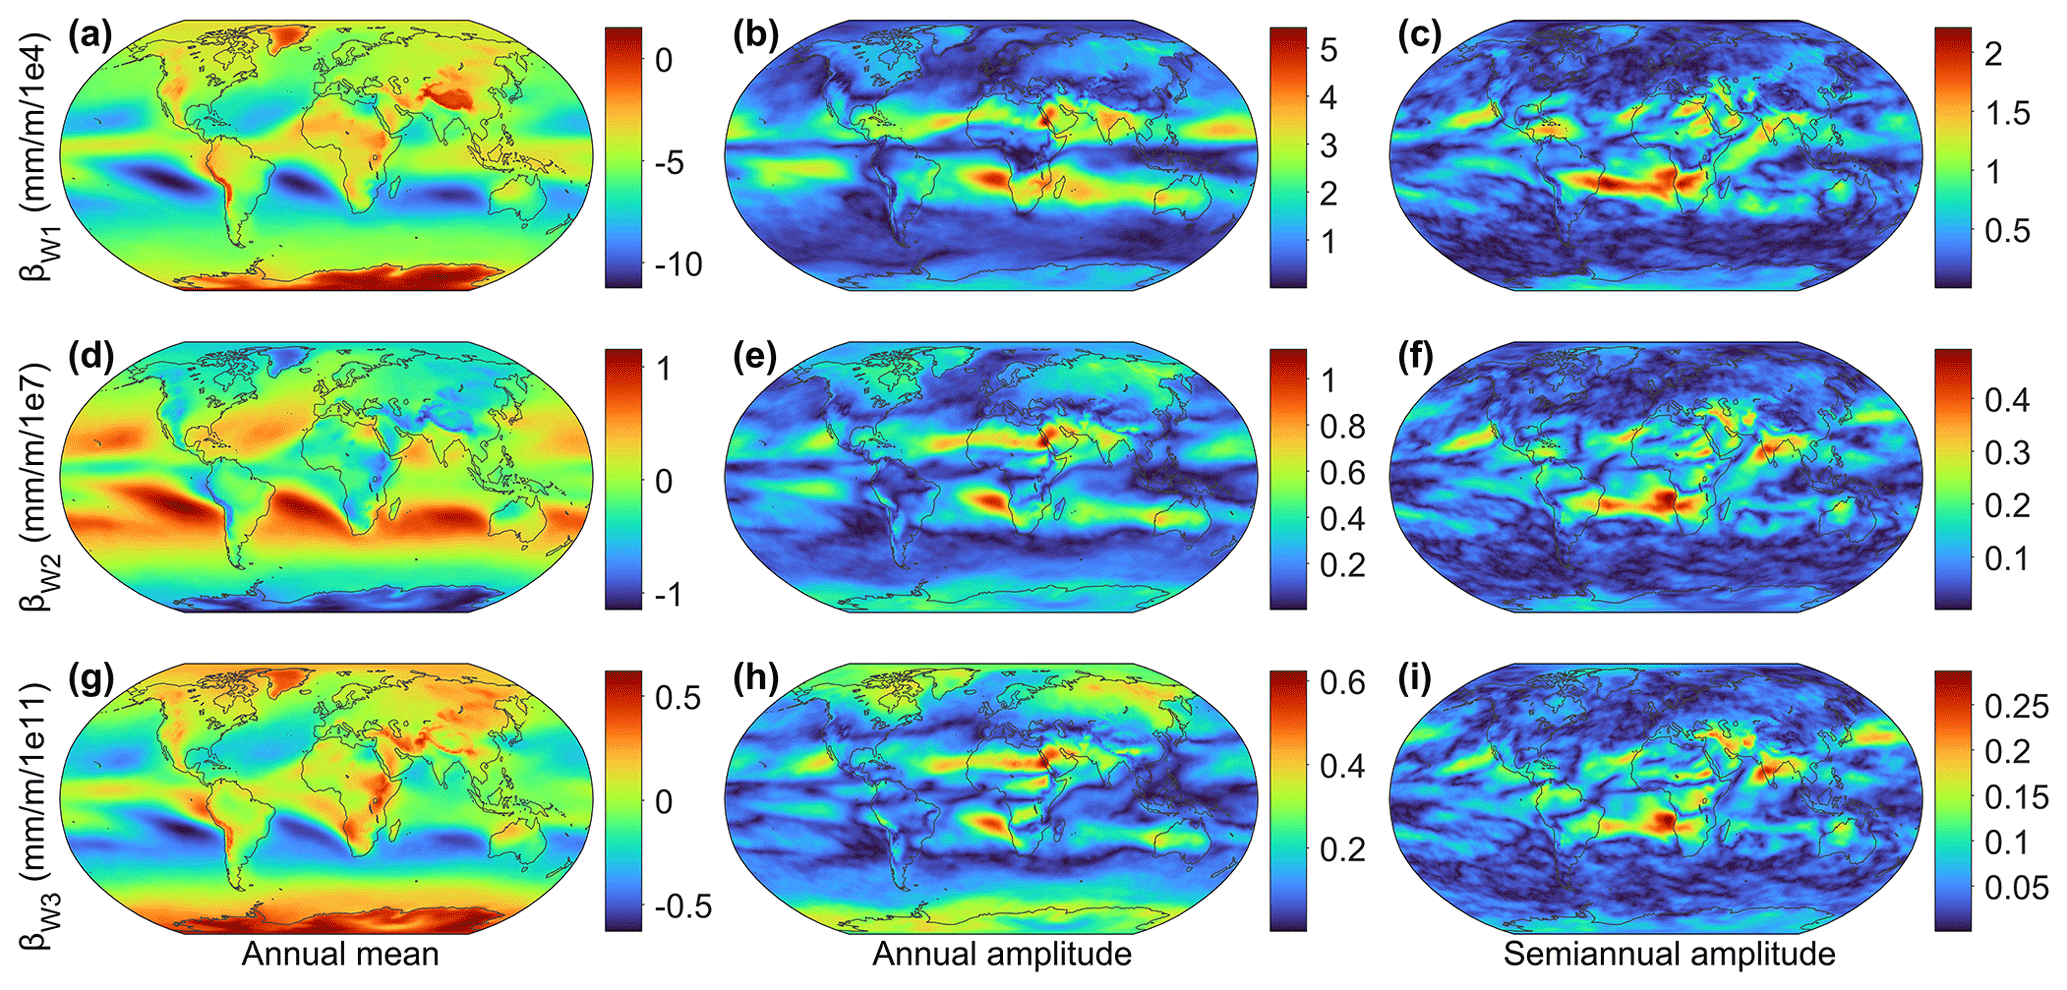
Figure 7Distributions of the annual mean values and annual and semi-annual amplitudes of βW1 (a-c), βW2 (d–f), and βW3 (g–i). Note that the color bar scales of each subgraph are different.
To enhance the vertical performance of the new model, the spatial grid windows with the same horizontal resolution (1° × 1°) as the surface model in Sect. 3.1 are adopted to characterize the horizontal spatial variations in the height-scale factors. Meanwhile, the following harmonic functions are used to fit the βP and βW time series at each grid point:
where , , and are annual mean and annual and semi-annual amplitudes of the nth-order height-scale factors of pressure or ZWD.
By integrating Eq. (13) with Eq. (14), the final vertical expression of pressure and ZWD is derived as follows:
Finally, combining the surface (Eq. 7) and vertical correction (Eq. 15) modules, the improved global pressure and ZWD (IGPZWD) model is expressed as follows:
The development and use of the IGPZWD model are summarized in the flowchart depicted in Fig. 8, including surface and vertical correction modules. With the geodetic location and time specified as DOY and HOD as inputs, the pressure and ZWD of the nearest four model grid points at the target height are determined according to Eq. (17). Thereafter, a bilinear interpolation method is carried out to calculate the target pressure and ZWD. Furthermore, the target ZHD and ZTD are obtained based on the Saastamoinen model as follows:
where PIGPZWD and ZWDIGPZWD are the pressure and ZTD predicted by the IGPZWD model, respectively.
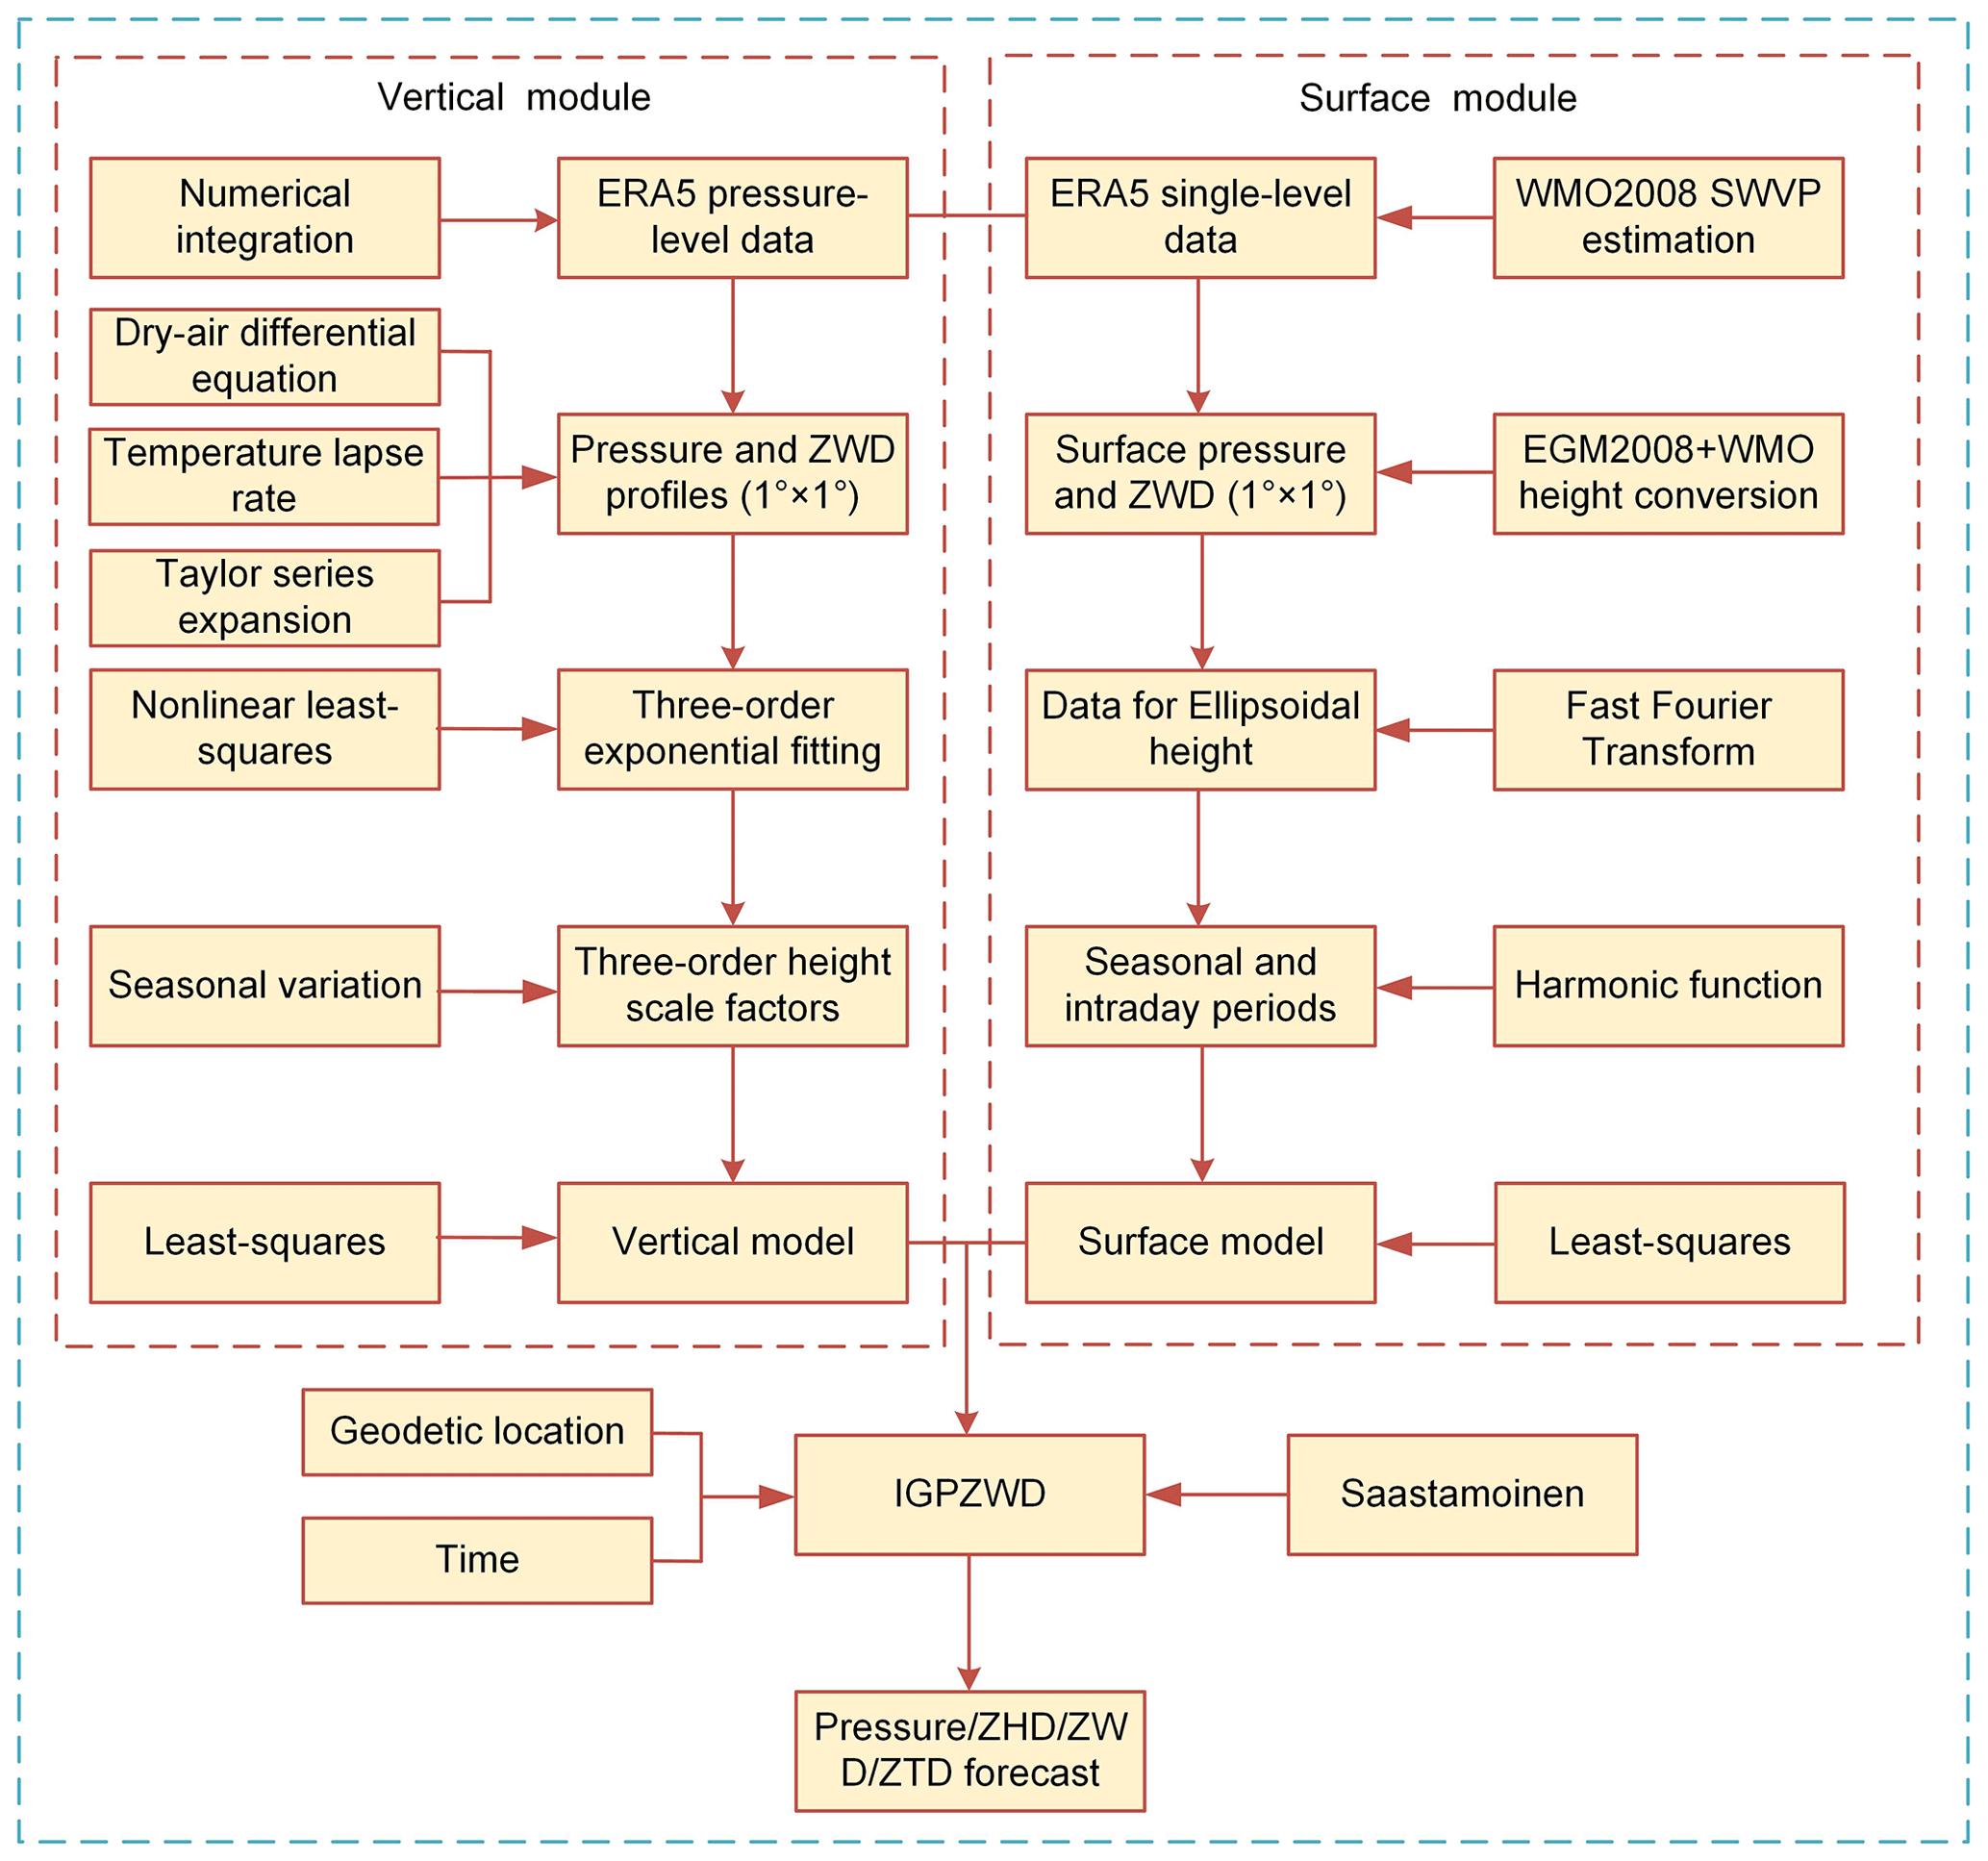
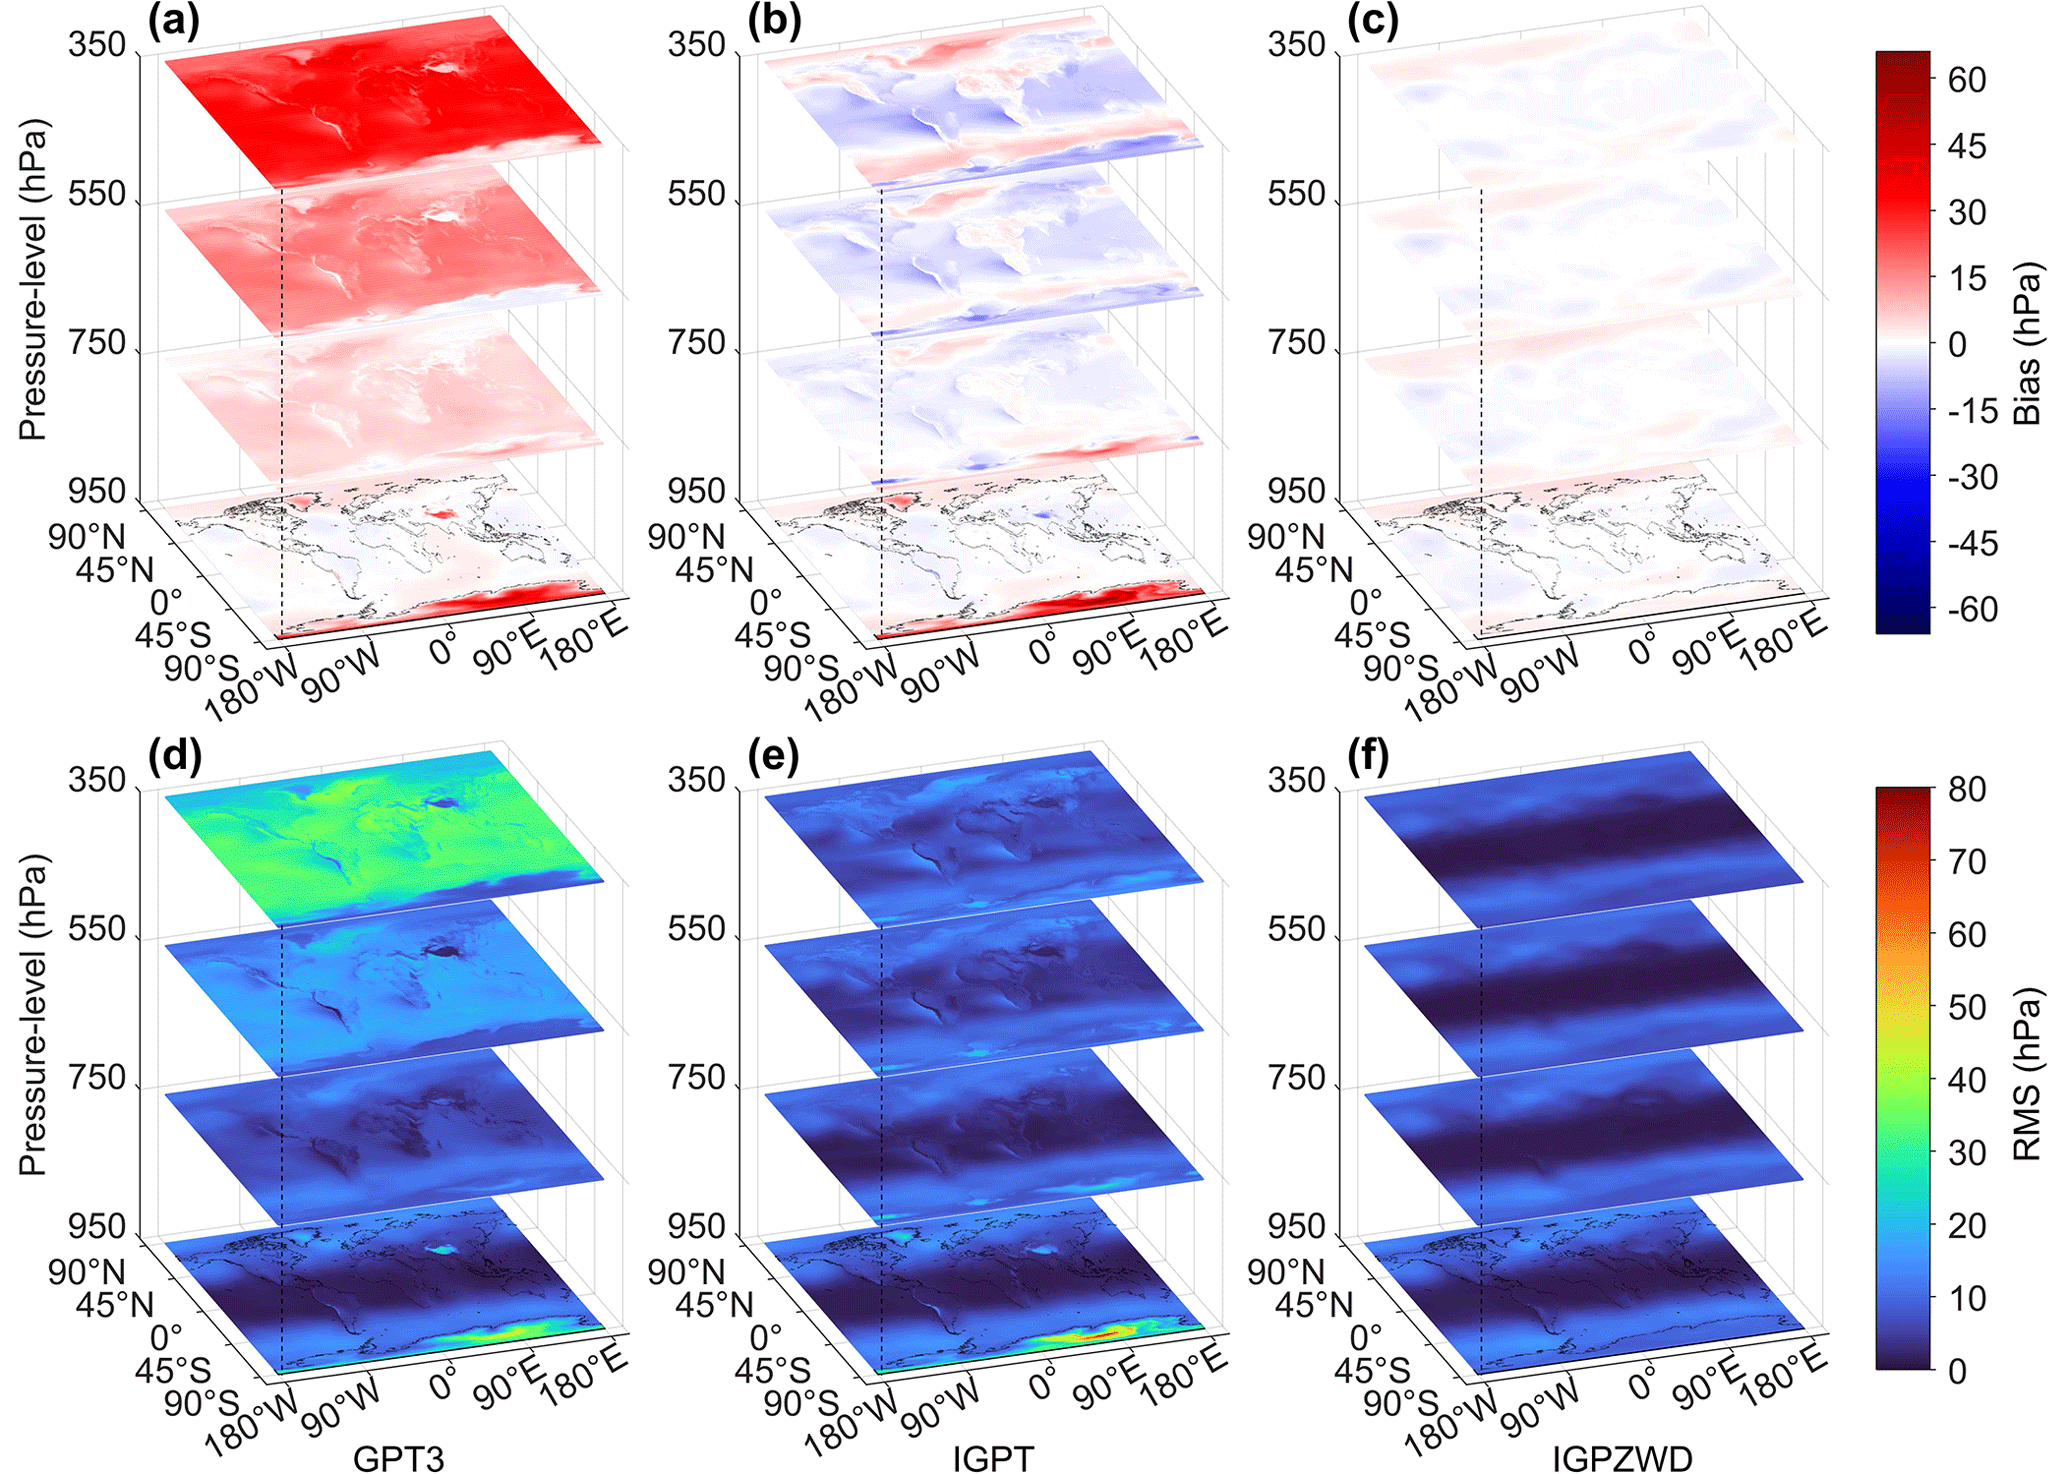
Figure 9Global distribution of bias (a–c) and rms (d–f) for the pressure predicted by the GPT3, IGPT, and IGPZWD models validated using the ERA5 pressure at the levels of 950, 750, 550, and 350 hPa in 2020.
In this section, the accuracy and spatial stability of the IGPZWD model are comprehensively investigated and analyzed using the ERA5 hourly pressure level data and radiosonde data profiles below 15 km in 2020. In addition to the most commonly used GPT3 model, the state-of-the-art IGPT model and GTrop model are introduced to verify the accuracy advantages of the pressure and ZWD predicted by the IGPZWD model, respectively. Furthermore, the performance of IGPZWD-predicted ZTD is evaluated by comparing with GPT3, GTrop, and reconstructed GPT3 models (RGPT3).
4.1 Evaluation with ERA5-derived pressure and ZWD
It is noted that the GTrop model does not directly provide pressure prediction. Although the pressure can be converted from GTrop-predicted ZHD based on the Saastamoinen model, it will result in a non-negligible loss of accuracy. Consequently, taking the pressure and ZWD profiles from ERA5 in 2020 as reference, the global accuracies of those predicted by the GPT3, IGPT, and IGPZWD models at four representative pressure levels are presented in Fig. 9. The GPT3 model generally overestimates the pressure at four levels, showing systematic positive biases which gradually increase with altitude, and the mean rms at 350 hPa even exceeds 28 hPa. The IGPT-predicted pressure shows greater consistency with the ERA5 data than that of the GPT3 model at the upper three levels, but it performs poorly in the bottom level. The reason is that the IGPT3 model applies the same inaccurate pressure extrapolation method as the GPT3 model below 2 km (Li et al., 2021). Compared to the IGPT and GPT3 models, the IGPZWD model shows better performance at each level and achieves an overall unbiased pressure prediction in the tropical regions.
Figure 10 depicts the vertical accuracies of pressure profiles predicted by the GTP3, GTrop, and IGPZWD models in three representative regions with different climatic environments and geographical locations. The IGPZWD model exhibits overall optimal accuracy and stability with no significant sudden change. In the Tibetan Plateau and Antarctic, the rms and bias values of the GPT3 model show evident and sharp trends of first decreasing and then increasing with altitude due to unreasonable pressure extrapolation method. Above 800 hPa, the IGPT model tends to underestimate the pressure in the Andes mountains region, inducing systematic negative bias and relatively poorer rms. Overall, the IGPZWD model achieves great pressure prediction on both the surface and in the upper air, which benefits from the consideration of the seasonal variations for the pressure and height-scale factors.
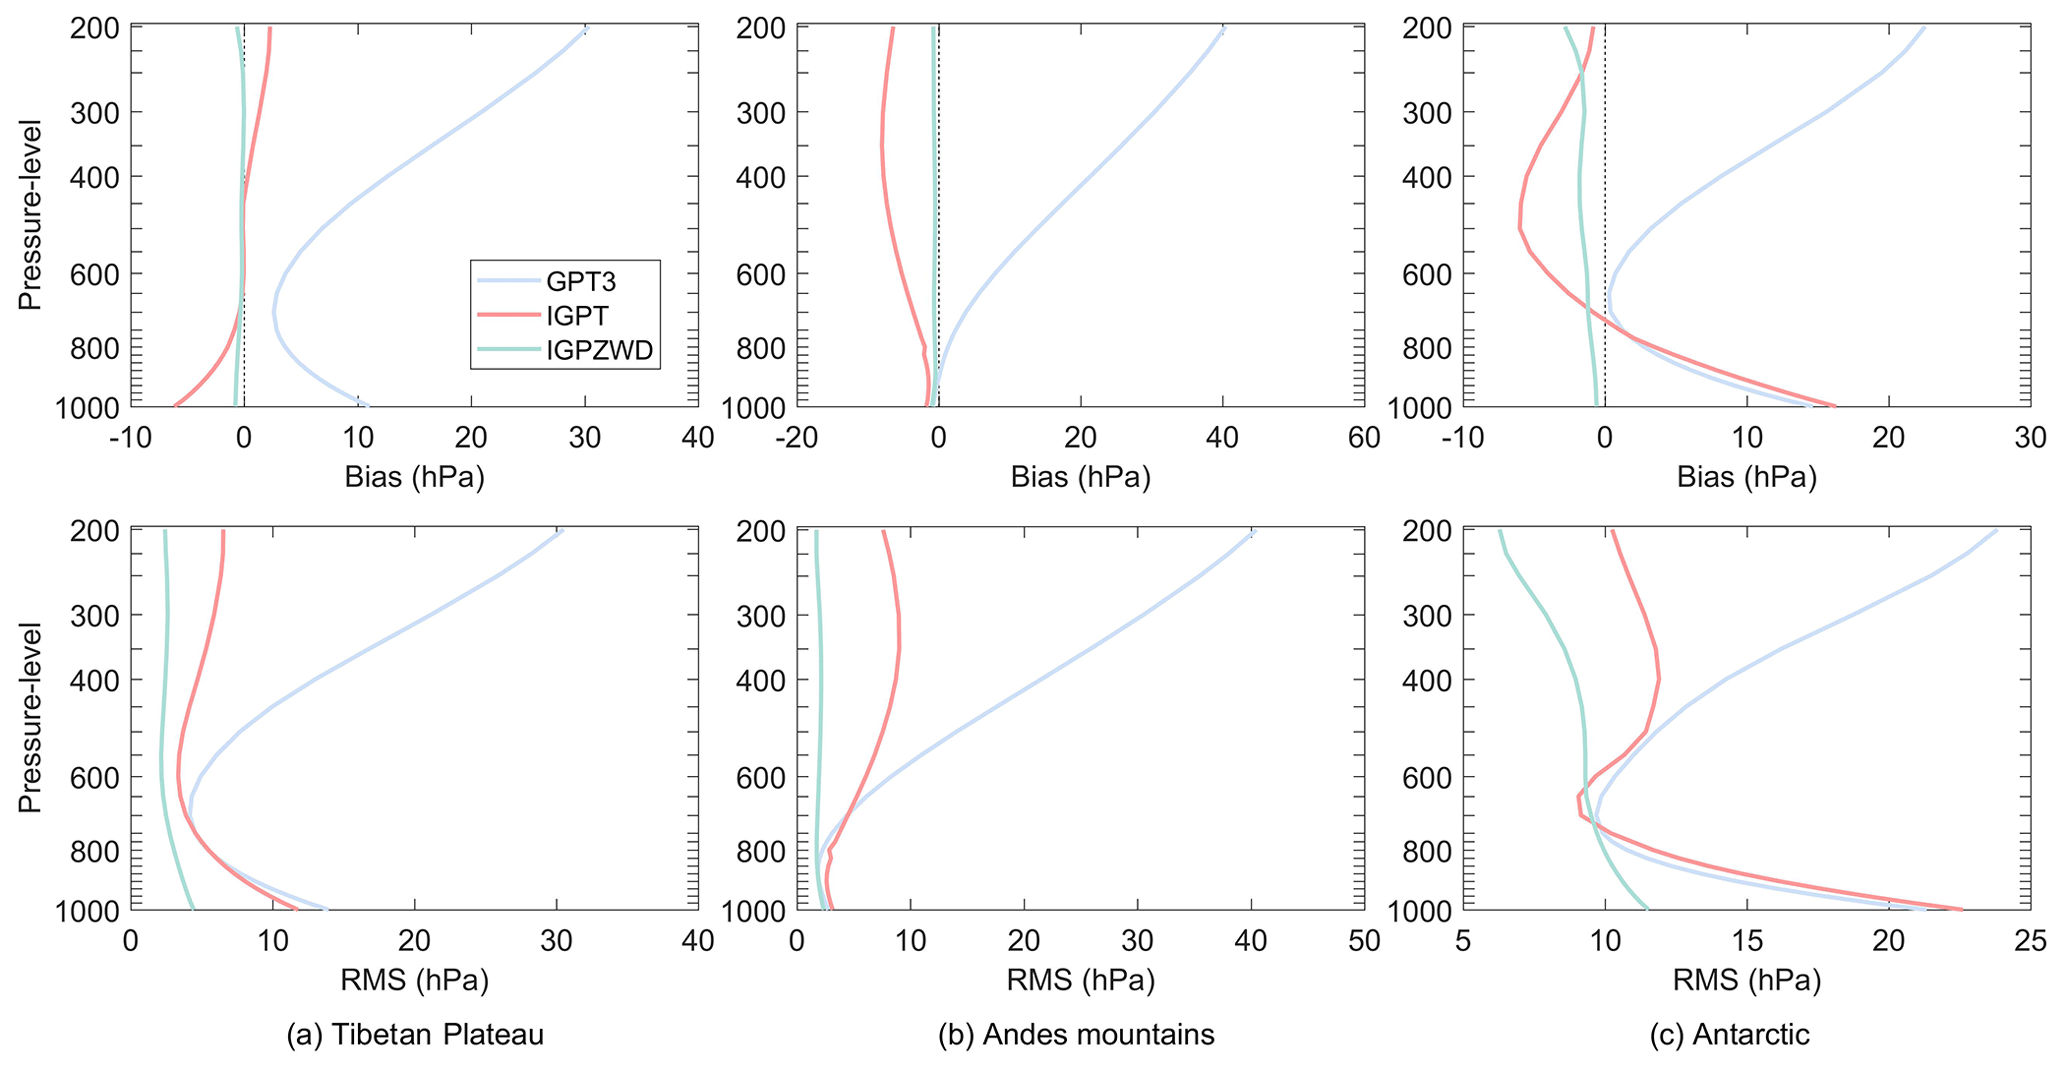
Figure 10Bias and rms of pressure profiles predicted by the GPT3, IGPT, and IGPZWD models validated using the ERA5 pressure from 1000 to 200 hPa in 2020. The three selected regions are the Tibetan Plateau (a), Andes mountains (b), and Antarctica (c).
The statistical results of model-predicted ZWD validated using ERA5 profiles are shown in Figs. 11 and 12. The magnitude of ZWD gradually decreases with increasing altitude, but the GPT3 model still shows a significant systematic positive bias at 350 hPa. This may be due to the inaccurate estimation of the water vapor decrease factor resulting in the accumulation of vertical errors. In contrast to GPT3 model, the GTrop and IGPZWD models perform better at 550 and 350 hPa, showing smaller bias and rms values in low latitudes. Furthermore, the high-frequency moist convection effect is generally accompanied by drastic spatiotemporal changes in water vapor in the tropics, which makes it difficult to capture the temporal variation in ZWD using empirical models. Correspondingly, the ZWDs predicted by the three models show poor consistencies with ERA5 ZWD in the low-latitude oceans at 950 hPa. Nonetheless, the IGPZWD model exhibits the smallest mean bias at 350 hPa, with a mean rms of 0.9 mm which corresponds to 63.4 % and 29.5 % improvements against GPT3 and GTrop models, respectively.
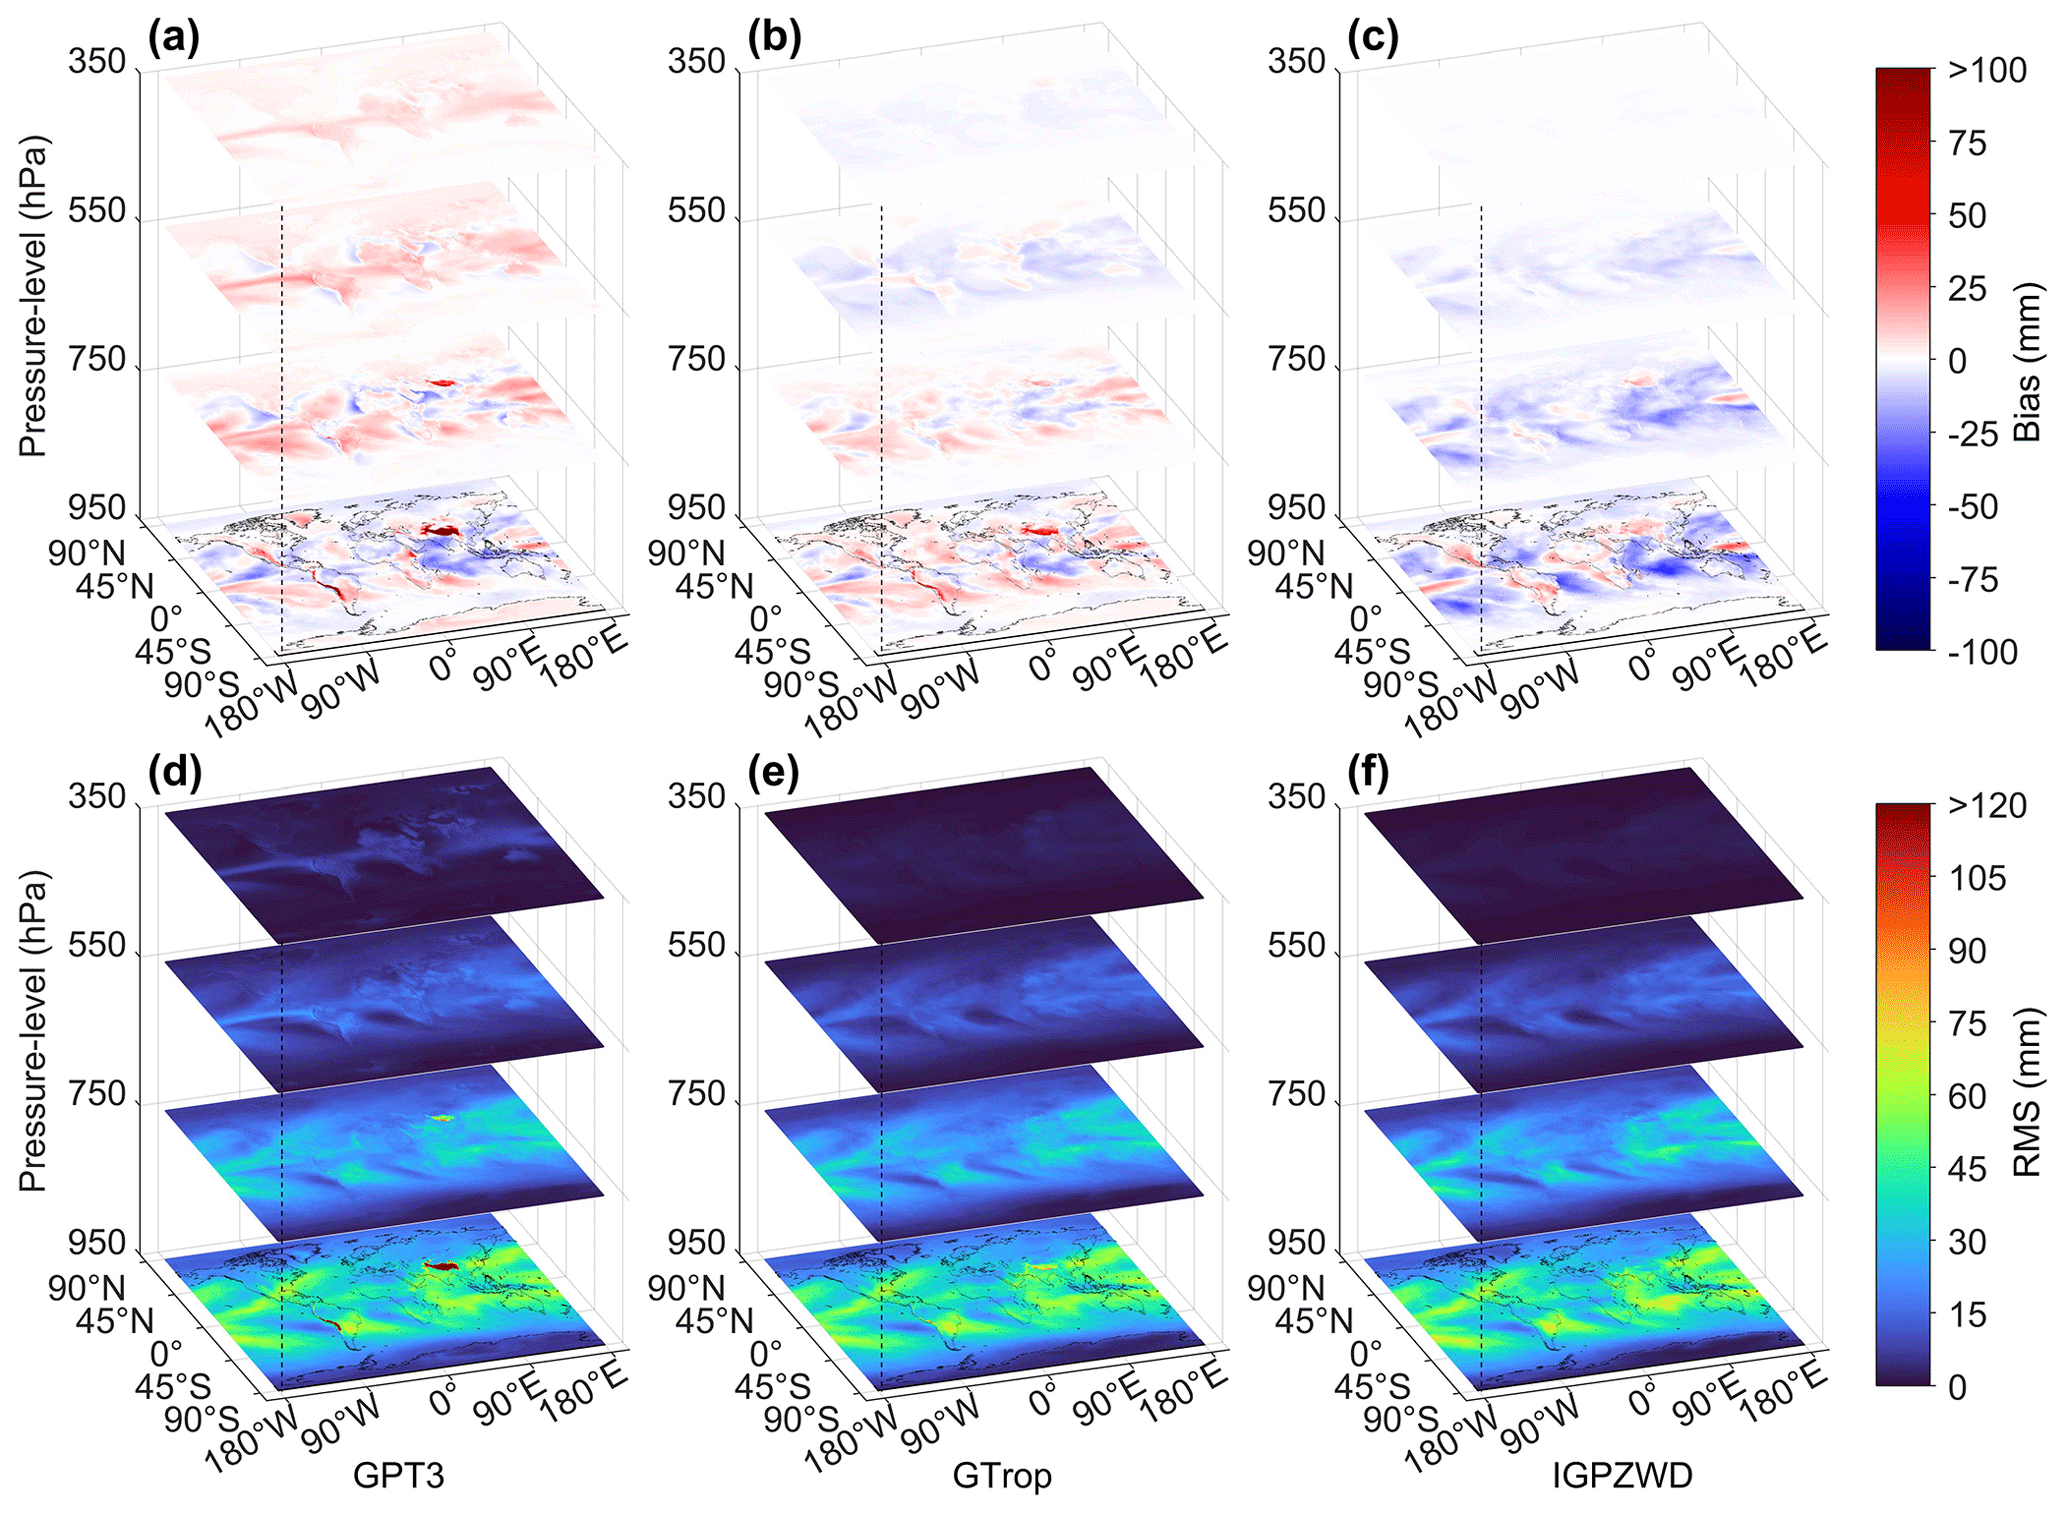
Figure 11Global distribution of bias (a–c) and rms (d–f) for the ZWD predicted by the GPT3, GTrop, and IGPZWD models validated using the ERA5 ZWD at the levels of 950, 750, 550, and 350 hPa in 2020.
Figure 12 illustrates that the GPT3 and GTrop models exhibit an obviously positive bias in the Andes mountains and Tibetan Plateau below 800 hPa, and the rms values of GPT3 exceed 100 mm in the Tibetan Plateau region. In contrast, the IGPZWD model exhibits smaller bias values in these regions, and the rms values are smaller than 40 mm. In the Antarctica, IGPZWD outperforms the other two models, achieving overall unbiased ZWD prediction above 400 hPa. It is concluded that IGPZWD-predicted ZWD has a certain vertical accuracy advantage compared to GTrop, and it is significantly more accurate than GPT3. Although the IGPZWD-predicted ZWD exhibits superior performance in high-altitude areas, the improvement in the surface is negligible. It is concluded that developing surface ZWD models is challenging. Nevertheless, substantial studies have proven that the cubic polynomial can effectively improve the fitting effect of ZWD profiles at low altitudes, which can be the algorithm reference for a future enhanced model construction (Li et al., 2023; Xu et al., 2023).
4.2 Validation with radiosonde-derived pressure and ZWD
Initially, different height systems between the radiosonde and model have been unified according to the 2008 Earth Gravitational Model (EGM) (Pavlis et al., 2012) and World Meteorological Organization (WMO) 2018 standard measurement (Yuan et al., 2023). Subsequently, taking the longitude, latitude, heights, DOY, and UTC of each data point on the filtered radiosonde profiles below 15 km as inputs, four models are employed to predict the corresponding ZWD and atmospheric pressure. Thereafter, the pressure and ZWD profiles derived from radiosonde observation in 2020 are used as references to evaluate the model-predicted pressure and ZWD. To investigate the applicability of the three models at different height ranges below 15 km, the accuracies are statistically analyzed with a vertical sampling interval of 3 km.
The bias and rms values of pressure predicted by GPT3, IGPT, and IGPZWD models at three temperature zones are presented in Fig. 13. It can be seen that the GPT3 model exhibits a systematic positive bias above 3 km, with a large mean bias value of 29 hPa in the temperate zone at the range of 12–15 km. Evidently, the accuracy of the GPT3 model gradually decreases with the increase in altitude, indicating that its pressure extrapolation scheme is inapplicable when the height difference is large. The IGPT model exhibits superior accuracy compared to the GPT3 model in the temperate and tropical regions where the intraday variations in pressure are strong, which benefits from the consideration of diurnal and semi-diurnal terms in pressure. The IGPZWD model further effectively improves the accuracy compared to IGPT model, achieving an almost unbiased estimation of pressure with rms improvements of 21.8 %–41.1 % in tropical and 68.7 %–82.9 % in temperate zones. In addition, the rms of the IGPZWD model has improved by over 94 % compared to GPT3 model beyond 6 km in tropical regions, indicating the feasibility of the proposed vertical correction algorithm. In summary, it has been verified that the exponential function with three orders has stronger accuracy advantages and robustness in vertical pressure extrapolation compared to existing models such as virtual temperature and the adiabatic models. In addition, we further achieved accurate prediction of the height-scale factor time series for pressure.
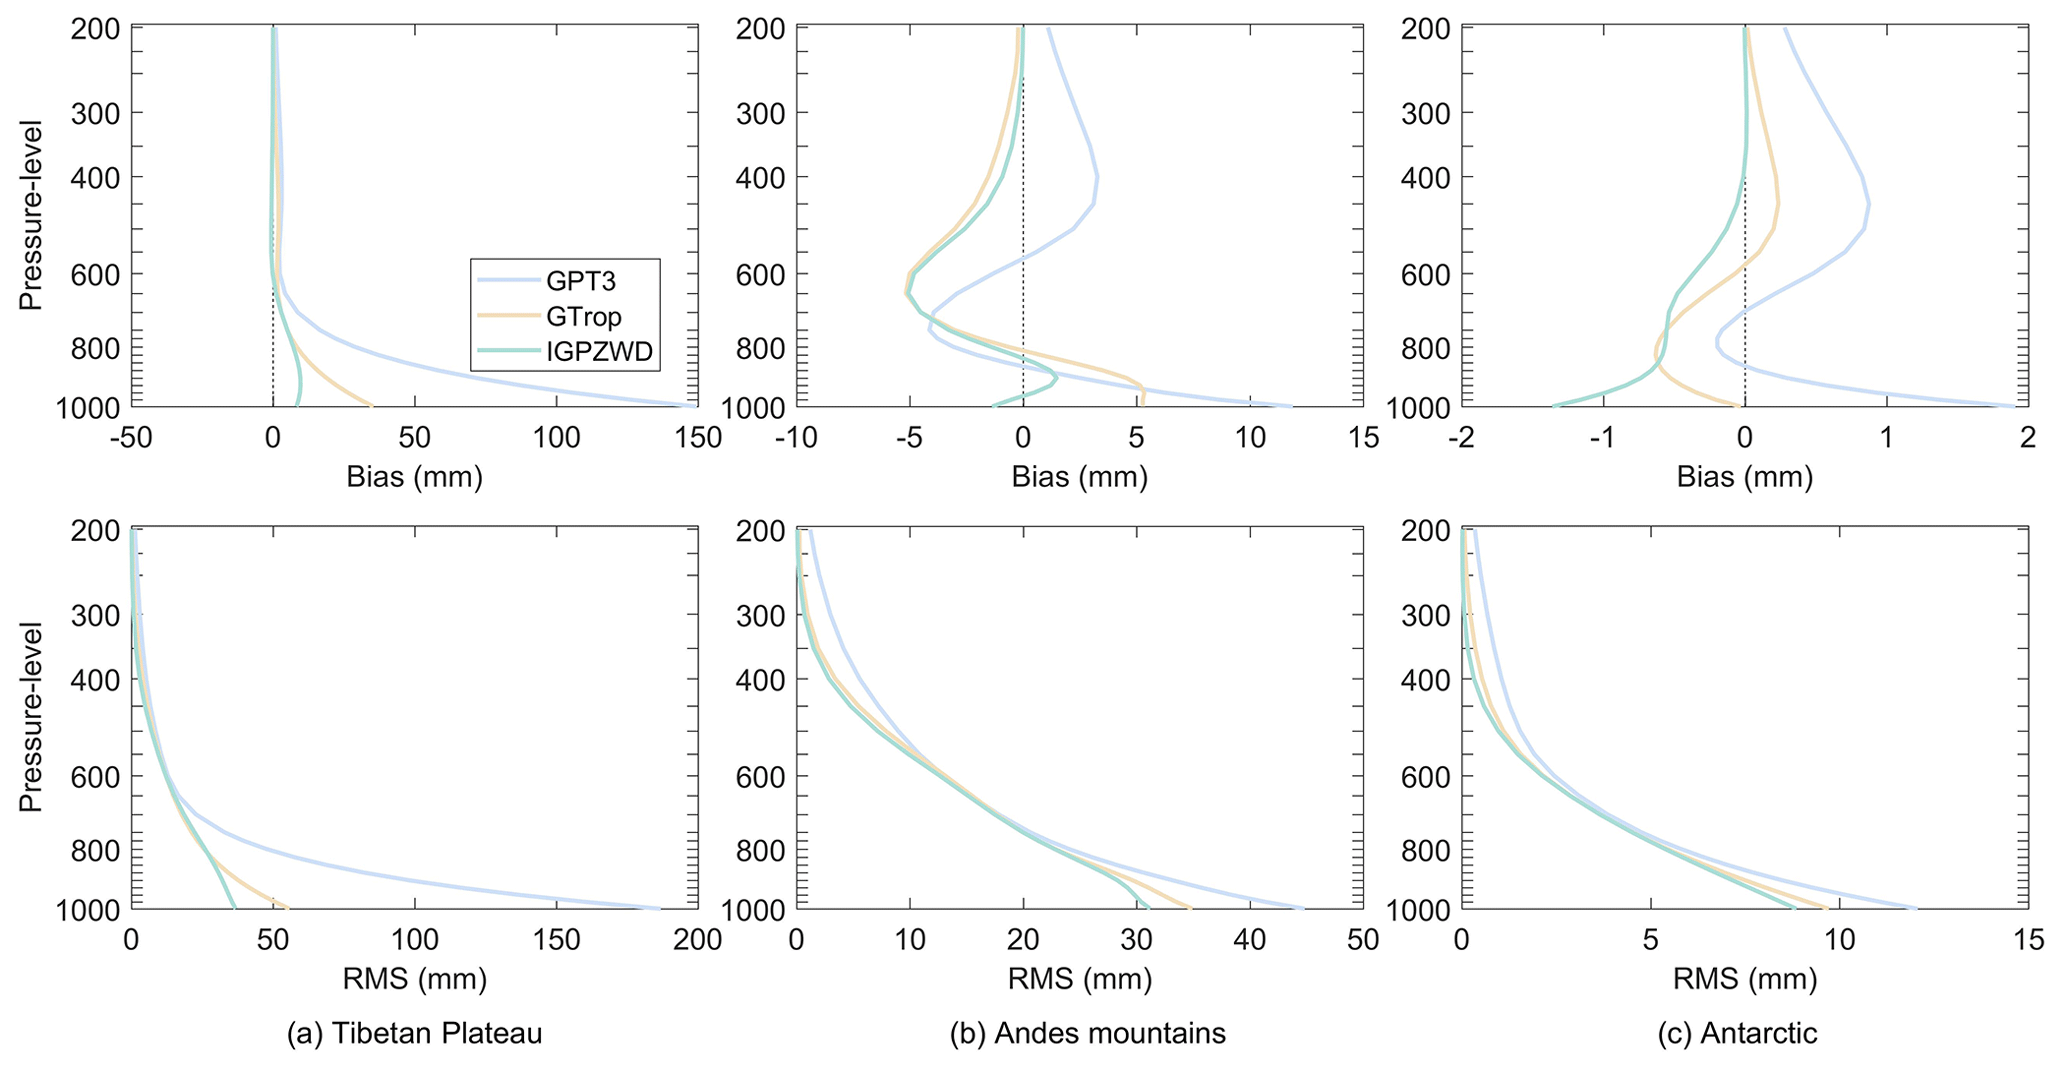
Figure 12Bias and rms of ZWD profiles predicted by the GPT3, IGPT, and IGPZWD models validated using the ERA5 ZWD from 1000 to 200 hPa in 2020. The three selected regions are the Tibetan Plateau (a), Andes mountains (b), and Antarctica (c).
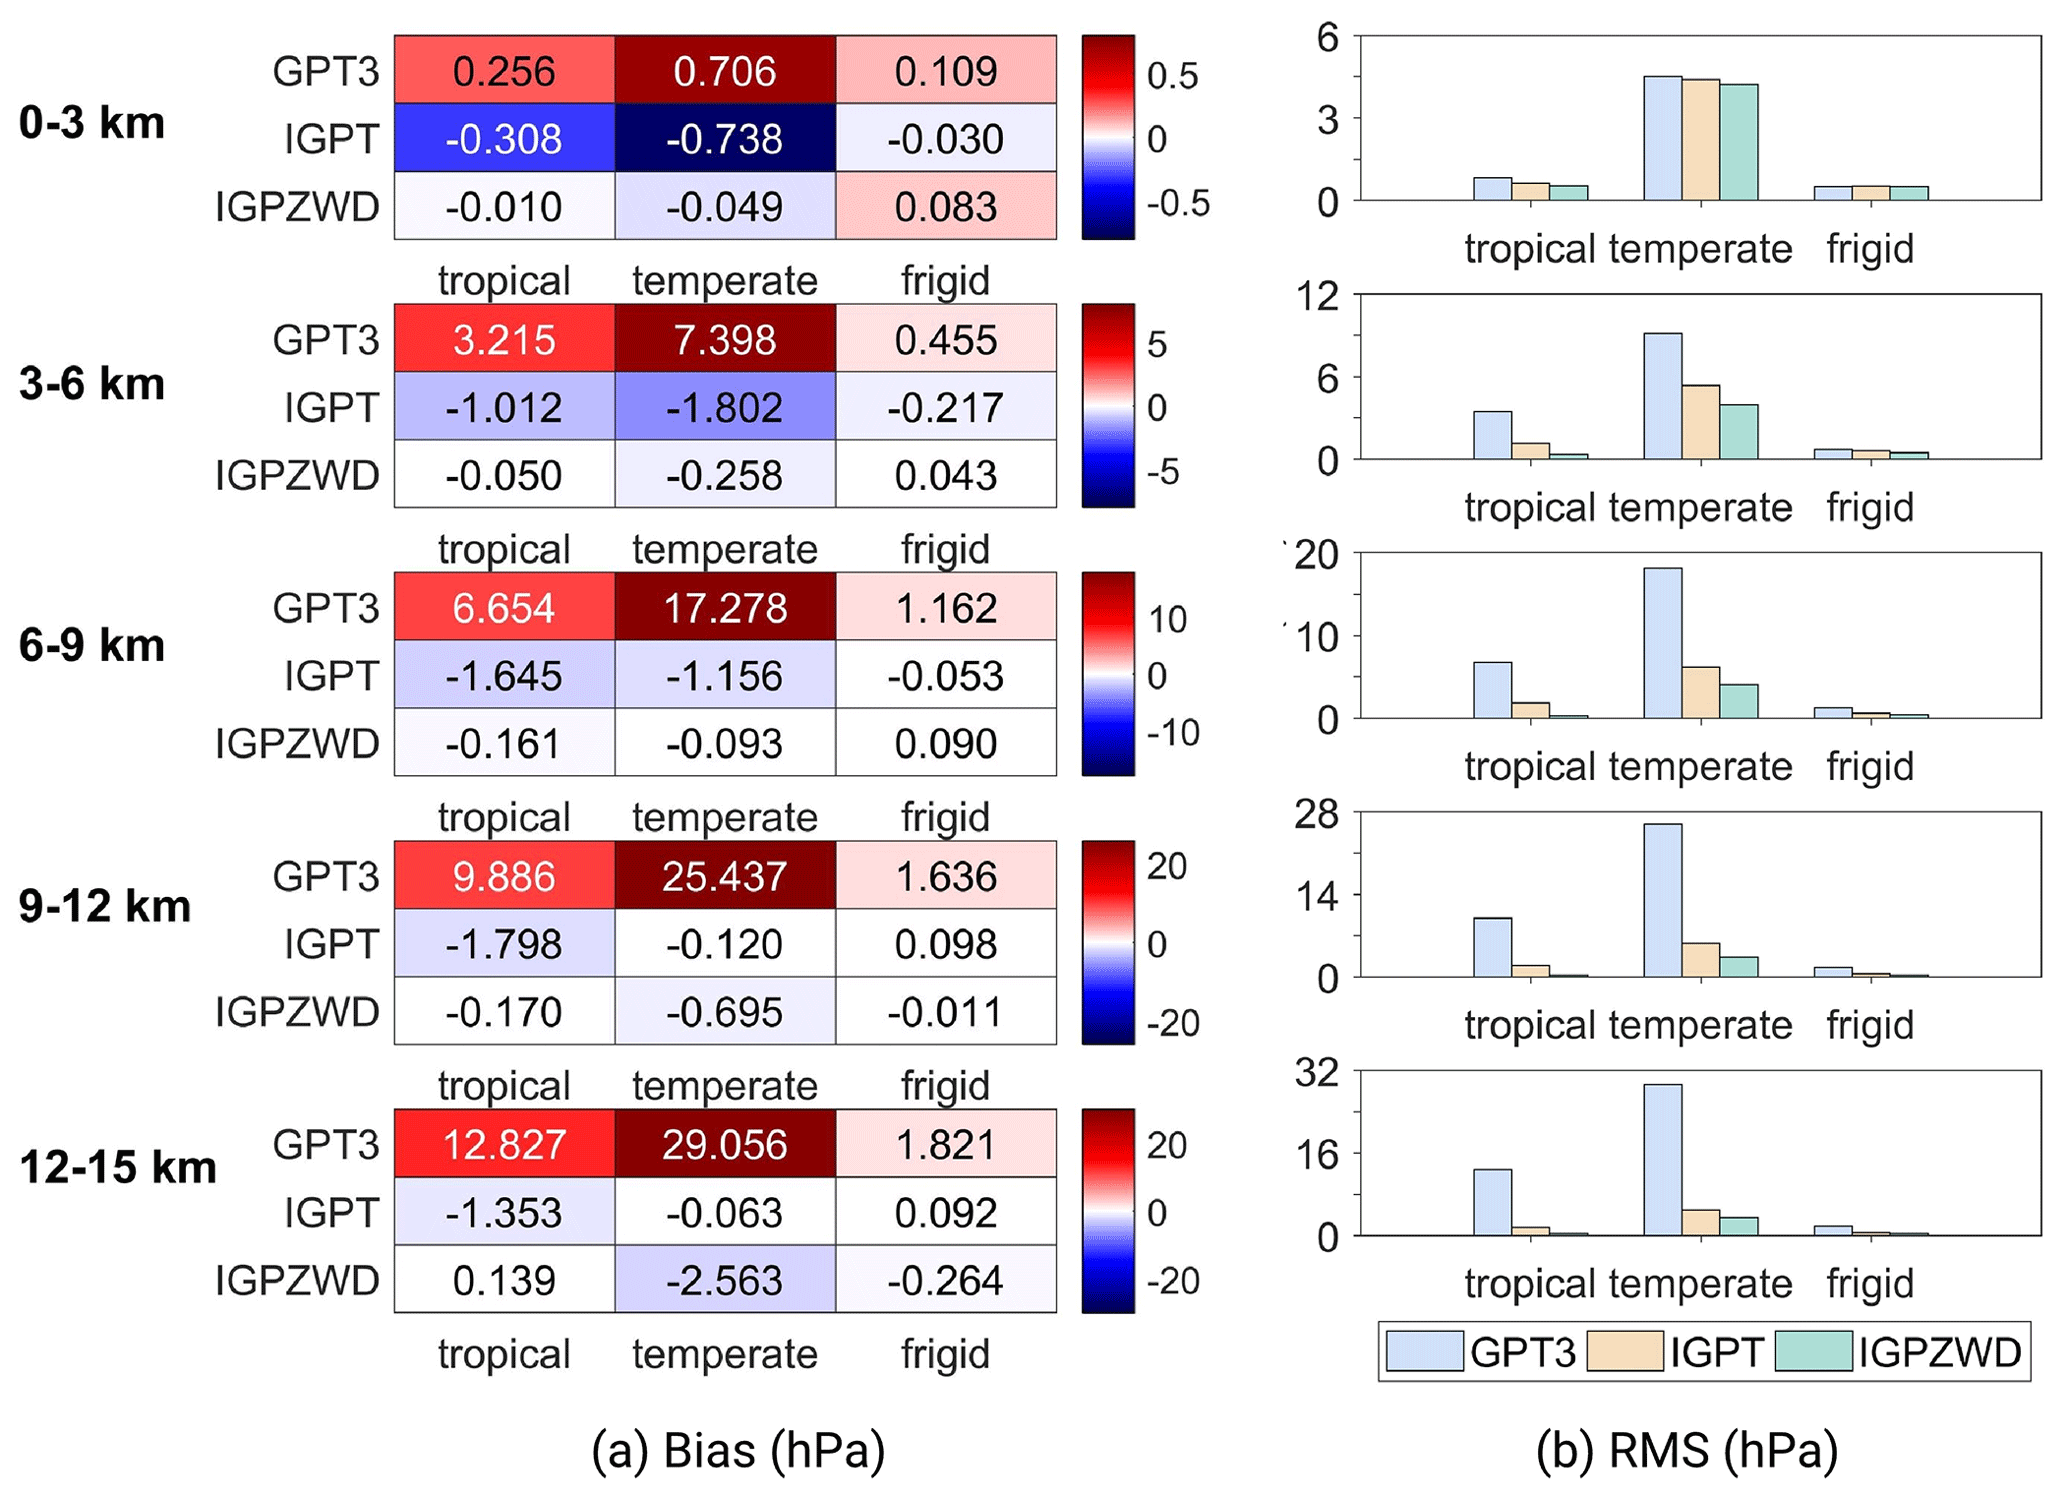
Figure 13Mean bias (a) and rms (b) values (d1–d5) for pressure predicted by the GPT3, IGPT, and IGPZWD models validated using the radiosonde pressure data at five height ranges of the tropical, temperate, and frigid zones.
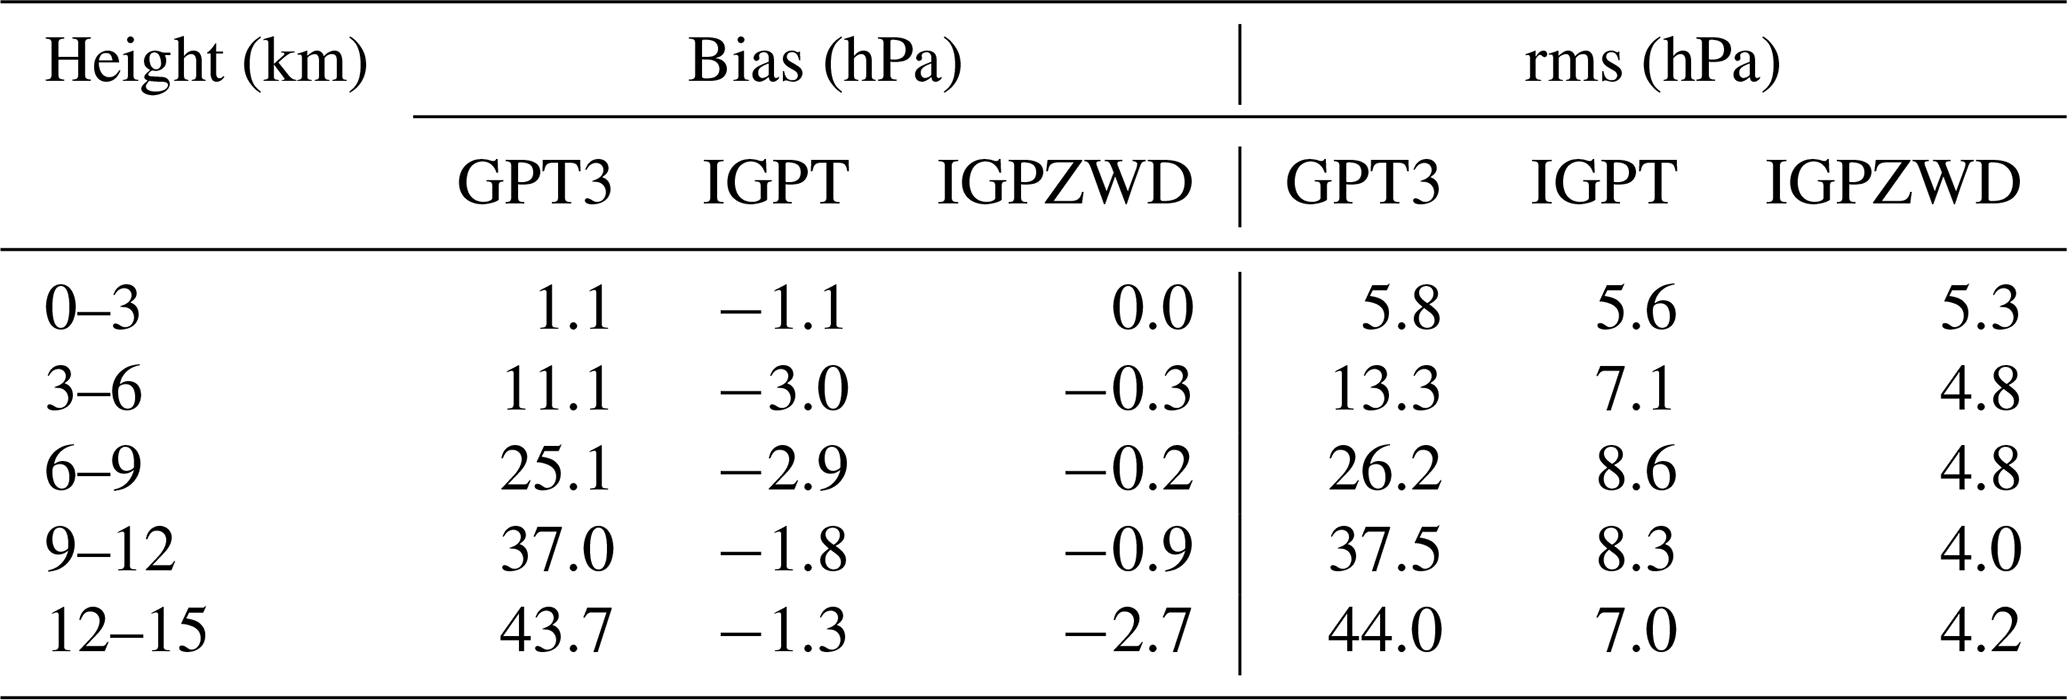
Table 1 summarizes the mean pressure bias and rms values of each height range. The rms values of IGPZWD do not exceed 5.3 hPa at five height ranges, showing a significant accuracy advantage compared to GPT3, with an improvement of up to 90 % for 12–15 km. In contrast to the IGPT model, the IGPZWD model exhibits smaller negative bias values and further improves the performance beyond 3 km with rms improvements of 32.4 %–51.8 %, indicating the feasibility of the proposed vertical correction algorithm. The magnitude of ZWD at a high altitude is small, and thus pressure is the main factor restricting the accuracy of ZTD, according to the rule of uncertainty propagation. It is implied that IGPZWD may provide superior prior tropospheric constraints for the GNSS positioning of high-altitude platforms.
Table 1Mean bias and rms values for pressure predicted by the GPT3, IGPT, and IGPZWD models at five height ranges.
The bias and rms values of pressure predicted by GPT3, IGPT, and IGPZWD models at three temperature zones are presented in Fig. 14. Significant negative bias values of the three models are observed in Southeast Asia below 3 km, which are attributed to the local strong annual and semi-annual amplitudes of ZWD. The GPT3 model exhibits generally positive bias values and large rms values above 3 km in tropical and temperate zones, which again demonstrate that it cannot provide reliable ZWD information in high-altitude areas. Although the GTrop model shows a slight accuracy advantage below 3 km, it performs worse than the IGPZWD model above 3 km. Compared to the GTrop model, the IGPZWD model achieves rms improvements of 14.5 %–27.8 % and 10.6 %–48.5 % beyond 6 km in temperate and tropical zones, respectively. And the order of magnitude of improvement increases with height, confirming the advantages of high-order exponents in simulating ZWD profiles. Previous scholars have used piecewise and high-order functions to characterize the vertical nonlinear variation in ZWD (Hu and Yao, 2019; Zhu et al., 2022). We have also verified the feasibility of this kind of algorithm using 1-year radiosonde data. Moreover, it has been proven that considering the time-varying height-scale factor can further improve the long-term forecasting accuracy.
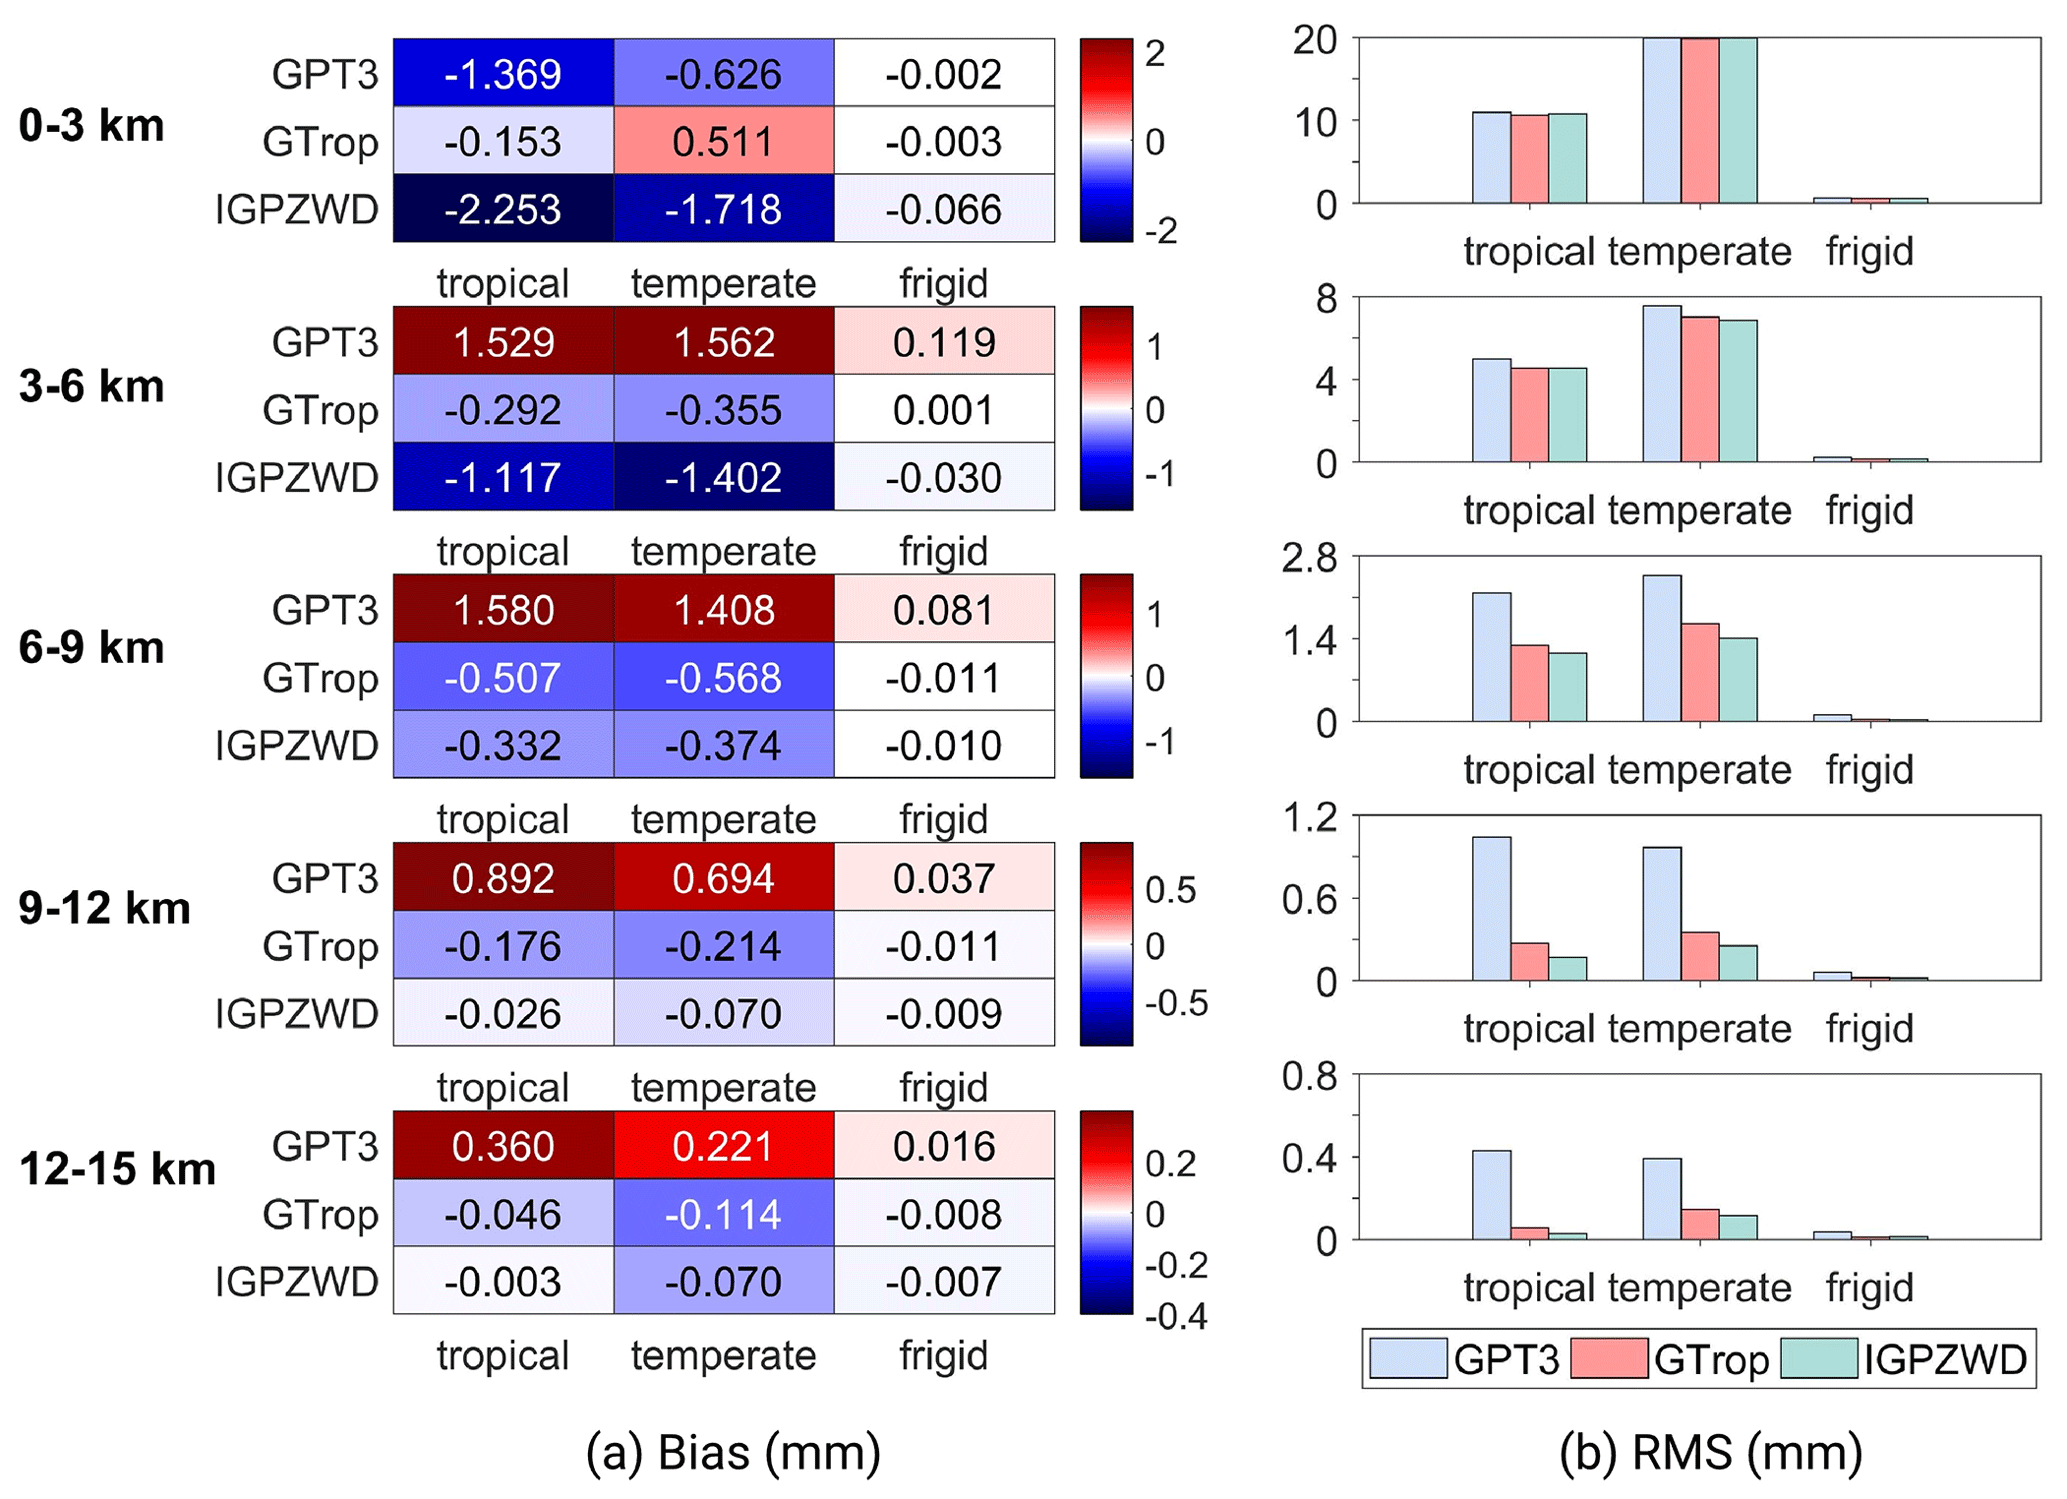
Figure 14Mean bias (a) and rms (b) values (d1–d5) for pressure predicted by the GPT3, IGPT, and IGPZWD models validated using the radiosonde ZWD data at five height ranges of the tropical, temperate, and frigid zones.
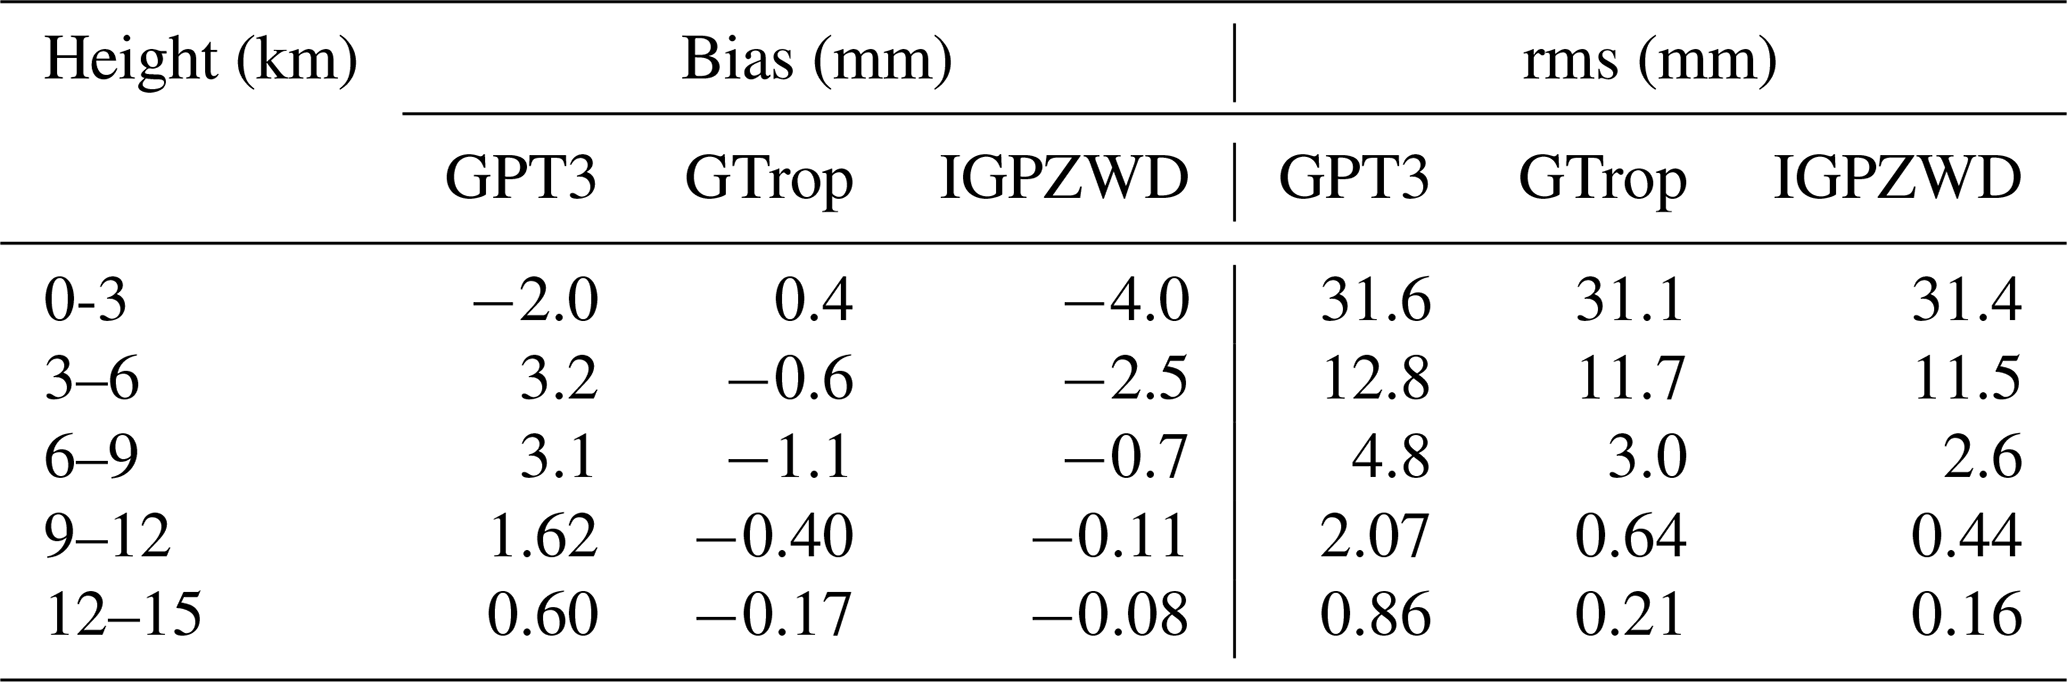
Table 2 summarizes the mean bias and rms values corresponding to each height range. The mean rms values of IGPZWD model are less than 2.6 mm beyond 6 km, showing that the improvement ranges from 45.8 % to 81.4 % for the GPT3 model and from 13.3 % to 31.3 % for the GTrop model, respectively. The above results indicate that the IGPZWD model achieves optimal vertical accuracy and stability on a global scale.
Table 2Mean bias and rms values for ZWD predicted by the GPT3, IGPT, and IGPZWD models at five height ranges.
4.3 Validation with radiosonde-derived ZTD
The vertical correction for pressure in the GPT3 model is realized by the following method:
where T, Q, and Tv are the temperature, specific humidity, and virtual temperature at the reference height, respectively. dMtr, Rg, and Δh denote the molar mass of dry air, universal gas constant, and the corrected height difference, respectively. Equation (19) is essentially based on the assumption of isothermal atmosphere, but the actual atmospheric state does not meet the condition, except for the tropopause. Significant errors will be introduced when using the isothermal model to carry out the pressure extrapolation of a large height difference, resulting in the poor accuracy of ZTD. Therefore, to enhance the comparability of GPT3 ZTD in the high-altitude areas and investigate the potential applicability of the proposed vertical correction method, the pressure extrapolation module of the GPT3 model is replaced by that of IGPZWD model. The calculation method of ZTD for the reconstructed GPT3 (RGPT3) model is as follows:
where PGPT3 is the pressure at the reference height, and and k3 denote the empirical coefficients. es and λ are the water vapor pressure and corresponding decrease factor, respectively. The accuracies of the GPT3, RGPT3, GTrop, and IGPZWD models are evaluated with respect to the radiosonde-derived ZTD below 15 km in 2020. Figure 15 depicts the rms improvement of the RGPT3 ZTD compared to the GPT3 ZTD at each station and five height ranges. The RGPT3 model achieves a comprehensive accuracy improvement with rms improvements over 60 % at most stations. The improvements range from 3.4 % to 88.4 % under 15 km, implying the feasibility and wide applicability of the new pressure vertical correction method.
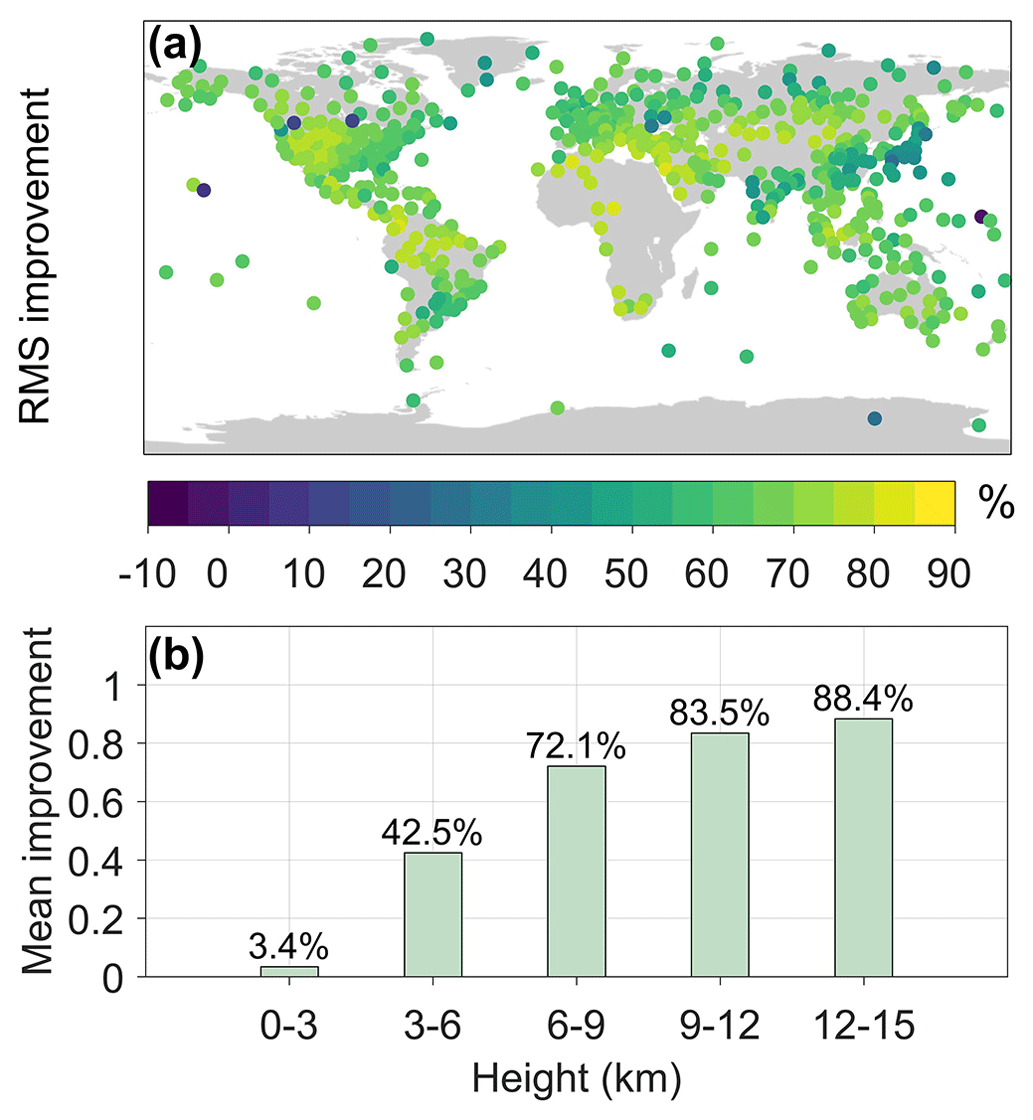
Figure 15The rms improvement of RGPT3 ZTD compared to GPT3 ZTD at 565 stations (a) and the height ranges of 0–3, 3–6, 6–9, 9–12, and 12–15 km (b).
Table 3The maximum, minimum, and mean values of bias and rms for ZTD predicted by the GPT3, RGPT3, GTrop, and IGPZWD models.
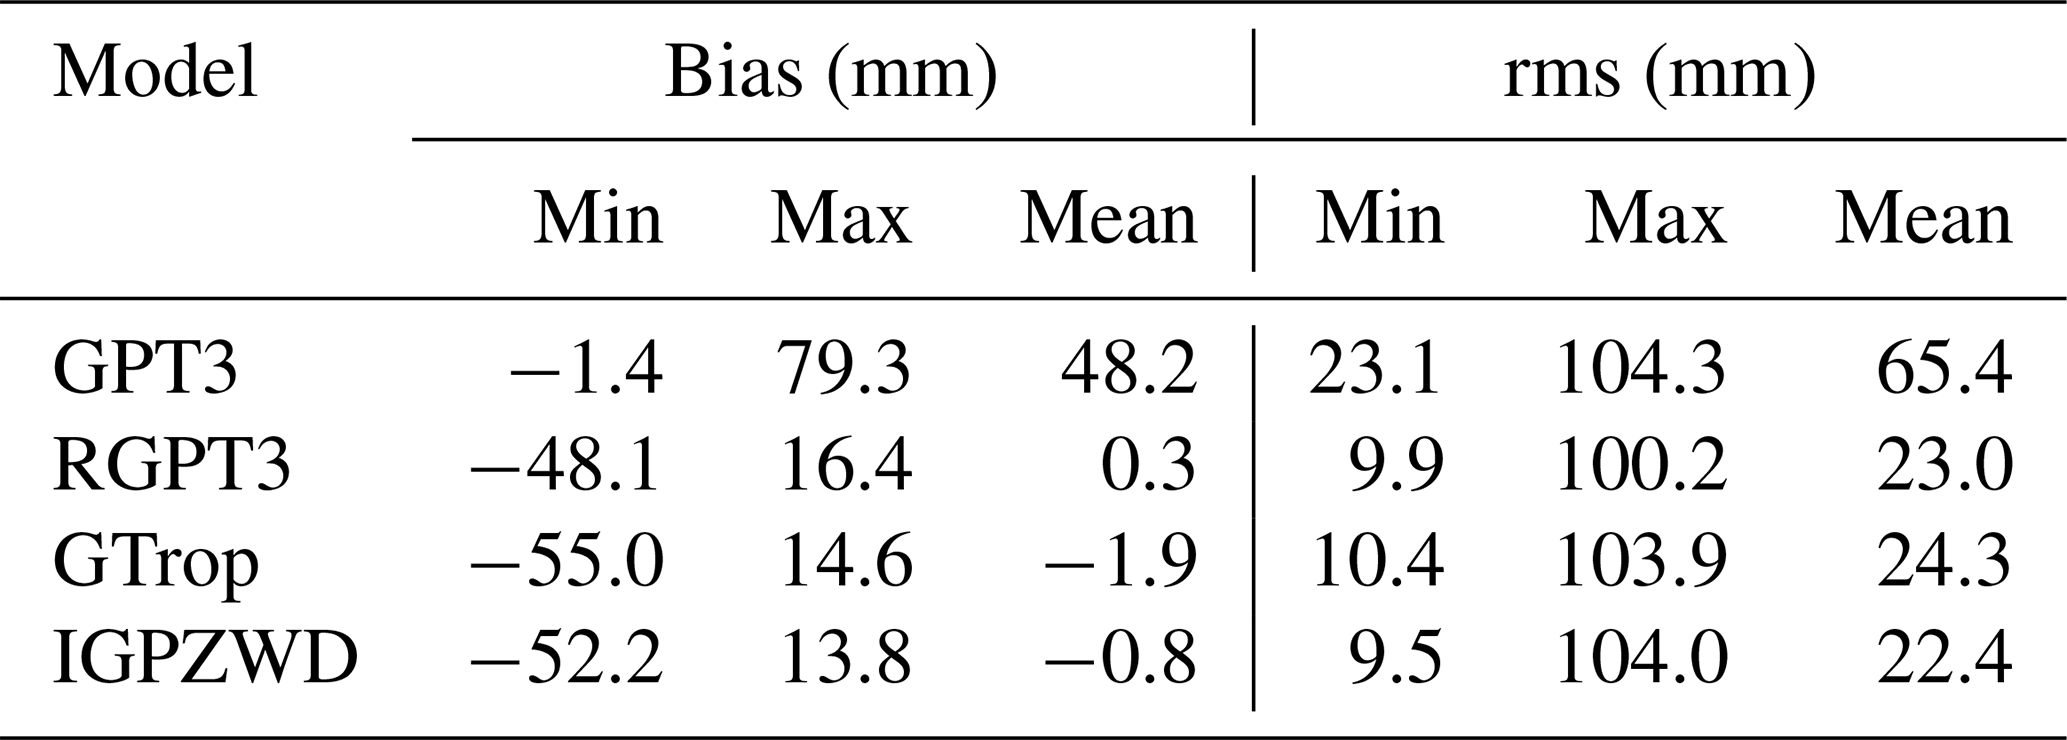
The global accuracies of ZTD predicted by the GPT3, RGPT3, GTrop, and IGPZWD models are shown in Table 3 and Fig. 15. As summarized in Table 3, the mean rms values of IGPZWD is 22.4 mm, which corresponds to 65.7 %, 2.4 %, and 7.8 % improvements against the GPT3, RGPT3, and GTrop models, respectively. As illustrated in Fig. 16, the GPT3 model exhibits significant positive bias values caused by inaccurate pressure estimation, with rms values over 60 mm at most stations in low and middle latitudes. In contrast to the GPT3 model, the RGPT3, GTrop, and IGPZWD models achieve overall unbiased ZTD estimations, and the proportions of rms values below 30 mm for the three models account for 92.4 %, 87.8 %, and 92.9 %, respectively. Moreover, Fig. 17 depicts the mean accuracies of ZTD predicted by the four models at five height ranges. The optimized RGPT3 model outperforms the GTrop model beyond 6 km, further enhancing the vertical applicability of the GPT3 model. Overall, the IGPZWD model exhibits the optimal accuracy at all height ranges, which is attributed to the comprehensive consideration of the periodic terms and the optimized vertical correction algorithm in terms of pressure and ZWD.
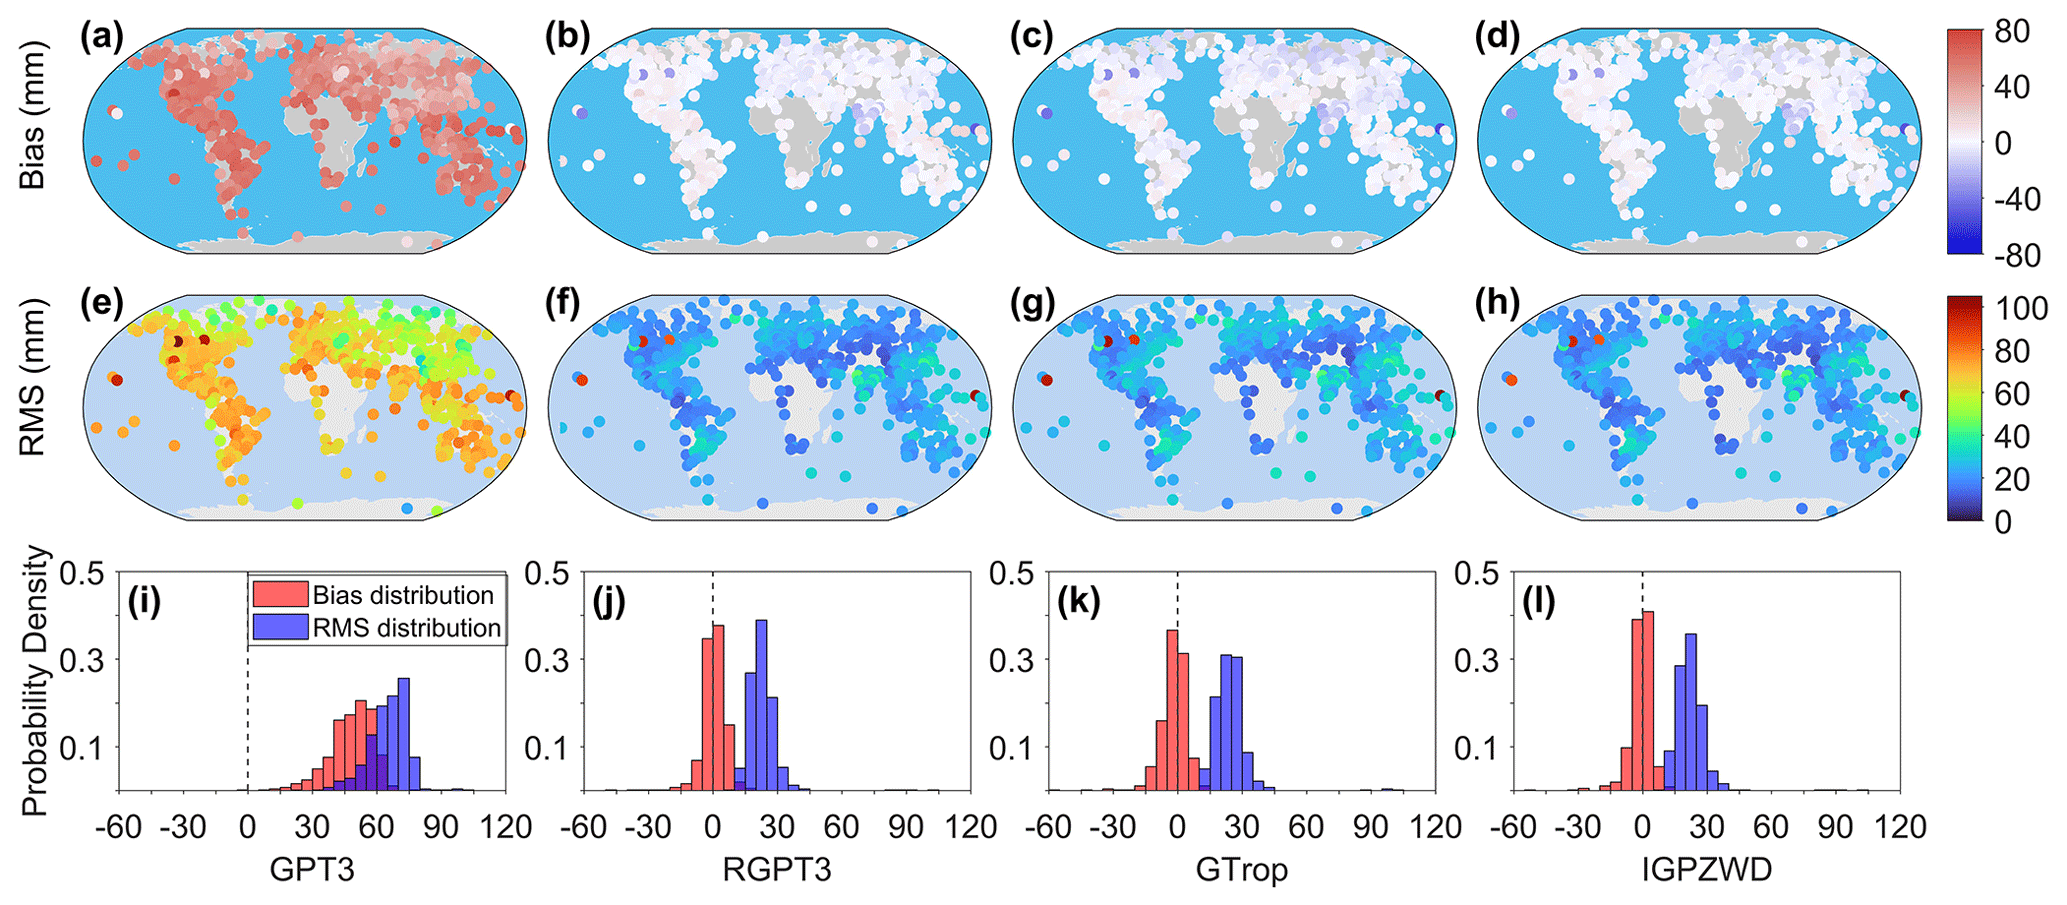
Figure 16Global distribution of bias (a–d), rms (e–h), and the corresponding probability density histograms (i–l) for the ZTD predicted by the GPT3, RGPT3, GTrop, and IGPZWD models with respect to the radiosonde-derived ZTD.
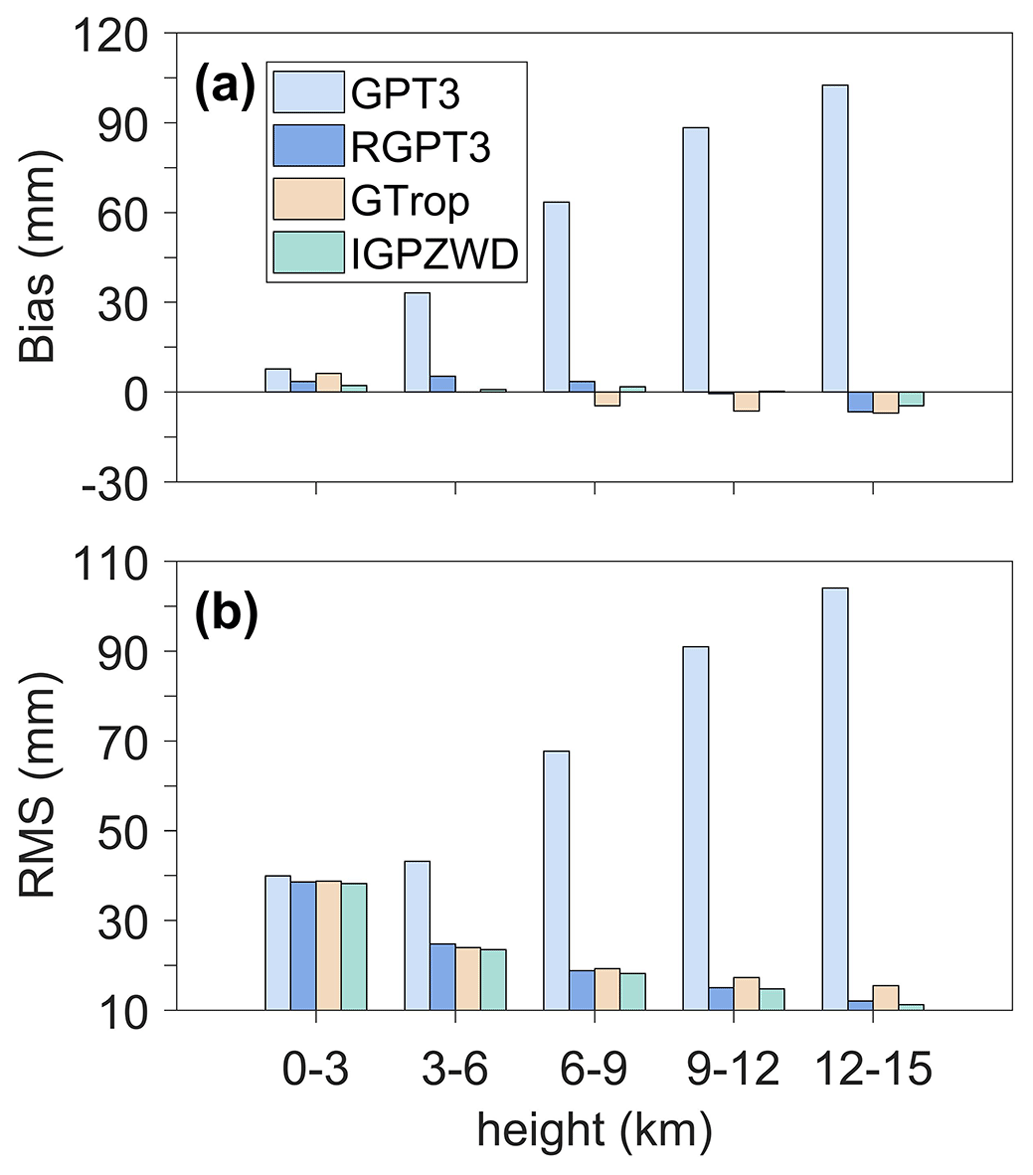
Figure 17Overall bias (a) and rms (b) values for ZTD predicted by the GPT3, RGPT3, IGPT, and IGPZWD models at the height ranges of 0–3, 3–6, 6–9, 9–12, and 12–15 km.
To sum up, the proposed IGPZWD model can provide high-quality tropospheric parameter prediction below 15 km on a global scale. The IGPZWD model will be of great significance for the tropospheric augmentation in real-time GNSS positioning, and it has broad application prospects in real-time water vapor sounding and extreme weather forecasting. Despite the complexity of the inversion process for tropospheric parameters, the overall performance of the IGPZWD model is encouraging. In the future, the model coefficients will be further simplified to balance the computation efficiency and accuracy.
Accurate atmospheric pressure and ZWD information are crucial for real-time GNSS precise positioning and meteorological applications. With 5-year ERA5 hourly data, we reveal the spatiotemporal characteristics of pressure and ZWD and propose an empirical global pressure and ZWD grid model with broader operating space, called IGPZWD, which incorporates the diurnal and semi-diurnal harmonics. The optimal exponential function with three orders is adopted as the core vertical fitting scheme, and the seasonal variations in height-scale factors are taken into consideration to further optimize the vertical accuracy. Consequently, the IGPZWD model can quickly provide accurate pressure, ZWD, ZHD, and ZTD estimates for any selected time and location over the globe.
The performance of IGPZWD is evaluated with the ERA5 and radiosonde profile data in 2020. Taking the ERA5 pressure profiles as reference, the IGPZWD model outperforms the GPT3 and IGPT models, achieving overall unbiased pressure prediction in the tropical regions and significant rms improvement in the Antarctic, Tibetan Plateau, and Andes mountains for both the surface and the upper air. Regarding the ZWD, the IGPZWD model exhibits greater consistency with ERA5 ZWD than the GPT3 and GTrop models at higher levels, achieving optimal accuracy over the globe and overall unbiased ZWD prediction in the Antarctic. The validation based on radiosonde profile data indicates that the pressure predicted by the IGPZWD model shows better performance than that of GPT3 and IGPT models. The pressure accuracy of the IGPZWD model is improved by 32.4 %–51.8 % compared to that of IGPT model beyond 3 km. Above 6 km, the rms of ZWD predicted by the IGPZWD model is improved by 45.8 %–81.4 % and 13.3 %–31.3 %, which is in contrast to that of the GPT3 and GTrop models, respectively. Furthermore, the mean rms value of ZTD predicted by IGPZWD is 22.4 mm, which achieves 65.7 %, 2.4 %, and 7.8 % improvements against that of GPT3, RGPT3, and GTrop models, respectively.
In summary, the proposed optimized vertical correction algorithm weakens the cumulative error caused by large correction height difference, which effectively improves the accuracy and stability of pressure, ZWD, and ZTD in high-altitude areas.
To reveal the applicability of the three models at different height ranges below 15 km, the accuracies of model-predicted pressure and ZWD profiles are statistically validated using radiosonde profile data with a vertical sampling interval of 3 km. The bias and rms values of pressure are presented in Figs. A1 and A2, respectively, while those of ZWD are shown in Figs. A3 and A4. The following figures can effectively demonstrate the global and regional accuracy advantage of IGPZWD model in different height ranges, providing indicators and references for users in different regions.
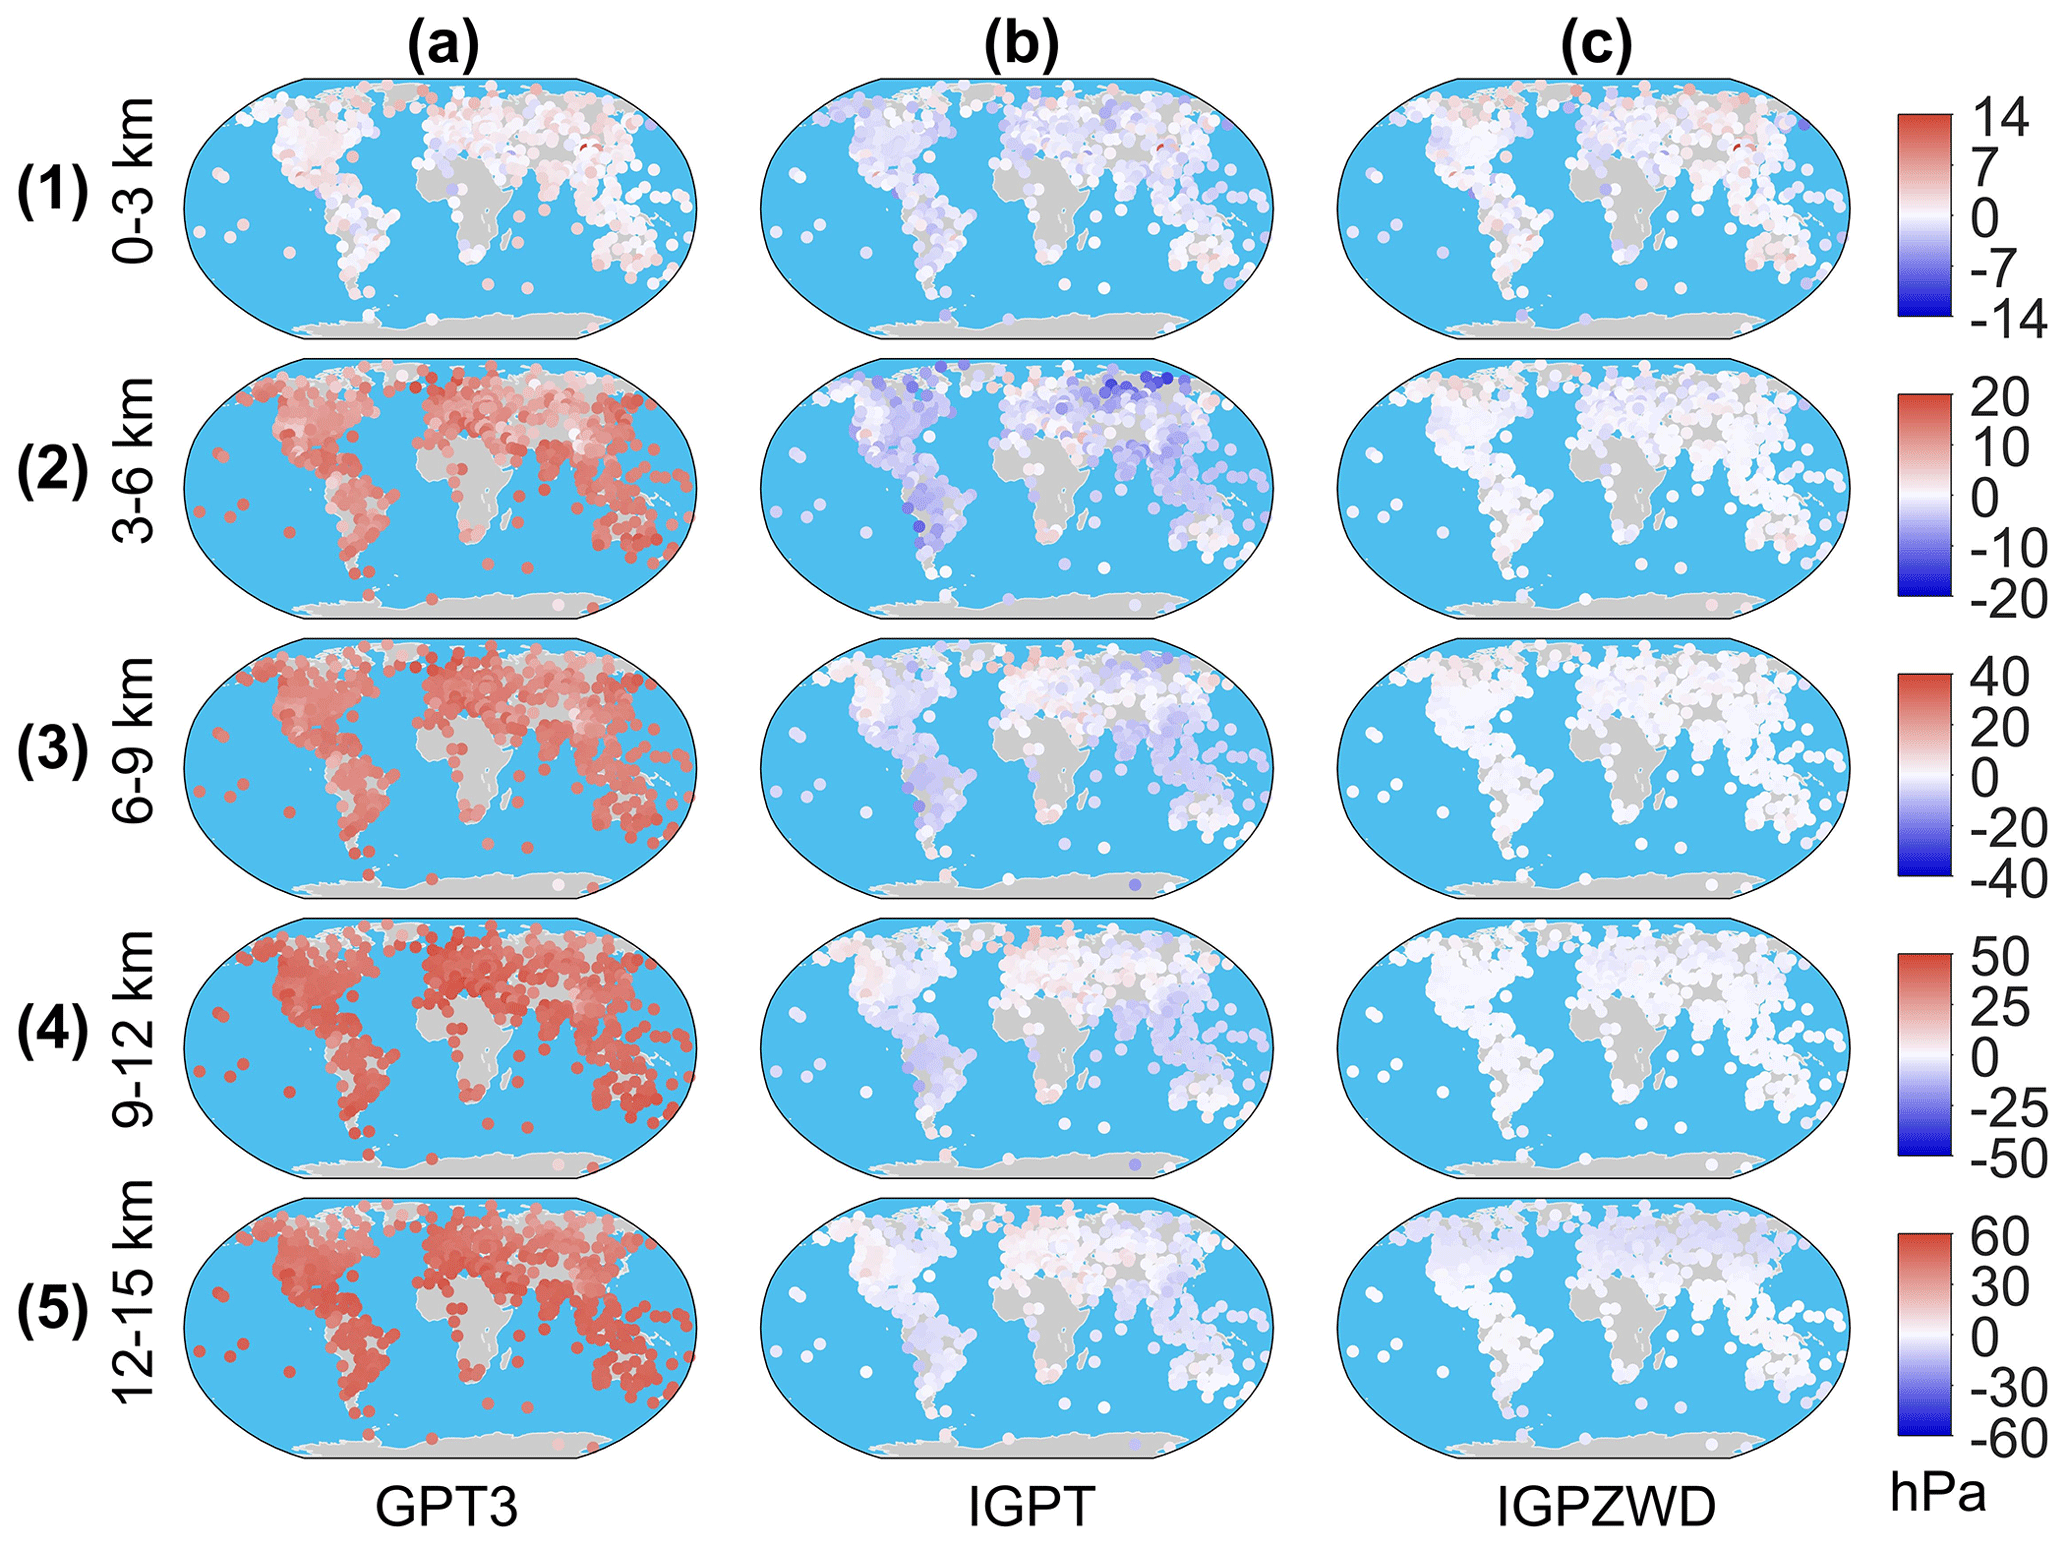
Figure A1Distribution of bias for pressure predicted by the GPT3, IGPT, and IGPZWD models validated using the radiosonde pressure data at the height ranges of 0–3 (a1–c1), 3–6 (a2–c2), 6–9 (a3–c3), 9–12 (a4–c4), and 12–15 (a5–c5) km in 2020.
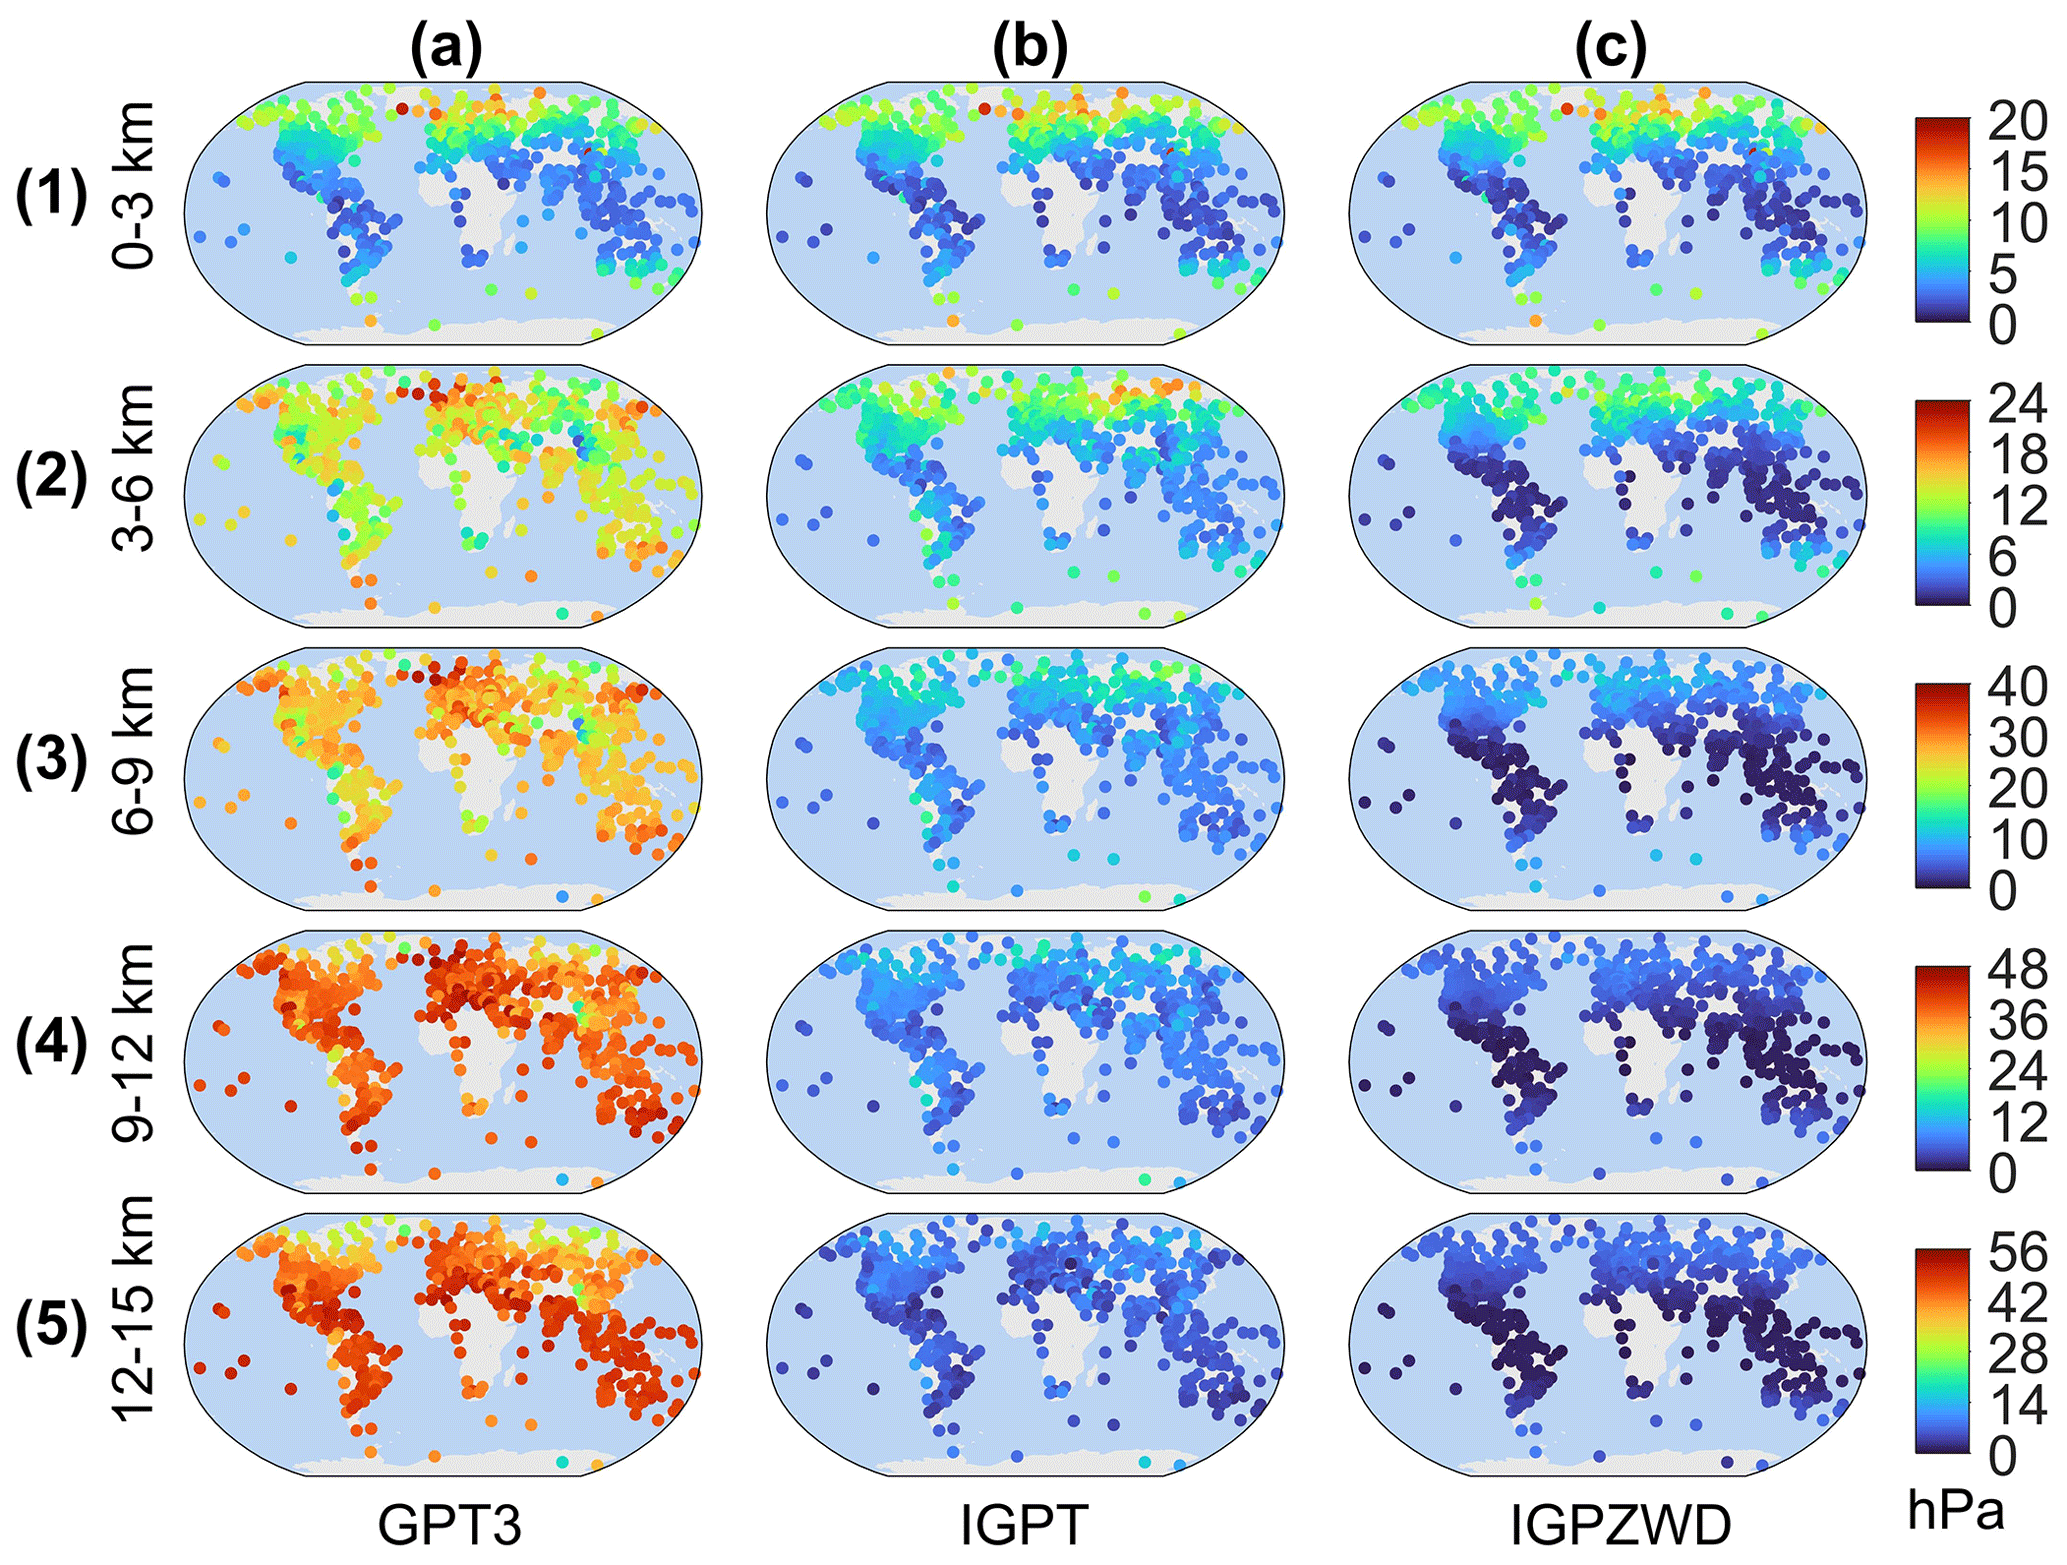
Figure A2Distribution of rms for pressure predicted by the GPT3, IGPT, and IGPZWD models validated using the radiosonde pressure data at the height ranges of 0–3 (a1–c1), 3–6 (a2–c2), 6–9 (a3–c3), 9–12 (a4–c4), and 12–15 (a5–c5) km in 2020.
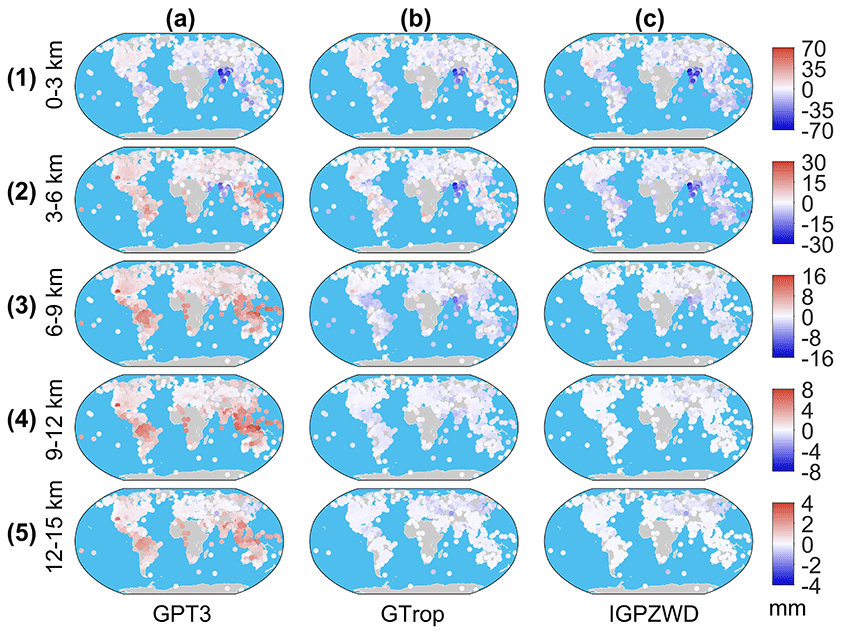
Figure A3Distribution of bias for ZWD predicted by the GPT3, GTrop, and IGPZWD models validated using the radiosonde-derived ZWD at the height ranges of 0–3 (a1–c1), 3–6 (a2–c2), 6–9 (a3–c3), 9–12 (a4–c4), and 12–15 (a5–c5) km in 2020.
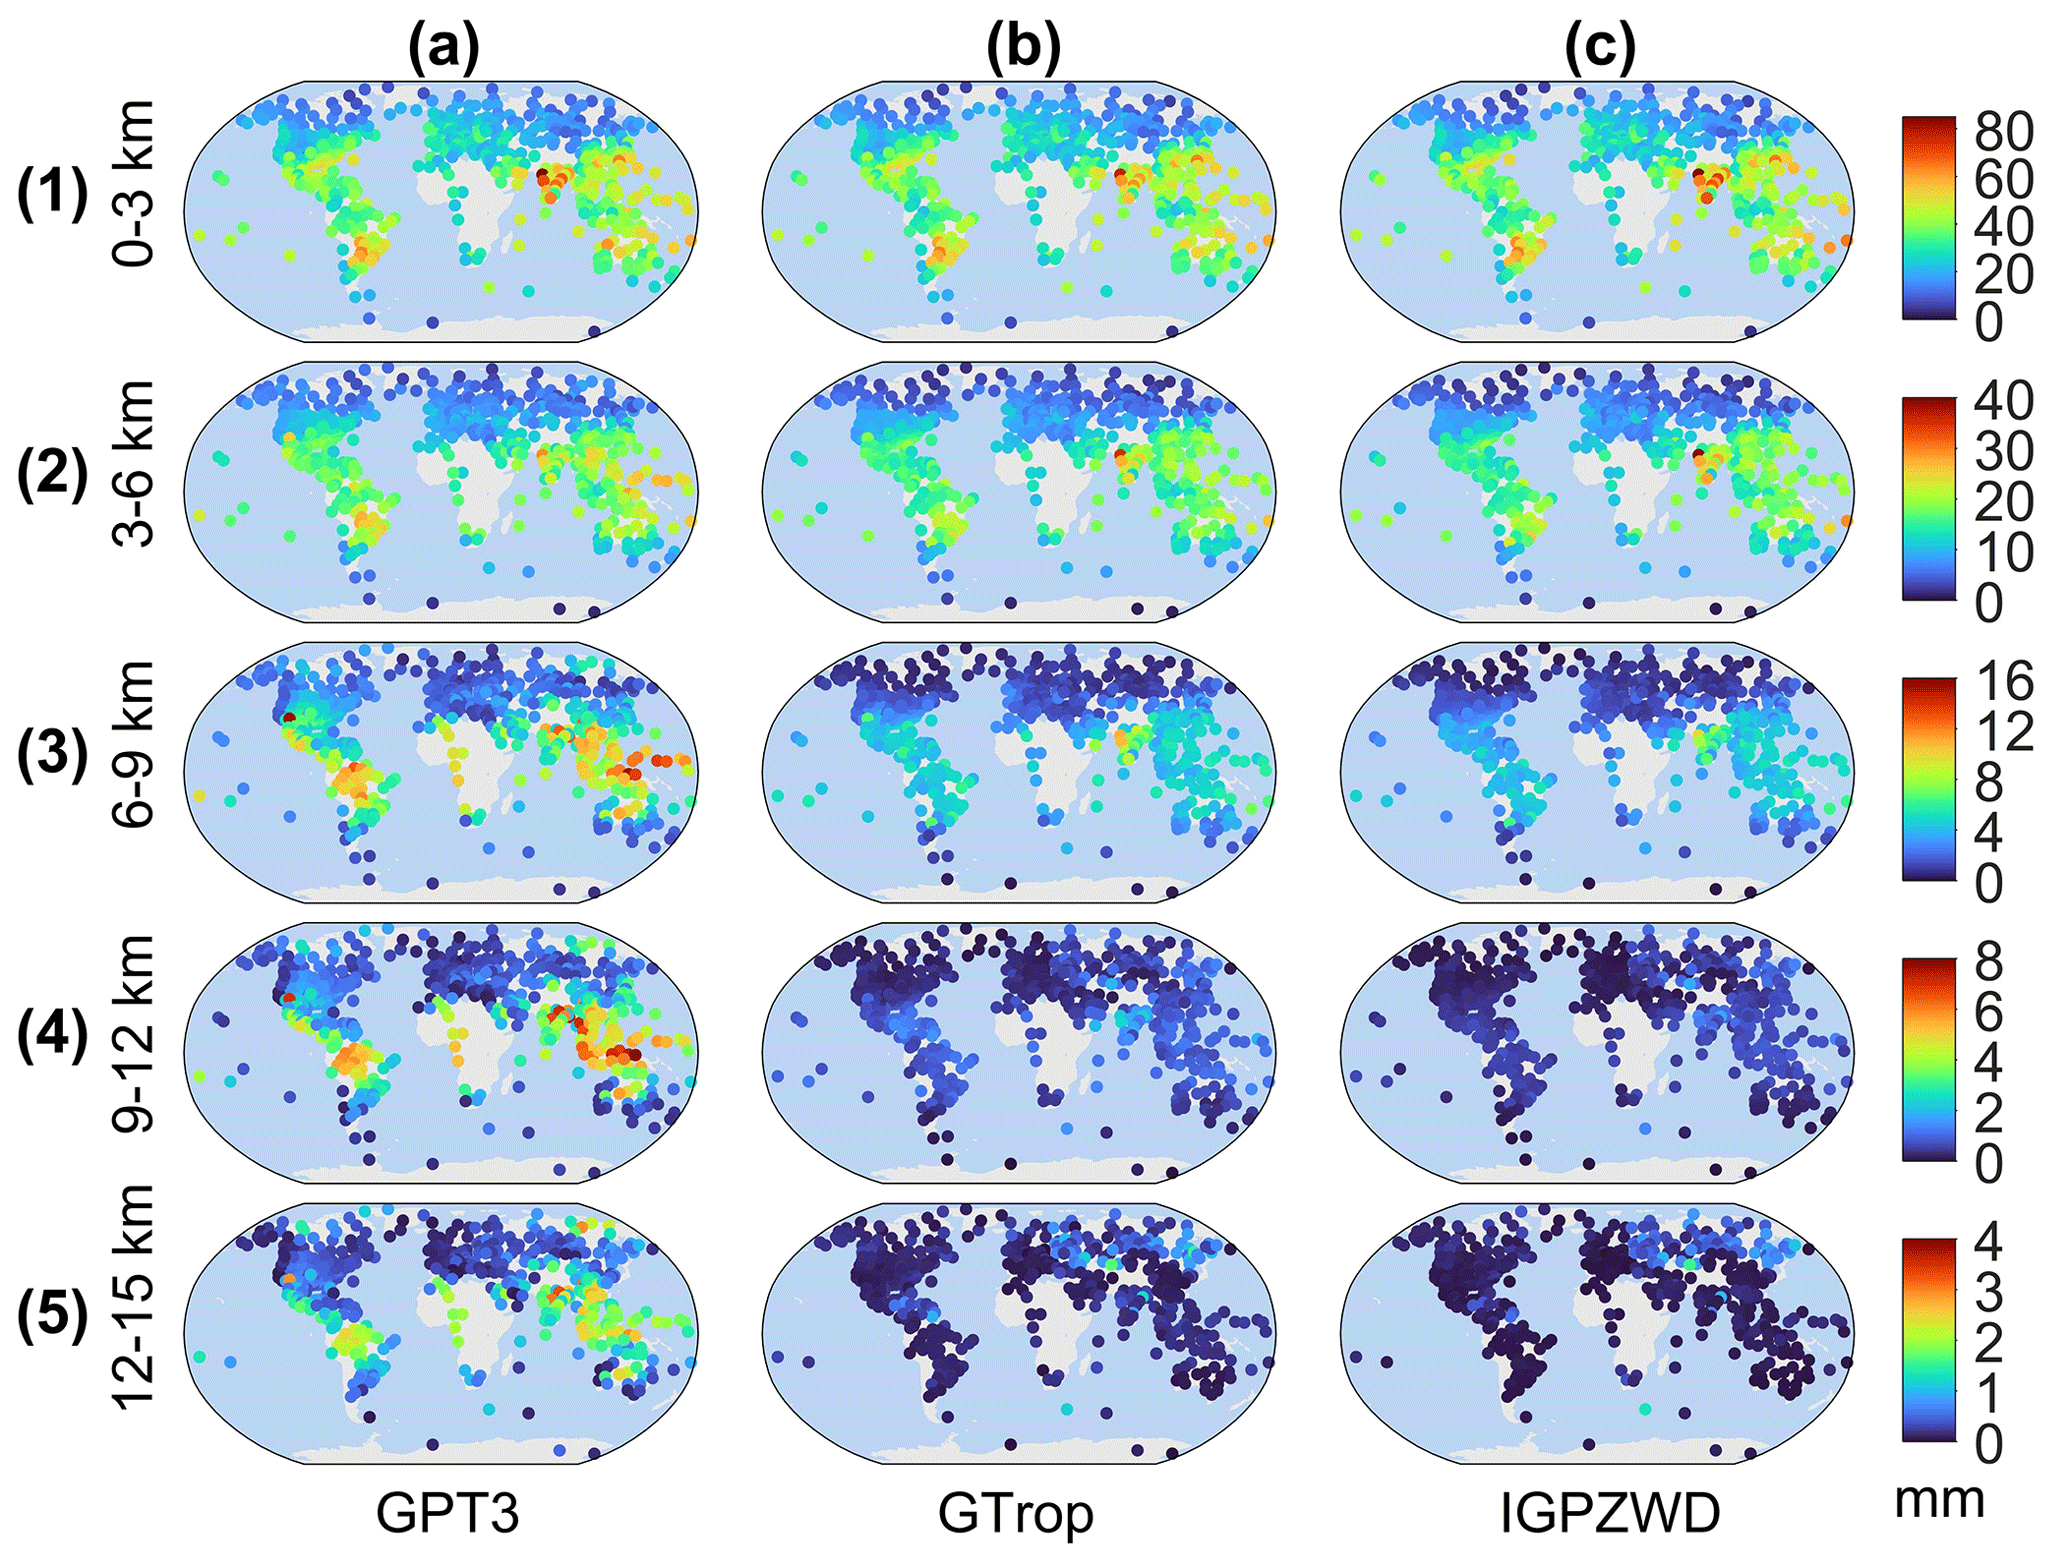
Figure A4Distribution of bias for ZWD predicted by the GPT3, GTrop, and IGPZWD models validated using the radiosonde-derived ZWD at the height ranges of 0–3 (a1–c1), 3–6 (a2–c2), 6–9 (a3–c3), 9–12 (a4–c4), and 12–15 (a5–c5) km in 2020.
The open-source codes and coefficient matrix files of the IGPZWD model are available at https://github.com/LNTUgx/GNSS/tree/main/IGPZWD_model (last access: 15 July 2024) or https://doi.org/10.5281/zenodo.10574193 (Jiang et al., 2024). ERA5 reanalysis products can be obtained from https://doi.org/10.24381/cds.bd0915c6 (Hersbach et al., 2023a) and https://doi.org/10.24381/cds.adbb2d47 (Hersbach et al., 2023b). Radiosonde can be downloaded from https://doi.org/10.7289/V5X63K0Q (Durre et al., 2016).
CJ designed the experimental processes and core algorithm, reviewed and optimized the paper, and provided funding. XG conducted the code implementation for data processing and visualization and wrote the original draft. HZ adjusted the structure of the paper and provided funding. SW verified the feasibility of the algorithm. SL provided scripts for obtaining basic data. SC and GL conducted the correction and verification of basic data.
The contact author has declared that none of the authors has any competing interests.
Publisher’s note: Copernicus Publications remains neutral with regard to jurisdictional claims made in the text, published maps, institutional affiliations, or any other geographical representation in this paper. While Copernicus Publications makes every effort to include appropriate place names, the final responsibility lies with the authors.
The authors would like to thank the three international research teams for providing open-source codes in terms of GPT3, IGPT, and GTrop. The Integrated Global Radiosonde Archive and Copernicus Climate Change Service are appreciated for providing radiosonde data and ERA5 reanalysis products. We are also grateful to the supercomputing system at the Supercomputing Center, Shandong University, Weihai.
This research has been funded by the National Natural Science Foundation of China (grant no. 42030109); the Scientific Study Project for Institutes of Higher Learning, Ministry of Education, Liaoning province (grant no. LJKMZ20220673); and the project supported by the State Key Laboratory of Geodesy and Earth Dynamics, Innovation Academy for Precision Measurement Science and Technology (grant no. SKLGED2023-3-2).
This paper was edited by Le Yu and reviewed by four anonymous referees.
Askne, J. and Nordius, H.: Estimation of tropospheric delay for microwaves from surface weather data, Radio Sci., 22, 379–386, https://doi.org/10.1029/RS022i003p00379, 1987.
Benjamin, S. G. and Miller, P. A.: An Alternative Sea Level Pressure Reduction and a Statistical Comparison of Geostrophic Wind Estimates with Observed Surface Winds, Mon. Weather Rev., 118, 2099–2116, https://doi.org/10.1175/1520-0493(1990)118<2099:AASLPR>2.0.CO;2, 1990.
Berg, H.: Allgemeine meteorologie, Dümmler's Verlag, Bonn, ISBN 978-3-642-61758-4, 1948.
Boehm, J., Heinkelmann, R., and Schuh, H.: Short Note: A global model of pressure and temperature for geodetic applications, J. Geod., 81, 679–683, https://doi.org/10.1007/s00190-007-0135-3, 2007.
Böhm, J., Möller, G., Schindelegger, M., Pain, G., and Weber, R.: Development of an improved empirical model for slant delays in the troposphere (GPT2w), GPS Solut., 19, 433–441, https://doi.org/10.1007/s10291-014-0403-7, 2015.
Durre, I., Yin, X., Vose, R. S., Applequist, S., Arnfield, J., Korzeniewski, B., and Hundermark, B.: Integrated Global Radiosonde Archive (IGRA), Version 2, NOAA National Centers for Environmental Information [data set], https://doi.org/10.7289/V5X63K0Q, 2016.
Fan, H., Li, S., Sun, Z., Xiao, G., Li, X., and Liu, X.: Analysis of systematic biases in tropospheric hydrostatic delay models and construction of a correction model, Geosci. Model Dev., 16, 1345–1358, https://doi.org/10.5194/gmd-16-1345-2023, 2023.
Fernandes, M. J., Lázaro, C., and Vieira, T.: On the role of the troposphere in satellite altimetry, Remote Sens. Environ., 252, 112149, https://doi.org/10.1016/j.rse.2020.112149, 2021.
Hadas, T., Teferle, F. N., Kazmierski, K, Hordyniec, P., and Bosy, J.: Optimum stochastic modeling for GNSS tropospheric delay estimation in real-time, GPS Solut., 21, 1069–1081, https://doi.org/10.1007/s10291-016-0595-0, 2017.
Hersbach, H., Bell, B., Berrisford, P., Hirahara, S., Horányi, A., Muñoz-Sabater, J., Nicolas, J., Peubey, C., Radu, R., Schepers, D., Simmons, A., Soci, C., Abdalla, S., Abellan, X., Balsamo, G., Bechtold, P., Biavati, G., Bidlot, J., Bonavita, M., Chiara, G. D., Dahlgren, P., Dee, D., Diamantakis, M., Dragani, R., Flemming, J., Forbes, R., Fuentes, M., Geer, A., Haimberger, L., Healy, S., Hogan, R. J., Hólm, E., Janisková, M., Keeley, S., Laloyaux, P., Lopez, P., Lupu, C., Radnoti, G., Rosnay, P., Rozum, I., Vamborg, F., Villaume, S., and Thépaut, J.: The ERA5 global reanalysis, Q. J. Roy. Meteorol. Soc., 146, 1999–2049, https://doi.org/10.1002/qj.3803, 2020.
Hersbach, H., Bell, B., Berrisford, P., Biavati, G., Horányi, A., Muñoz Sabater, J., Nicolas, J., Peubey, C., Radu, R., Rozum, I., Schepers, D., Simmons, A., Soci, C., Dee, D., and Thépaut, J.-N.: ERA5 hourly data on pressure levels from 1940 to present, Copernicus Climate Change Service (C3S) Climate Data Store (CDS) [data set], https://doi.org/10.24381/cds.bd0915c6, 2023a.
Hersbach, H., Bell, B., Berrisford, P., Biavati, G., Horányi, A., Muñoz Sabater, J., Nicolas, J., Peubey, C., Radu, R., Rozum, I., Schepers, D., Simmons, A., Soci, C., Dee, D., and Thépaut, J.-N.: ERA5 hourly data on single levels from 1940 to present, Copernicus Climate Change Service (C3S) Climate Data Store (CDS) [data set], https://doi.org/10.24381/cds.adbb2d47, 2023b.
Hofmeister, A. and Böhm, J.: Application of ray-traced tropospheric slant delays to geodetic VLBI analysis, J. Geod., 91, 945–964, https://doi.org/10.1007/s00190-017-1000-7, 2017.
Hu, Y. and Yao, Y.: A new method for vertical stratification of zenith tropospheric delay, Adv. Space Res., 63, 2857–2866, https://doi.org/10.1016/j.asr.2018.10.035, 2019.
Huang, L., Zhu, G., Liu, L., Chen, H., and Jiang, W.: A global grid model for the correction of the vertical zenith total delay based on a sliding window algorithm, GPS Solut., 25, 98, https://doi.org/10.1007/s10291-021-01138-7, 2021a.
Huang, L., Zhu, G., Peng, H., Chen, H., Liu, L., and Jiang, W.: A global grid model for the vertical correction of zenith wet delay based on the sliding window algorithm, Acta Geodaetica et Cartographica Sinica, 50, 685–694, https://doi.org/10.11947/j.AGCS.2021.20200515, 2021b.
Huang, L., Zhu, G., Peng, H., Liu, L., Ren, C., and Jiang, W.: An improved global grid model for calibrating zenith tropospheric delay for GNSS applications, GPS Solut., 27, 17, https://doi.org/10.1007/s10291-022-01354-9, 2023.
Ingleby, B., Pauley, P., Kats, A., Ator, J., Keyser, D., Doerenbecher, A., Fucile, E., Hasegawa, J., Toyoda, E., and Kleinert, T.: Progress toward high-resolution, real-time radiosonde reports, B. Am. Meteorol. Soc., 97, 2149–2161, https://doi.org/10.1175/BAMS-D-15-00169.1, 2016.
Jiang, C., Gao, X., Wang, S., Zhu, H., Xu, A., An, Q., Zhu, M., and Liu, G.: Comparison of ZTD derived from CARRA, ERA5 and ERA5-Land over the Greenland based on GNSS, Adv. Space Res., 72, 4692–4706, https://doi.org/10.1016/j.asr.2023.09.002, 2023.
Jiang, C., Gao, X., Zhu, H., Wang, S., Liu, S., Chen, S., and Liu, G.: IGPZWD, Zenodo [code], https://doi.org/10.5281/zenodo.10574193, 2024.
Kleijer, F.: Troposphere modeling and filtering for precise GPS leveling, http://resolver.tudelft.nl/uuid:ea1f0cf0-4e48-421b-b7ae-4ae3e36d1880 (last access: 15 September 2023), 2004.
Kouba, J.: Implementation and testing of the gridded Vienna Mapping Function 1 (VMF1), J. Geod., 82, 193–205, https://doi.org/10.1007/s00190-007-0170-0, 2008.
Lagler, K., Schindelegger, M., Bohm, J., Krasna, H., and Nilsson, T.: GPT2: empirical slant delay model for radio space geodetic techniques, Geophys. Res. Lett., 40, 1069–1073, https://doi.org/10.1002/grl.50288, 2013.
Landskron, D. and Böhm, J.: VMF3/GPT3: refined discrete and empirical troposphere mapping functions, J. Geod., 92, 349–360, https://doi.org/10.1007/s00190-017-1066-2, 2018.
Leandro, R. F., Santos, M., and Langley, R. B.: UNB Neutral Atmosphere Models: Development and Performance, Proceedings of the 2006 National Technical Meeting of The Institute of Navigation, Monterey, CA, 564–573, https://www.ion.org/publications/abstract.cfm?articleID=6562 (last access: 2 October 2023), 2006.
Leandro, R. F., Langley, R. B., and Santos, M. C.: UNB3m_pack: a neutral atmosphere delay package for radiometric space techniques, GPS Solut., 12, 65–70, https://doi.org/10.1007/s10291-007-0077-5, 2008.
Li, H., Zhu, G., Kang, Q., Huang, L., Wang, H.: A global zenith tropospheric delay model with ERA5 and GNSS-based ZTD difference correction, GPS Solut., 27, 154, https://doi.org/10.1007/s10291-023-01503-8, 2023.
Li, J., Zhang, Q., Liu, L., Yao, Y., Huang, L., Chen, F., Zhou, L and Zhang B.: A refined zenith tropospheric delay model for Mainland China based on the global pressure and temperature 3 (GPT3) model and random forest, GPS Solut., 27, 172, https://doi.org/10.1007/s10291-023-01513-6, 2023.
Li, L., Zhang, K., Wu, S., Li, H., Wang, X., Hu, A., Li, W., Fu, E., Zhang, M and Shen, Z.: An Improved Method for Rainfall Forecast Based on GNSS-PWV, Remote Sens, 14, 4280, https://doi.org/10.3390/rs14174280, 2022.
Li, T., Wang, L., Chen, R. Fu, W., Xu, B., Jiang, P., Liu, J., Zhou, H., and Han, Y.: Refining the empirical global pressure and temperature model with the ERA5 reanalysis and radiosonde data, J. Geod., 95, 31, https://doi.org/10.1007/s00190-021-01478-9, 2021.
Li, W., Yuan, Y., Ou, J., Chai, Y., Li, Z., Liou, Y., and Wang, N.: New versions of the BDS/GNSS zenith tropospheric delay model IGGtrop, J. Geod., 89, 73–80, https://doi.org/10.1007/s00190-014-0761-5, 2015.
Lu, C., Zheng, Y., Wu, Z., Zhang, Y., Wang, Q., Wang, Z., Liu, Y., and Zhong, Y.: TropNet: a deep spatiotemporal neural network for tropospheric delay modeling and forecasting, J. Geod., 97, 34, https://doi.org/10.1007/s00190-023-01722-4, 2023.
Mao, J., Wang, Q., Liang, Y., and Cui, T.: A new simplified zenith tropospheric delay model for real-time GNSS applications, GPS Solut., 25, 43, https://doi.org/10.1007/s10291-021-01092-4, 2021.
Pavlis, N. K., Holmes, S. A., Kenyon, S. C., and Factor, J. K.: The development and evaluation of the Earth Gravitational Model 2008 (EGM2008), J. Geophys. Res.-Sol. Ea., 117, B04406, https://doi.org/10.1029/2011JB008916, 2012.
Penna, N. T., Morales Maqueda, M. A., Martin, I., Guo, J., and Foden, P. R.: Sea surface height measurement using a GNSS Wave Glider, Geophys. Res. Lett., 45, 5609–5616, https://doi.org/10.1029/2018GL077950, 2018.
Rocken, C., Johnson, J., Van Hove, T., and Iwabuchi, T.: Atmospheric water vapor and geoid measurements in the open ocean with GPS, Geophys. Res. Lett., 32, L12813, https://doi.org/10.1029/2005GL022573, 2005.
Saastamoinen, J.: Atmospheric Correction for the Troposphere and Stratosphere in Radio Ranging Satellites, in: The Use of Artificial Satellites for Geodesy, edited by: Henriksen, S. W., Mancini, A., and Chovitz, B. H., 15, 247–251, https://doi.org/10.1029/GM015p0247, 1972.
Schüler, T.: The TropGrid2 standard tropospheric correction model, GPS Solut., 18, 123–131, https://doi.org/10.1007/s10291-013-0316-x, 2014.
Su, H., Yang, T., Sun, B., and Yang, X.: Modified atmospheric pressure extrapolation model using ERA5 for geodetic applications, GPS Solut., 25, 118, https://doi.org/10.1007/s10291-021-01153-8, 2021.
Sun, J., Wu, Z., Yin, Z., and Ma, B.: A simplified GNSS tropospheric delay model based on the nonlinear hypothesis, GPS Solut., 21, 1735–1745, https://doi.org/10.1007/s10291-017-0644-3, 2017.
Sun, P., Zhang, K., Wu, S., Wang, R., Zhun, D., and Li, L.: An investigation of a voxel-based atmospheric pressure and temperature model, GPS Solut., 27, 56, https://doi.org/10.1007/s10291-022-01390-5, 2023.
Sun, Z., Zhang, B., and Yao, Y.: An ERA5-based model for estimating tropospheric delay and weighted mean temperature over China with improved spatiotemporal resolutions, Earth Space Sci., 6, 1926–1941, https://doi.org/10.1029/2019EA000701, 2019a.
Sun, Z., Zhang, B., and Yao, Y.: A Global Model for Estimating Tropospheric Delay and Weighted Mean Temperature Developed with Atmospheric Reanalysis Data from 1979 to 2017, Remote Sens., 11, 1893, https://doi.org/10.3390/rs11161893, 2019b.
Thayer, G. D.: An improved equation for the radio refractive index of air, Radio Sci., 9, 803–807, https://doi.org/10.1029/RS009i010p00803, 1974.
Tregoning, P. and Herring, T. A.: Impact of a priori zenith hydrostatic delay errors on GPS estimates of station heights and zenith total delays, Geophys. Res. Lett., 33, L23303, https://doi.org/10.1029/2006GL027706, 2006.
Wang, J., Zhang, L., Dai, A., Van Hove, T., and Van Baelen, J.: A near-global, 2-hourly data set of atmospheric precipitable water from ground-based GPS measurements, J. Geophys. Res.-Atmos., 112, D11107, https://doi.org/10.1029/2006JD007529, 2007.
Wang, J., Balidakis, K., Zus, F., Chang, X., Ge, M., Heinkelmann, R., and Schuh, H.: Improving the vertical modeling of tropospheric delay, Geophys. Res. Lett., 49, e2021GL096732, https://doi.org/10.1029/2021GL096732, 2022.
Wang, X., Zhang, K., Wu., S., Fan, S., and Cheng, Y.: Water vapor-weighted mean temperature and its impact on the determination of precipitable water vapor and its linear trend, J. Geophys. Res.-Atmos., 121, 833–852, http://https://doi.org/10.1002/2015JD024181, 2016.
Webb, S. R., Penna, N. T., Clarke, P. J., Webster, S., Martin, I., and Bennitt, G. V.: Kinematic GNSS estimation of zenith wet delay over a range of altitudes, J. Atmos. Ocean. Tech., 33, 3–15, https://doi.org/10.1175/jtech-d-14-00111.1, 2016.
Xia, P., Tong, M., Ye, S., Qian, J., and Fangxin, H.: Establishing a high-precision real-time ZTD model of China with GPS and ERA5 historical data and its application in PPP, GPS Solut., 27, 2, https://doi.org/10.1007/s10291-022-01338-9, 2023.
Xu, C., Liu, C., Yao, Y., Wang, Q., and Wang, X.: Tibetan zenith wet delay model with refined vertical correction, J. Geod., 97, 31, https://doi.org/10.1007/s00190-023-01719-z, 2023.
Yang, L., Fu, Y., Zhu, J., Shen, Y., and Rizos, C.: Overbounding residual zenith tropospheric delays to enhance GNSS integrity monitoring, GPS Solut., 27, 76, https://doi.org/10.1007/s10291-023-01408-6, 2023.
Yao, Y. and Hu, Y.: An empirical zenith wet delay correction model using piecewise height functions, Ann. Geophys., 36, 1507–1519, https://doi.org/10.5194/angeo-36-1507-2018, 2018.
Yao, Y., Xu, C., Shi, J., Cao, N., Zhang, B., and Yang, J.: ITG: a new global GNSS tropospheric correction model. Sci. Rep., 5, 10273, https://doi.org/10.1038/srep10273, 2015.
Yao, Y., Sun, Z., and Xu, C.: Establishment and Evaluation of a New Meteorological Observation-Based Grid Model for Estimating Zenith Wet Delay in Ground-Based Global Navigation Satellite System (GNSS), Remote Sens., 10, 1718, https://doi.org/10.3390/rs10111718, 2018.
Yuan, P., Van Malderen, R., Yin, X., Vogelmann, H., Jiang, W., Awange, J., Heck, B., and Kutterer, H.: Characterisations of Europe's integrated water vapour and assessments of atmospheric reanalyses using more than 2 decades of ground-based GPS, Atmos. Chem. Phys., 23, 3517–3541, https://doi.org/10.5194/acp-23-3517-2023, 2023.
Zhang, H., Yuan, Y., and Li, W.: An analysis of multisource tropospheric hydrostatic delays and their implications for GPS/GLONASS PPP-based zenith tropospheric delay and height estimations, J. Geod., 95, 83, https://doi.org/10.1007/s00190-021-01535-3, 2021.
Zhang, H., Yuan, Y., and Li, W.: Real-time wide-area precise tropospheric corrections (WAPTCs) jointly using GNSS and NWP forecasts for China, J. Geod., 96, 44, https://doi.org/10.1007/s00190-022-01630-z, 2022.
Zhang, S., Wang, X., Li, Z., Qiu, C., Zhang, J., Li, H., and Li, L.: A New Four-Layer Inverse Scale Height Grid Model of China for Zenith Tropospheric Delay Correction, IEEE Access, 8, 210171–210182, https://doi.org/10.1109/ACCESS.2020.3038678, 2020.
Zhang, W., Lou, Y., Huang, J., and Liu, W.: A refined regional empirical pressure and temperature model over China, Adv. Space Res., 62, 1065–1074, https://doi.org/10.1016/j.asr.2018.06.021, 2018.
Zhang, W., Zhang, H., Liang, H., Lou, L., Cai, Y., Cao, Y., Zhou, Y., and Liu, W.: On the suitability of ERA5 in hourly GPS precipitable water vapor retrieval over China, J. Geod., 93, 1897–1909 https://doi.org/10.1007/s00190-019-01290-6, 2019.
Zhang, Z., Lou, Y., Zhang, W., Wang, Z., Bai, J., Zhang, Z., and Shi, C.: Dynamic stochastic model for estimating GNSS tropospheric delays from air-borne platforms, GPS Solut., 27, 39, https://doi.org/10.1007/s10291-022-01375- 4, 2023.
Zhao, Q., Wang, W., Li, Z., Du, Z., Yang, P., Yao, W., and Yao, Y.: A high-precision ZTD interpolation method considering large area and height differences, GPS Solut., 28, 4, https://doi.org/10.1007/s10291-023-01547-w, 2024.
Zhu, G., Huang, L., Yang, Y., Li, J., Zhou, L., and Liu, L.: Refining the ERA5-based global model for vertical adjustment of zenith tropospheric delay, Satell. Navig., 3, 27, https://doi.org/10.1186/s43020-022-00088-w, 2022.