the Creative Commons Attribution 4.0 License.
the Creative Commons Attribution 4.0 License.
 | 23 Jul 2024
Global variable-resolution simulations of extreme precipitation over Henan, China, in 2021 with MPAS-Atmosphere v7.3
Zijun Liu
Li Dong
Zongxu Qiu
Xingrong Li
Huiling Yuan
Dongmei Meng
Xiaobin Qiu
Dingyuan Liang
Yafei Wang
A historic rainstorm occurred over Henan, China, in July 2021 (“7.20” extreme precipitation event), resulting in significant human casualties and socioeconomic losses. A global variable-resolution model (MPAS-Atmosphere v7.3) was employed to simulate this extreme precipitation event. A series of simulations have been done at both quasi-uniform (60 and 15 km) and variable-resolution (60–15 and 60–3 km) meshes from hydrostatic to nonhydrostatic scale with two parameterization scheme suites. For the 48 h peak precipitation duration (20–22 July), the 60–3 km variable-resolution simulation coupled with the scale-aware convection-permitting parameterization scheme suite stands out predominantly among other simulation experiments as it reproduces this extreme precipitation event most accurately. At 15 km resolution, the 60–15 km variable-resolution simulation achieves comparable forecasting skills to the 15 km quasi-uniform simulation but at a much reduced computing cost. In addition, we found that the default mesoscale suite generally outperforms the convection-permitting suite at 15 km resolution as simulations coupled with the convection-permitting suite missed the third peak of this extreme precipitation event, while the mesoscale suite did not. Furthermore, it is found that the large-scale circulation plays a critical role in the peak precipitation simulations at 15 km resolution, via influencing the simulated low-level wind. During the second peak precipitation period, simulations with the convection-permitting parameterization scheme suite at 15 km resolution generate a prominent low-level easterly wind component bias, which is largely attributed to the excessively evaporative cooling in the lower troposphere. This study further reveals that at 15 km resolution the diabatic heating from the grid-scale precipitation accounts more for the low-level wind bias than the convective-scale precipitation. Given that two different cloud microphysics schemes, namely Thompson and WSM6 schemes, are used in the convection-permitting and default mesoscale parameterization scheme suites, respectively, these microphysics schemes are found to be the primary contributor to the low-level wind simulation bias.
- Article
(19283 KB) - Full-text XML
- BibTeX
- EndNote


From 17 to 22 July 2021, a historic rainstorm occurred in Henan Province of China (“7.20” extreme precipitation event), with a maximum hourly precipitation of 201.9 mm. This rainstorm caused devastating urban flooding in Henan, resulting in 292 fatalities, 47 missing persons, and a direct economic loss of CNY 53.2 billion (Yin et al., 2021; Rao et al., 2022). The rainstorm event occurred under the atmospheric circulation background of the abnormally enhanced western Pacific subtropical high (WPSH), which is displaced northward as well, and the dual typhoon presence (typhoons In-fa and Cempaka) (Xu et al., 2022). The main sources of water vapor for this heavy rain event can be attributed to three factors: the WPSH and typhoons In-fa and Cempaka (Nie and Sun, 2022). East China frequently experiences summer extreme precipitation events such as the 7.20 event studied here due to the East Asian monsoon, tropical cyclones, and mesoscale convective vortex (Ding and Johnny CL, 2005; Lonfat et al., 2004; Houze, 2004). Previous studies have proposed numerous mechanisms for the occurrence and development of extreme precipitation events in eastern China. The subtropical high over the northwest Pacific is a key system affecting the East Asian summer monsoon and typhoons in the northwest Pacific region, which provides a possibility for seasonal prediction of the East Asian summer monsoon (Wang et al., 2013). The record-breaking Meiyu in the Yangtze River Basin in 2020 was characterized by a wide meridional rain belt with abundant precipitation and high frequency of occurrence of heavy rain. In addition, this long-lasting Meiyu season of 2020 is distinguished by an extended duration with an early onset and late retreat (Ding et al., 2021). Liu et al. (2020) pointed out that the summer extreme precipitation events are the result of the sequential warm and cold Meiyu fronts that are regulated by the North Atlantic Oscillation. The synoptic-system-related low-level jet (SLLJ) and boundary layer jet (BLJ) are closely related to heavy precipitation events in the coastal region of southern China, and the interaction between these two jets has a critical impact on convective activity initiation (Du and Chen, 2019; Zhang and Meng, 2019). Zheng and Wang (2021) investigated the influence of the three main oceans on extreme precipitation in the Yangtze River Basin and found that sea surface temperature anomalies (SSTAs) in the western North Atlantic in May could effectively predict precipitation anomalies in the Yangtze River Basin in June. With the global warming trend, the frequency of summer extreme precipitation events is on the rise, and accurately predicting the duration and location of extreme precipitation events remains a significant challenge (Sun et al., 2016). Despite numerous studies having been done related to extreme precipitation simulations and rainfall data analysis, the forecasting performance for extreme precipitation events like the 7.20 rainstorm remains unsatisfactory, highlighting the need for improving the forecasting model to achieve sufficient prediction skills. (Chen et al., 2020; Sun et al., 2018; Liu et al., 2020).
The Model for Prediction Across Scales (MPAS-Atmosphere) is an advanced atmospheric forecasting model that has been widely applied to predict heavy rainfall, in particular, with the variable-resolution feature. Zhao et al. (2019) conducted MPAS experiments on the 2012 heavy rainfall event associated with the Meiyu front in East Asia and pointed out that the model resolution has a significant impact on the strength and location of updrafts and precipitation. Additionally, Zhao et al. (2019) found that the convection-permitting scheme is also suitable for global variable-resolution simulations. Xu et al. (2021) found that the low-resolution (60 km) MPAS simulation overestimated the precipitation frequency (PF) of the Meiyu front precipitation while underestimating the precipitation amount (PA) and intensity (PI), while, in contrast, the high-resolution (4 km) MPAS simulation captured the diurnal cycle of PA well, even in the absence of typhoon influence. Furthermore, Cheng et al. (2023) compared MPAS global variable-resolution (MPAS-VR) with MPAS regional configuration (MPAS-RCM) and found that MPAS-VR outperformed MPAS-RCM in capturing the mean climate state, interannual variability, and extreme events of the East Asian summer monsoon. Moreover, the difference between MPAS-VR and MPAS-RCM indicates that the former is a promising option for regional climate simulations as it can capture regional climate features with higher fidelity. These findings suggest that MPAS has the potential to provide more accurate predictions of heavy rainfall, especially with the global variable-resolution capability. The results also demonstrate the importance of selecting the appropriate model resolution and parameterization scheme when predicting precipitation events.
To date, there has been relatively little work conducted on the simulation of extreme precipitation events in eastern China with the global variable-resolution MPAS model. This is a crucial research gap that needs to be filled as extreme precipitation events can have devastating consequences, leading to flash floods, landslides, and other severe weather-related disasters (Li et al., 2016; Zhai et al., 2005; Ding et al., 2008). Therefore, it is imperative to further investigate the performance of MPAS in simulating extreme precipitation events. This can be achieved through the analysis of its spatial and temporal resolution, parameterizations, and initialization methods (Liang et al., 2021; Zhao et al., 2016; Rauscher et al., 2013; Davis et al., 2016; Wang, 2022; Fowler et al., 2016). Furthermore, the evaluation of the performance of MPAS in simulating extreme precipitation events can help improve the accuracy and reliability of the operational forecast of extreme precipitation events. In the present work, Sect. 2 introduces the data, MPAS model, physics parameterizations, and experimental design. Section 3 presents the evaluation of the MPAS experiments configured with different resolutions. Section 4 further analyzes the simulation performances with different parameterization scheme suites. The findings are summarized in Sect. 5.
2.1 Observed and reanalysis data
Hourly surface observation data at 178 stations, including precipitation, temperature at 2 m, and relative humidity, are provided by the National Meteorological Information Center of the China Meteorological Administration (CMA; https://data.cma.cn/, last access: 14 January 2024) to evaluate the simulated record-breaking heavy rainfall event that occurred during 20–21 July 2021 over Henan, China (32–37° N, 110–118° E). The hourly precipitation and wind field dataset from the European Centre for Medium-Range Weather Forecasts (ECMWF) Reanalysis (ERA5; 0.25° × 0.25°) is used as a reference to evaluate the simulated distributions of precipitation and winds (https://cds.climate.copernicus.eu/cdsapp#!/home, last access: 14 January 2024). For comparison, the global forecast products starting from 00:00 UTC on 19 July 2021 at 0.25° horizontal resolutions are also utilized. All the above-mentioned data have undergone strict quality control.
2.2 MPAS-Atmosphere (MPAS-A) model
The MPAS model (version 7.3) used in this study is a fully compressible nonhydrostatic model designed for weather and climate prediction (Skamarock et al., 2012; Skamarock and Klemp, 2008). MPAS utilizes C-grid staggering of prognostic variables and centroidal Voronoi meshes for sphere discretization. In MPAS, the grid refinement allows for a smooth transition from the coarse-mesh region of the globe to the fine-mesh region for the region of interest. MPAS uses the unstructured mesh based on spherical centroidal Voronoi tessellations (SCVTs), which allows the discretization of the sphere into either a global quasi-uniform mesh or a variable-resolution mesh. The terrain-following hybrid coordinate is used for vertical discretization (Klemp, 2011). The MPAS atmospheric dynamical core solves the fully compressible nonhydrostatic equations of motion (Klemp et al., 2007). The vertical coordinate surfaces are progressively smoothed with height to eliminate the impact of small-scale terrain structures. The dynamical solver integrates the flux-form compressible equations using the split-explicit technique (Klemp et al., 2007). The third-order Runge–Kutta scheme is used for the basic temporal discretization, along with the explicit time-splitting technique (Wicker and Skamarock, 2020), similar to that of the Weather Research and Forecasting (WRF) model (Skamarock and Klemp, 2008). The scalar transport scheme used by MPAS on its Voronoi mesh is explicated with the monotonic option used for all moist species (Skamarock and Gassmann, 2011). Extensive testing of MPAS simulations on idealized and realistic cases has verified that smooth transitions between the fine- and coarse-resolution regions of the mesh do not significantly distort the atmospheric flow (Skamarock et al., 2012; Park et al., 2013).
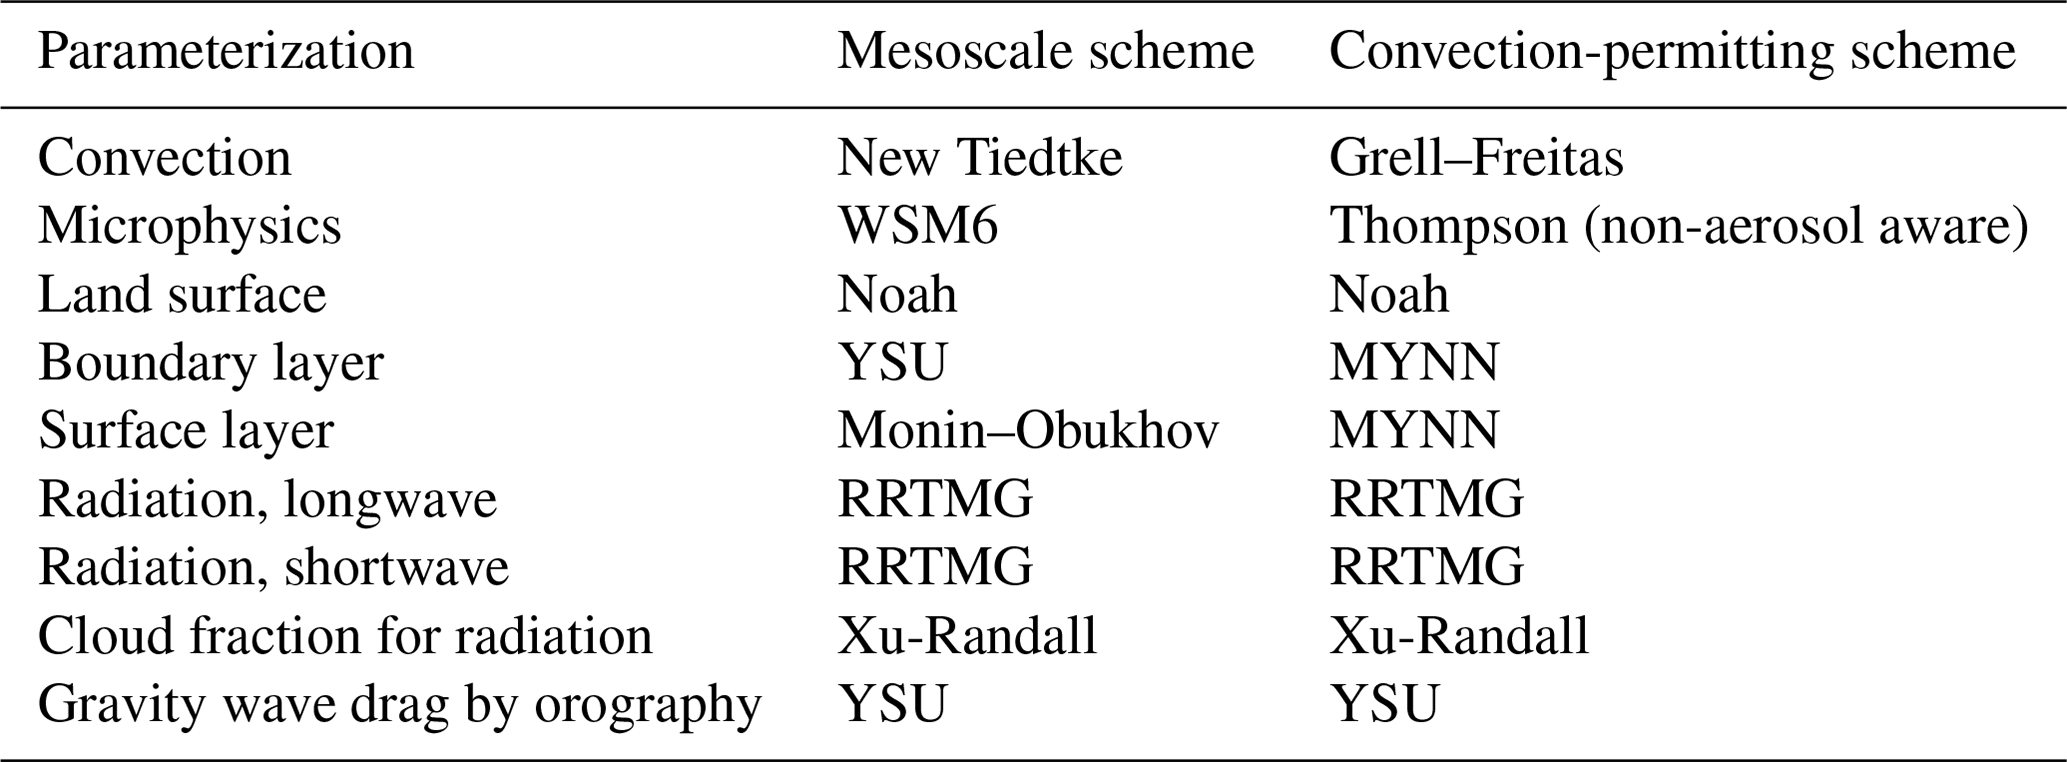
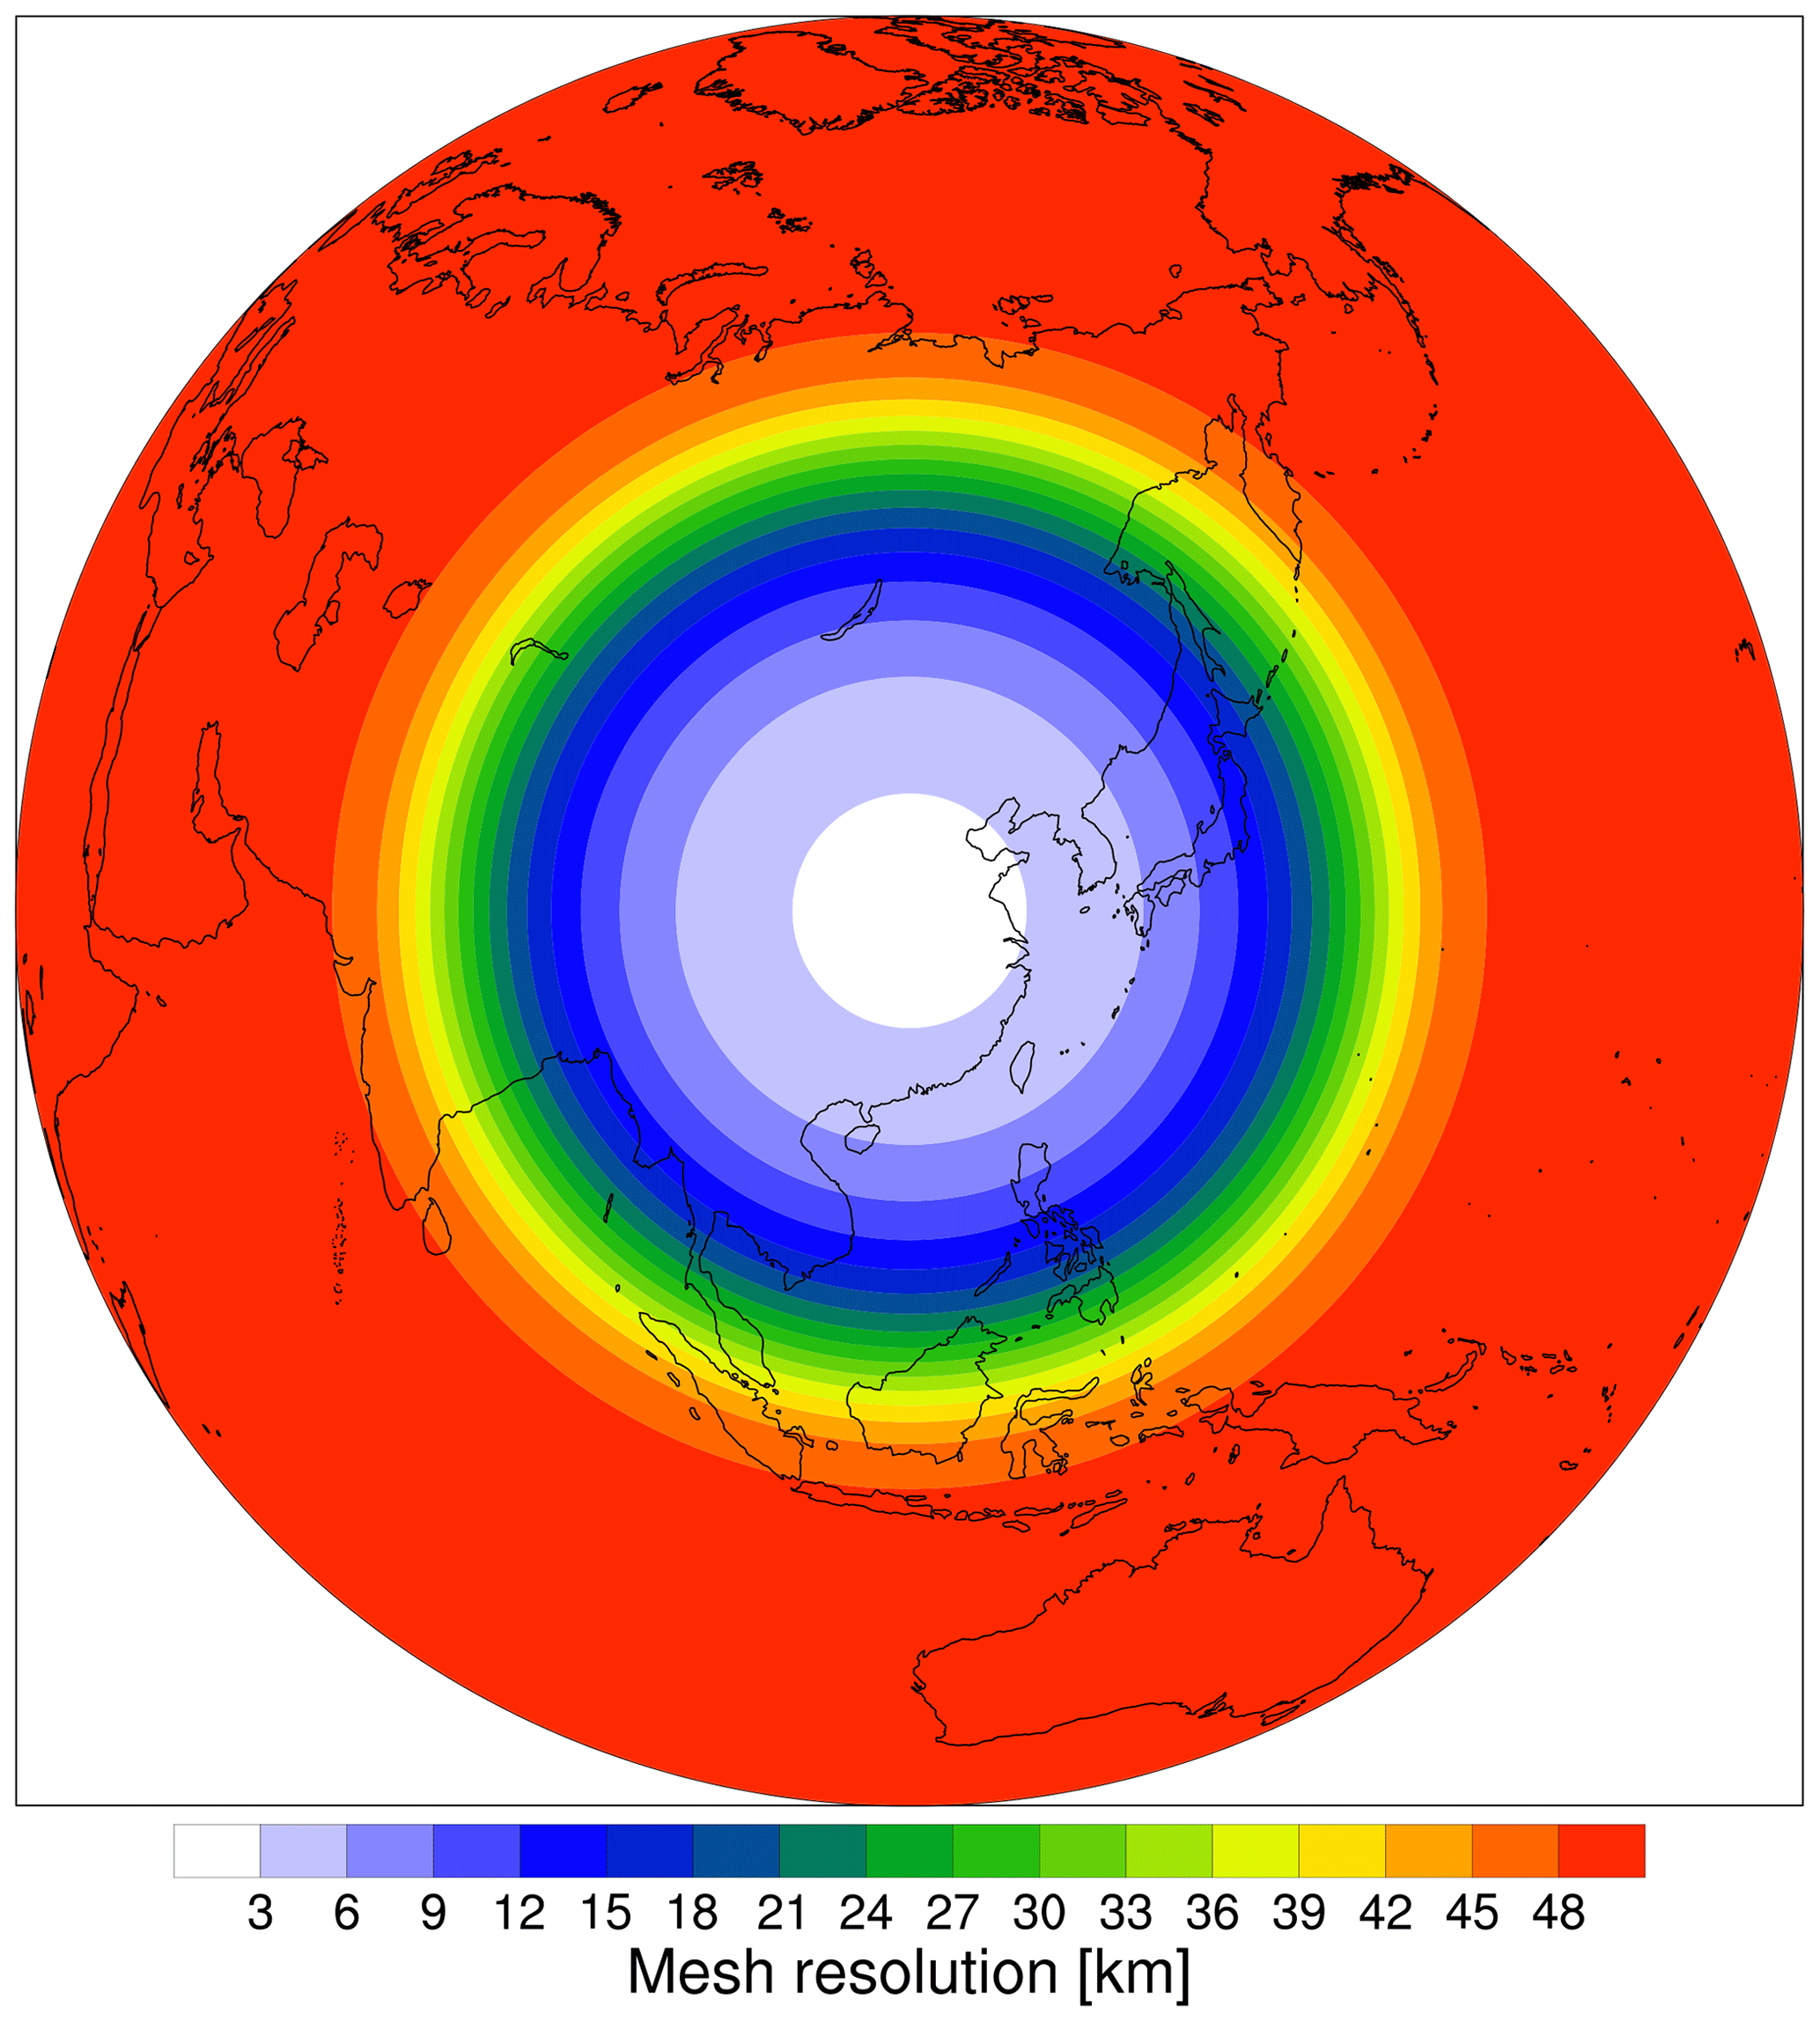
Figure 1Global variable-resolution mesh size distribution in the 60–3 km experiment.
MPAS incorporates two sets of built-in physical parameterization scheme suites taken from the WRF model, specifically the mesoscale (MS) suite and the convection-permitting (CP) suite (Table 1). The MS scheme suite has been tested for mesoscale resolutions (dx>10 km cell spacing), and the CP scheme suite is appropriate at spatial resolutions allowing for both explicitly resolved hydrostatic and nonhydrostatic motions. The CP scheme suite has been tested for mesh spacings from several hundred kilometers down to several kilometers in MPAS. The Grell–Freitas convective scheme of the convection-permitting suite transitions from a conventional parameterization of deep convection at hydrostatic scales (dx>10 km cell spacing) to a parameterization of shallow convection at cell spacings of less than 10 km (Fowler et al., 2016). This is the recommended suite for MPAS simulations where convection-permitting meshes (dx<10 km) are employed. For instance, for the global variable-resolution mesh that bridges hydrostatic and nonhydrostatic scales, the Grell–Freitas convection scheme is the optimal choice.
The new Tiedtke (NTD) scheme (Zhang et al., 2011; Bechtold et al., 2004, 2008, 2014) is similar to the Tiedtke scheme (Tiedtke, 1989) used in the Regional Climate Model version 4 (REGCM4) and the ECMWF model. The Grell–Freitas (GF) scheme (Grell and Freitas, 2014) is an improved Grell–Dévényi scheme (Grell and Dévényi, 2002) that attempts to extend the mesh resolution to cloud-resolving scales, as proposed by Arakawa et al. (2011). In particular, scale-aware parameterization is essential for global simulations across hydrostatic and nonhydrostatic scales. Fowler et al. (2016) implemented the GF scheme in MPAS and demonstrated that this scheme functions as a shallow convective scheme over the mesh-refined region but a deep convection scheme over the coarse-resolution region. As the horizontal resolution increases, subgrid-scale motions are resolved more accurately, leading to a decrease in the contribution of convective precipitation to the total precipitation and an increase in the contribution of grid-scale precipitation (Fowler et al., 2016). For cloud microphysics, the WRF Single-Moment 6-class (WSM6) scheme (Hong and Lim, 2006) is a one-moment prognostic parameterization with ice, snow, and graupel, while the Thompson scheme (Thompson et al., 2008; Thompson and Eidhammer, 2014) includes hydrometeor species and graupel processes suitable for high-resolution simulations, both of which are bulk microphysical parameterizations. Two boundary layer schemes are available in MPAS, namely, the Yonsei University (YSU) scheme (Hong et al., 2006; Hong, 2010) and the Mellor–Yamada–Nakanishi–Niino (MYNN) scheme (Nakanishi and Niino, 2006, 2009). Other available physical parameterization schemes in MPAS include the Noah land surface scheme (Chen and Dudhia, 2001), the Monin–Obukhov surface layer scheme, and the Rapid Radiative Transfer Model for Ground Control Models (RRTMG) scheme (Iacono et al., 2000).
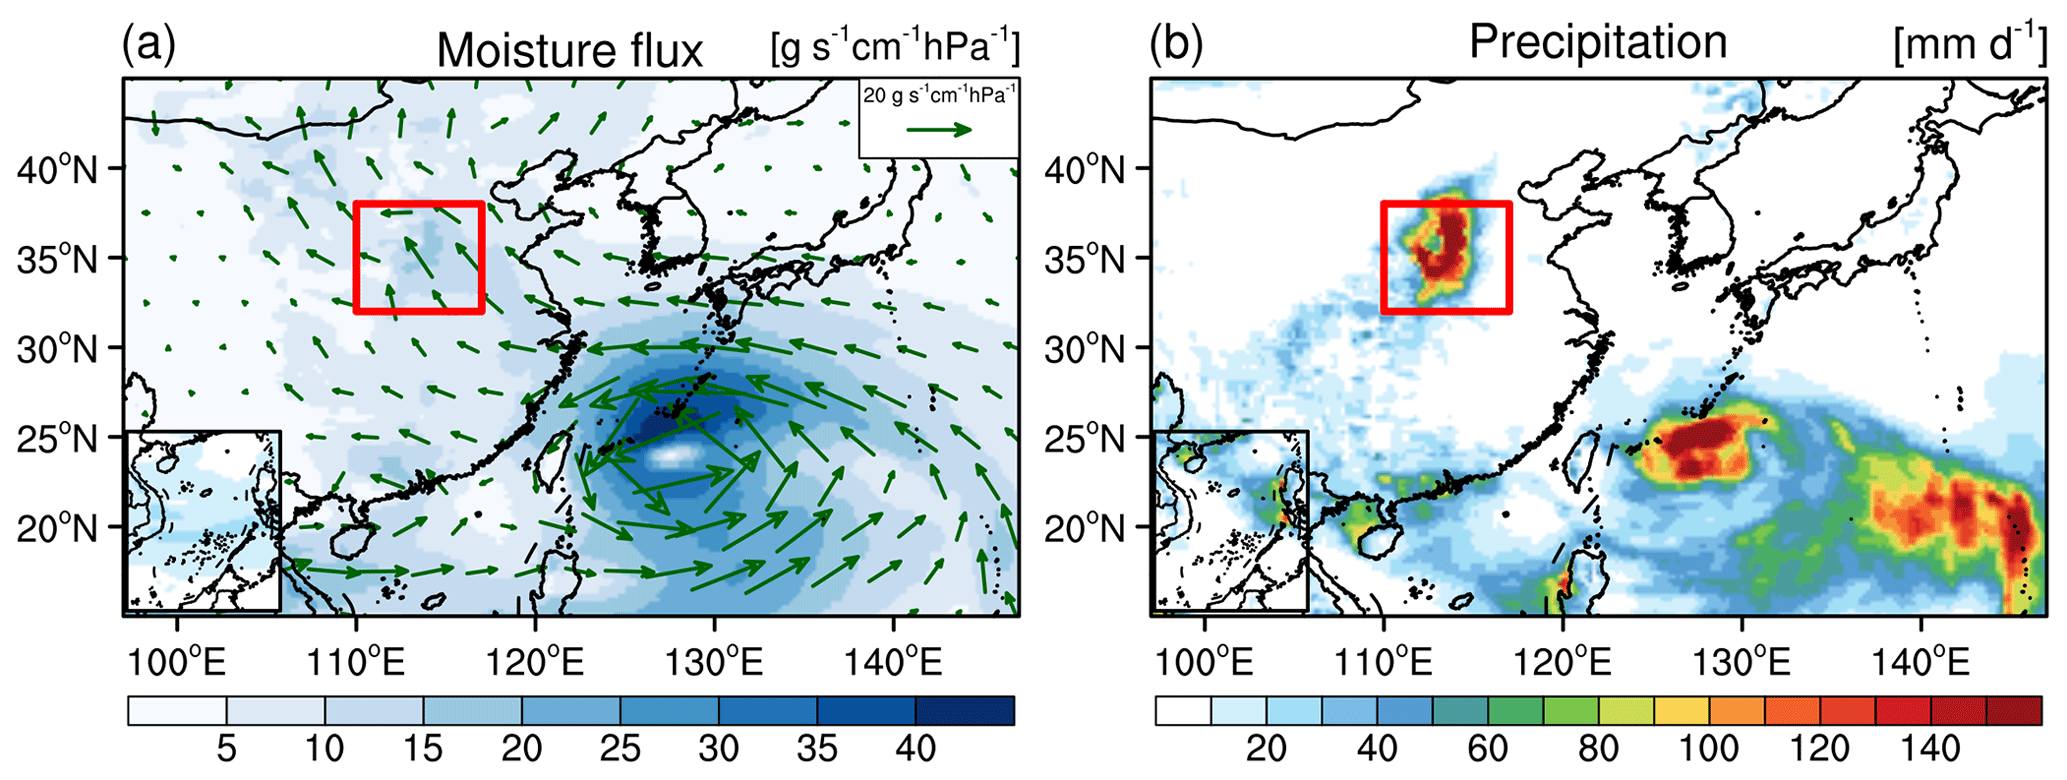
Figure 2Background of the extreme precipitation event in Henan in July 2021. (a) Spatial distributions of moisture flux at 850 mb averaged from 00:00 UTC on 19 July 2021 to 00:00 UTC on 23 July 2021. The shading represents the intensity of water vapor flux. (b) Averaged daily precipitation (unit: mm d−1) from 00:00 UTC on 19 July 2021 to 00:00 UTC on 23 July 2021, derived from ERA5 hourly precipitation data. The red box denotes the target region.
2.3 Numerical experiments
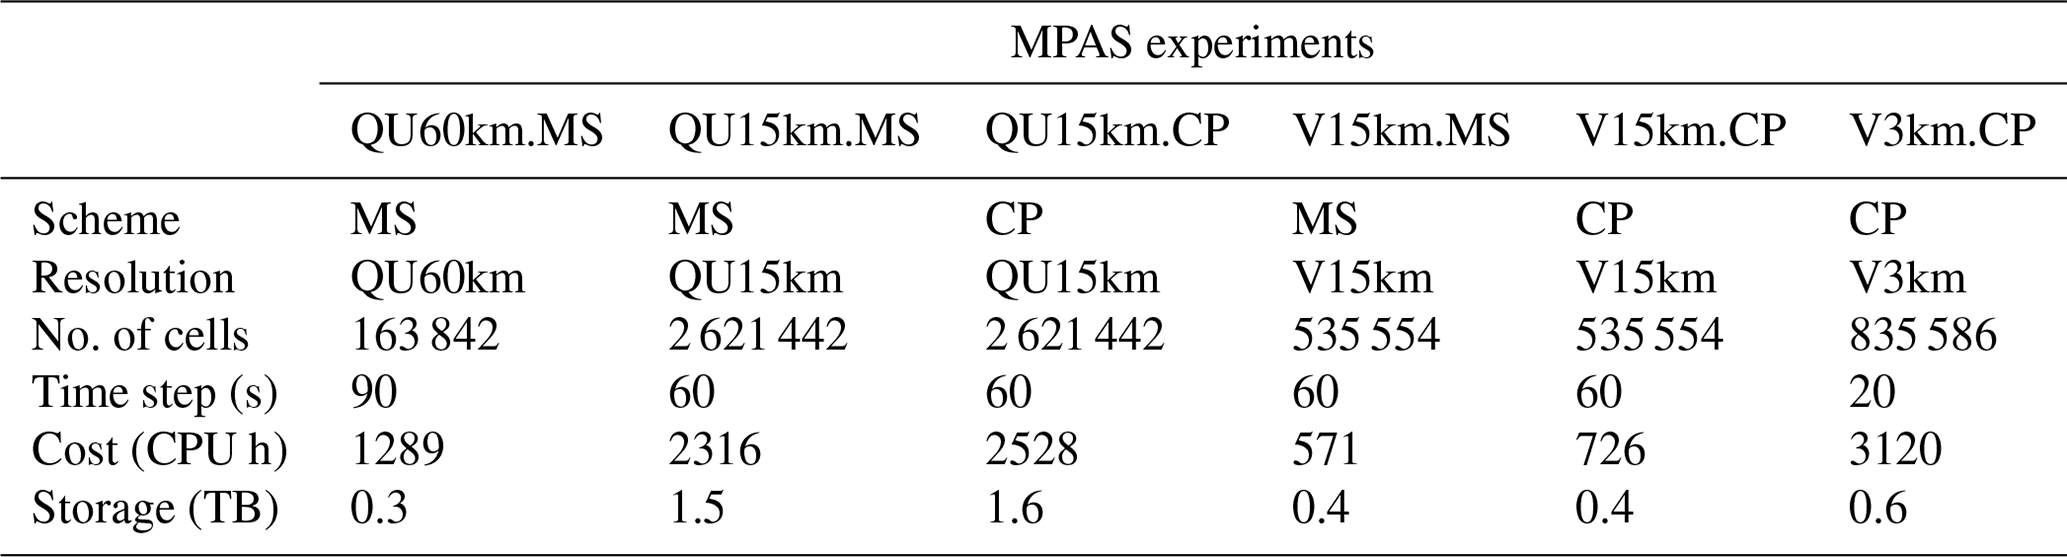
Several MPAS-A global simulations have been performed on both quasi-uniform resolution meshes and variable-resolution meshes with two parameterization scheme suites (Table 2). All simulations have been conducted with 51 vertical levels up to 30 km (Skamarock et al., 2019). Two quasi-uniform resolution meshes and two variable-resolution meshes are used in this study where the higher resolution is centered over Henan Province and covers the entirety of East China. The two quasi-uniform meshes have grid spacings of quasi-uniform 15 km (QU15km) and 60 km (QU60km). The two variable-resolution meshes feature a circular high-resolution region centered over East China. Figure 1 shows the exact mesh resolution of the 60–3 km variable-resolution mesh (V3km) that has a refined region with grid spacing of approximately 3 km with the mesh spacing gradually increasing through a transition zone to approximately 60 km for the rest of the globe. The other variable-resolution mesh (60–15 km) configuration has a similar structure but with the mesh spacing of 15 km (V15km) over the refined region gradually increasing to 60 km over the coarse region. It is noteworthy that the number of cells of the QU15km and V15km experiments is 2 621 442 and 535 554, respectively, while the number of cells of the V3km experiment is 835 586 (Table 2). The distinct numbers of cells will impact the computational and storage requirements for each experiment directly, despite the different time step in the V3km experiment. The execution of a single QU15km.CP and V3km.CP experiment involves computational demands of 2528 and 3120 CPU h, along with storage requirements of 1.6 and 0.6 TB, respectively. Due to extensive computational and storage requirements, particularly for the QU15km and V3km experiments, we opted for a single-member ensemble in this study.
Table 2Description of the numerical experiments conducted and analyzed in this study. “MS” represents the mesoscale scheme, while “CP” represents the convection-permitting scheme suite in Table 1. “QU60km” (“QU15km”) denotes the global quasi-uniform resolution of 60 km (15 km). “V15km” (“V3km”) represents the variable resolution with the grid spacing ranging from 60 to 15 km (3 km) with the refined region illustrated in Fig. 1.
To simulate the heavy precipitation event that occurred during 20–21 July 2021 over Henan Province, all the MPAS experiments were initialized at 00:00 UTC on 19 July 2021 to allow for appropriate spin-up time, and the modeling results for 20–22 July 2021 are analyzed. The simulations were initialized using the analysis data at 0.25° horizontal resolution at 00:00 UTC on 19 July 2021 from the Global Forecast System (GFS) of the National Center for Environmental Prediction (NCEP), which is the same as what is used for the GFS forecast for that period. The sea surface temperature (SST) is also prescribed the same as what is used by the GFS forecast for that period. In this way, the MPAS simulations can also be compared against the GFS forecast starting from 00:00 UTC on 19 July 2021.
Figure 2 illustrates the background of the extreme precipitation event that occurred in Henan in July 2021. Figure 2a shows the spatial distribution of water vapor transport flux during the event, with color shading representing the intensity of water vapor transport. The region of the July 21 extreme precipitation event is outlined by the red box (32–37° N, 110–120° E). We selected 19 to 23 July to further specify the period of interest, with a particular focus on UTC times of 20 and 21 July, as there were clear peaks during this period. During this time, typhoons In-Fa and Cempaka were associated with strong water vapor transport, transporting moisture from the western Pacific and South China Sea to northern China. In the highlighted area of Henan, a conspicuous convergence of water vapor was observed. The rainfall area during this period was generally consistent with the area of maximum water vapor transport. In the subsequent analysis, we partition the 7.20 extreme precipitation event into two 24 h periods, as mentioned by Rao et al. (2022), namely the first peak on 20 July (from 20 July at 00:00 to 21 July at 00:00 UTC) and the second peak on 21 July (from 20 July at 00:00 to 21 July at 00:00 UTC), and precipitation during these identified periods exceeds 80 % of the total precipitation. This temporal segmentation facilitates a more detailed examination of the distinct phases of the extreme precipitation event, allowing for a nuanced understanding of its evolution and characteristics.
3.1 First peak period
Figure 3 shows the spatial distributions of precipitation and wind at 850 mb averaged from 20 July at 00:00 to 21 July at 00:00 UTC from the simulations with global uniform and variable resolution plus two parameterization suites. The mean precipitation from the CMA stations and ERA5 reanalysis is also shown. The initiation time of the GFS forecast product coincides with the initiation time of the MPAS experiments conducted in this study. Concentrated heavy rainfall zones are evident in the CMA observations for the central and northern regions of the city of Zhengzhou, Henan Province. Table 3 shows the correlation coefficients (CCs), root-mean-square error (RMSE), and mean bias (MB) of simulated and observed precipitation. The results of the model simulations are presented in Fig. 3d–i. While precipitation exceeding 150 mm d−1 is predicted in Henan Province, the spatial distribution of the precipitation pattern exhibits variations among the simulations. The spatial correlation coefficient and RMSE of precipitation between the observation and the V3km.CP simulation exhibit the greatest magnitude among all model simulations with a value of 0.51 and 11.78, respectively. Despite having different mesh configurations, the simulated results of V15km.MS and QU15km.MS are similar, as well as for the performance of V15km.CP and QU15km.CP. However, QU60km.MS failed to capture the heavy precipitation occurring near Zhengzhou and incorrectly predicted the precipitation by locating the maximum precipitation area to the southwest of Zhengzhou due to the coarse grid resolution utilized in this simulation. Table 4 shows the CCs, RMSE, and MB of wind at 850 mb between the various simulations and ERA5 reanalysis data. The correlation coefficient and RMSE of simulated and observed precipitation are in good agreement with the simulated and ERA5 wind at 850 mb, indicating a coherent response of precipitation to the atmospheric wind field. Interestingly, the observed maximum precipitation location is coincident with the apparent curving of the 850 mb wind vector; namely the wind changes from southerly to southeasterly and then easterly, based on Fig. 3a. However, all simulations seem to fail to precisely reproduce the sharp curving of the horizontal wind; namely, most of the simulated wind vector merely turns from southeasterly to easterly instead. Hence, the mislocation of the simulated maximum precipitation is likely attributed to errors in the low-level wind simulations.
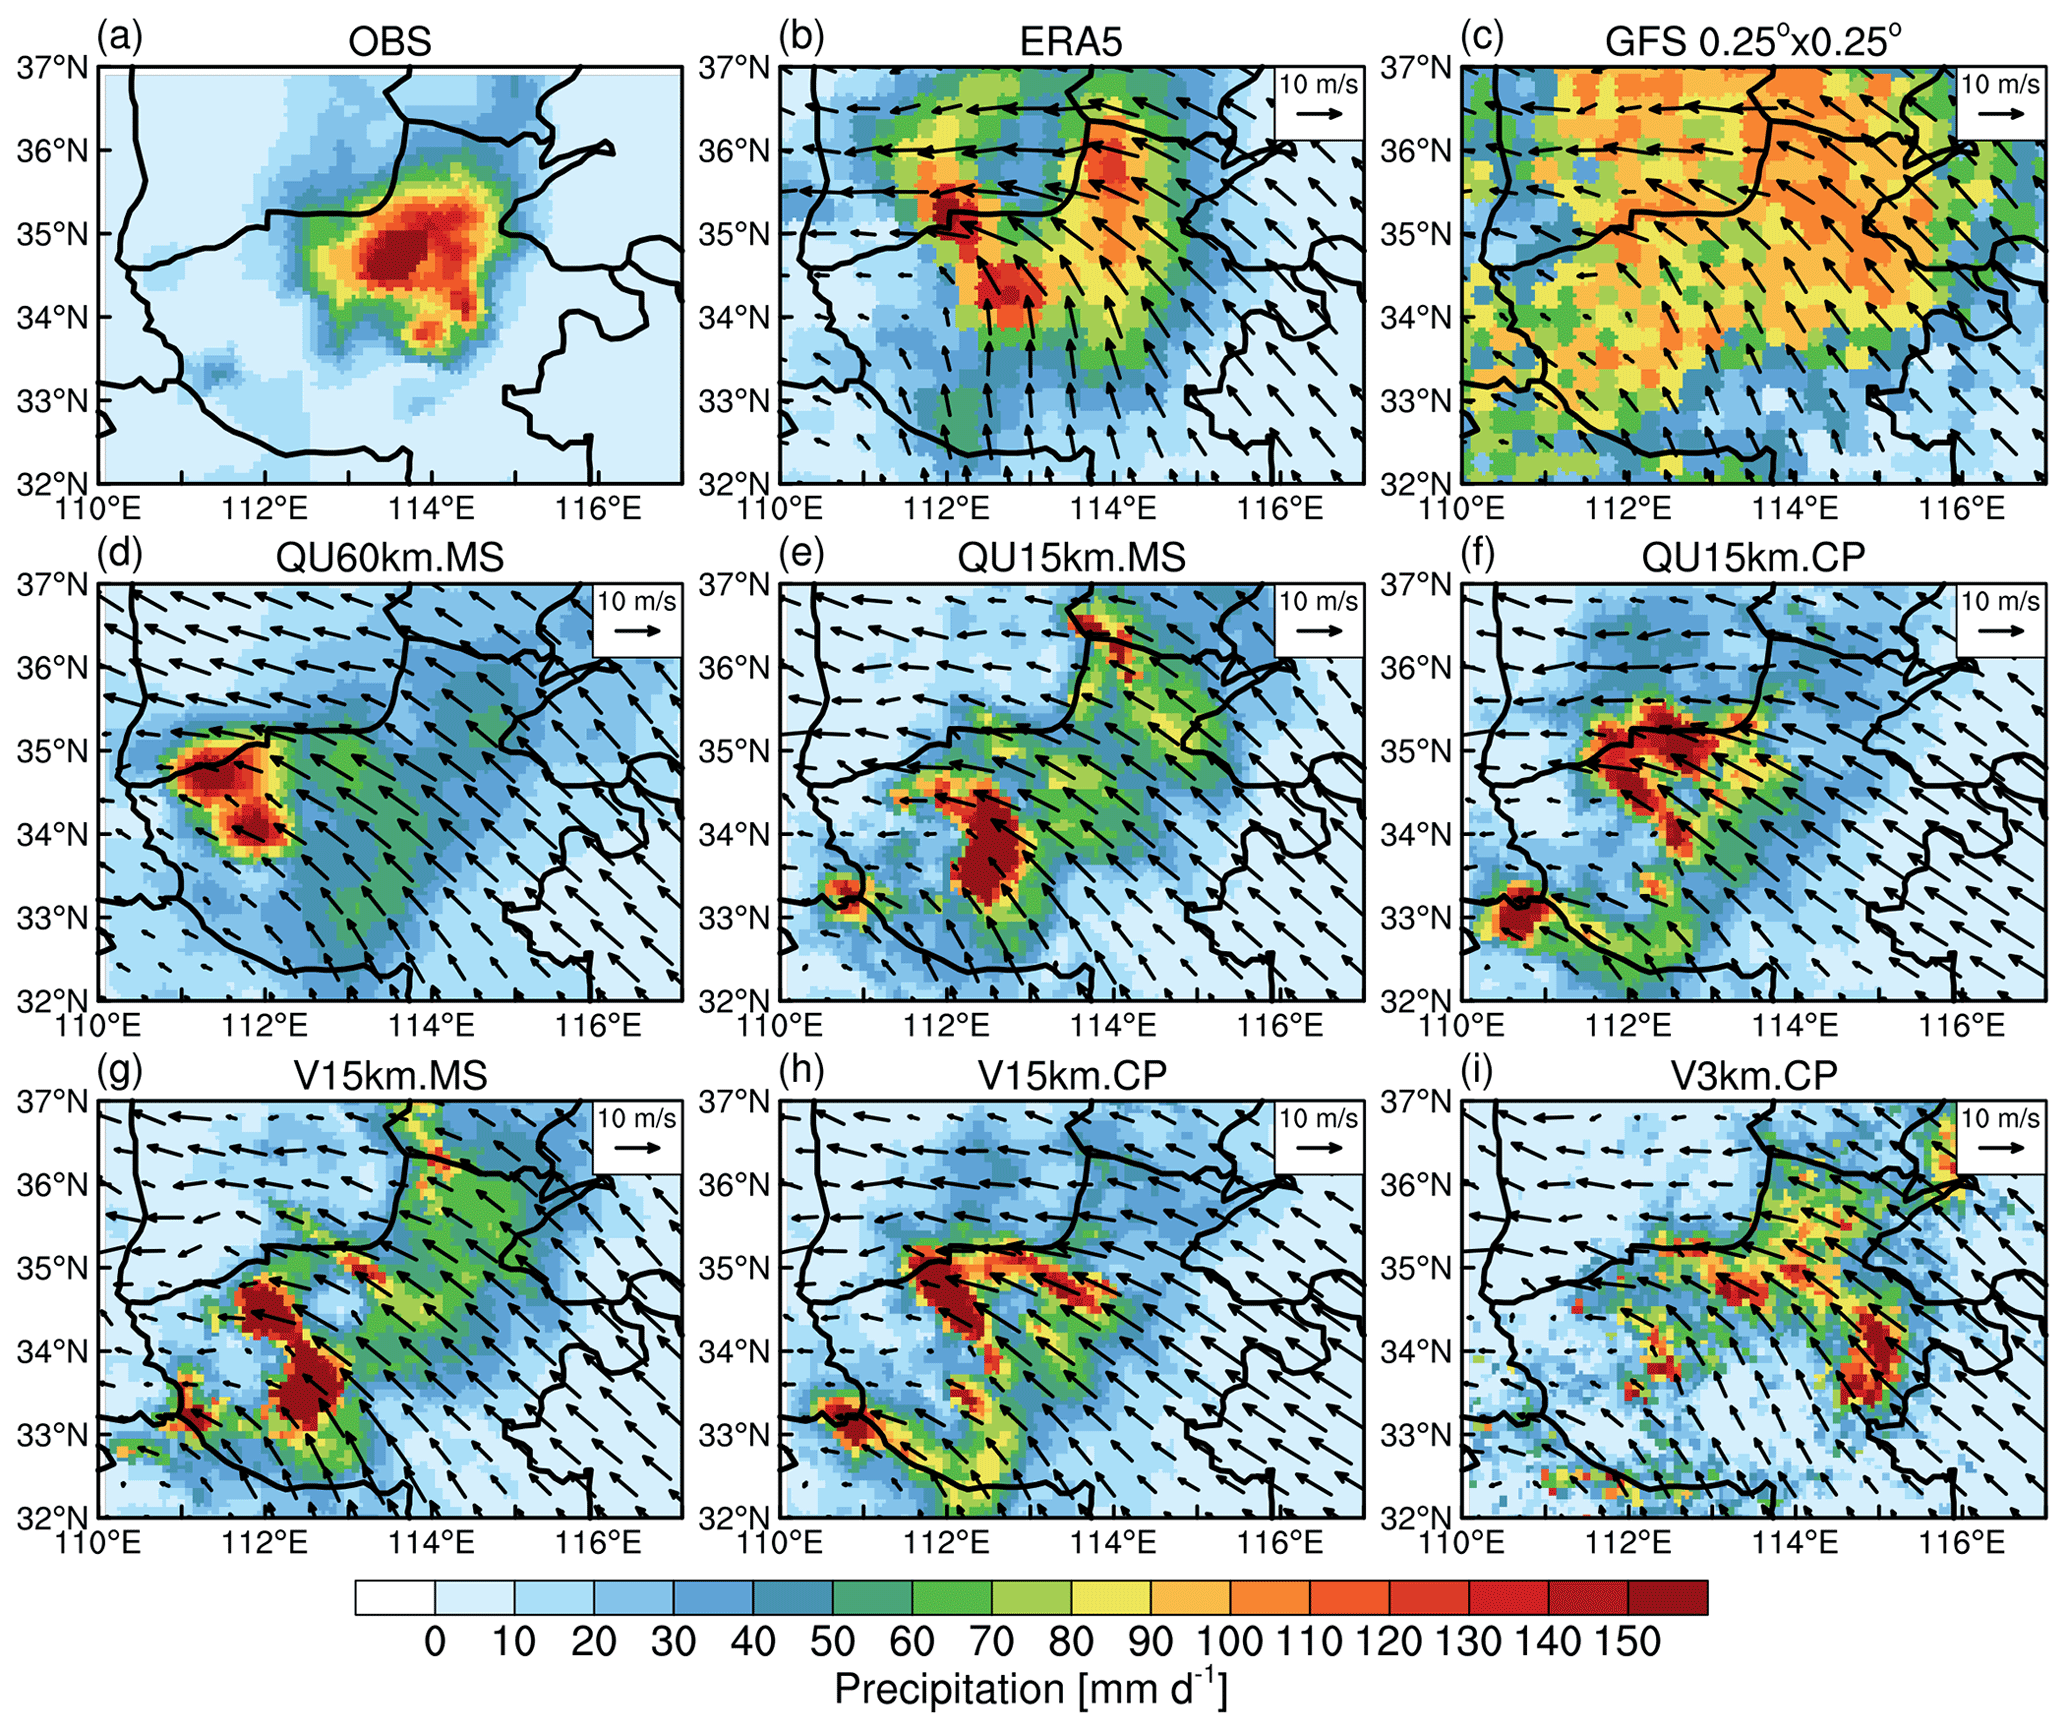
Figure 3The observed mean precipitation from the CMA stations (a), ERA5 reanalysis (b), and GFS 0.25° (c) are shown. Spatial distributions of precipitation and wind fields at 850 mb averaged from 20 July at 00:00 to 21 July at 00:00 UTC for the simulations with global quasi-uniform (60, 15 km) and variable (60–15, 60–3 km) resolutions, along with two parameterization schemes (MS: mesoscale scheme suite; CP: convection-permitting scheme suite), are shown in (d) through (i).
Table 3The correlation coefficients (CCs), root-mean-square error (RMSE), and mean bias (MB) of precipitation between the simulations and observed CMA data are listed below. The bold font in the table denotes statistical significance at the 95 % confidence level based on the bootstrap analysis. “20 July pre.” corresponds to the statistics (i.e., correlation coefficients, root-mean-square error, and mean bias) between the simulations and observations from 20 July at 00:00 to 21 July at 00:00 UTC of precipitation (Fig. 3). Similarly, “20 July zonal pre.” represents the statistics of Fig. 5, while “21 July pre.” represents Fig. 6, “21 July zonal pre.” represents Fig. 8, “lat-time” represents Fig. 16, and “lon-time” represents Fig. 17.
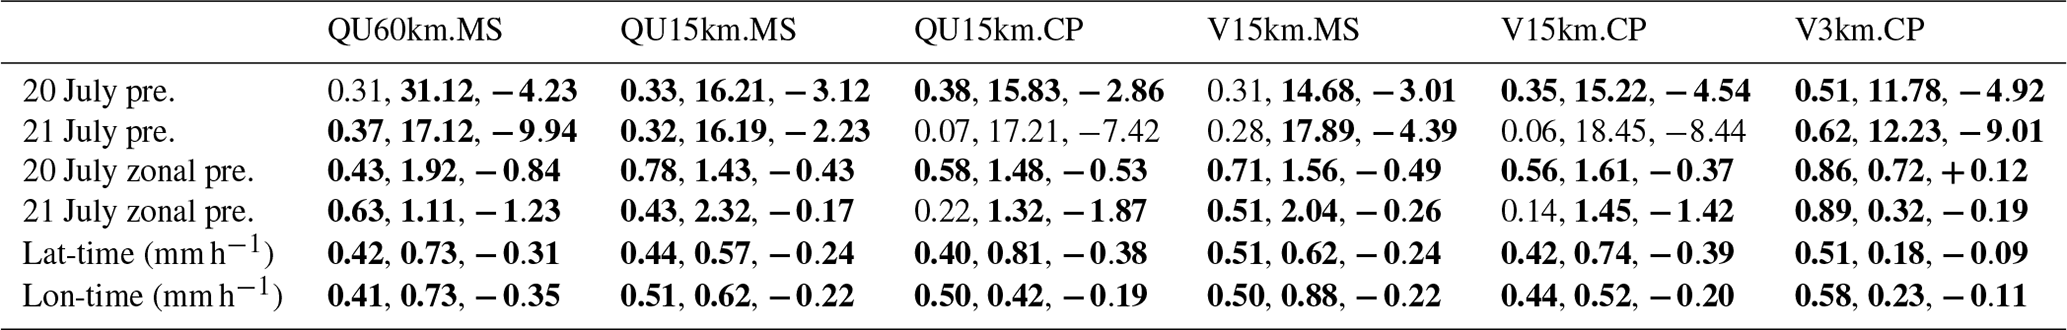
Table 4The correlation coefficients (CCs), root-mean-square error (RMSE), and mean bias (MB) of wind at 850 mb between the various simulations and ERA5 data are listed below. The bold font in the table denotes statistical significance at the 95 % confidence level based on the bootstrap analysis. “20 July U (V)” corresponds to the statistics between the simulations and ERA5 from 20 July at 00:00 to 21 July at 00:00 UTC of zonal (meridional) wind at 850 mb (Fig. 3). Similarly, “20 July U (V)” corresponds to the correlation coefficients between the simulations and ERA5 from 21 July at 00:00 to 22 July at 00:00 UTC (Fig. 6).
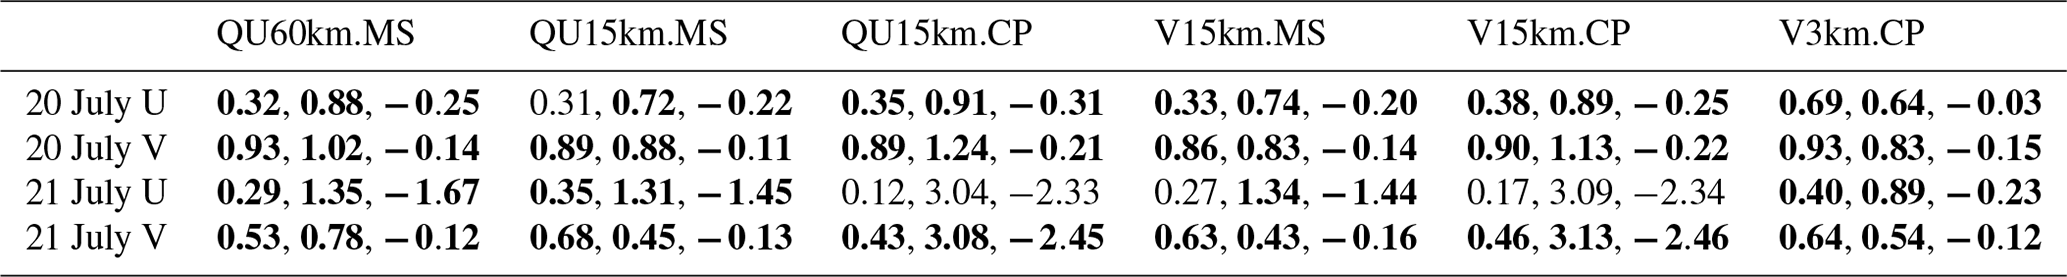
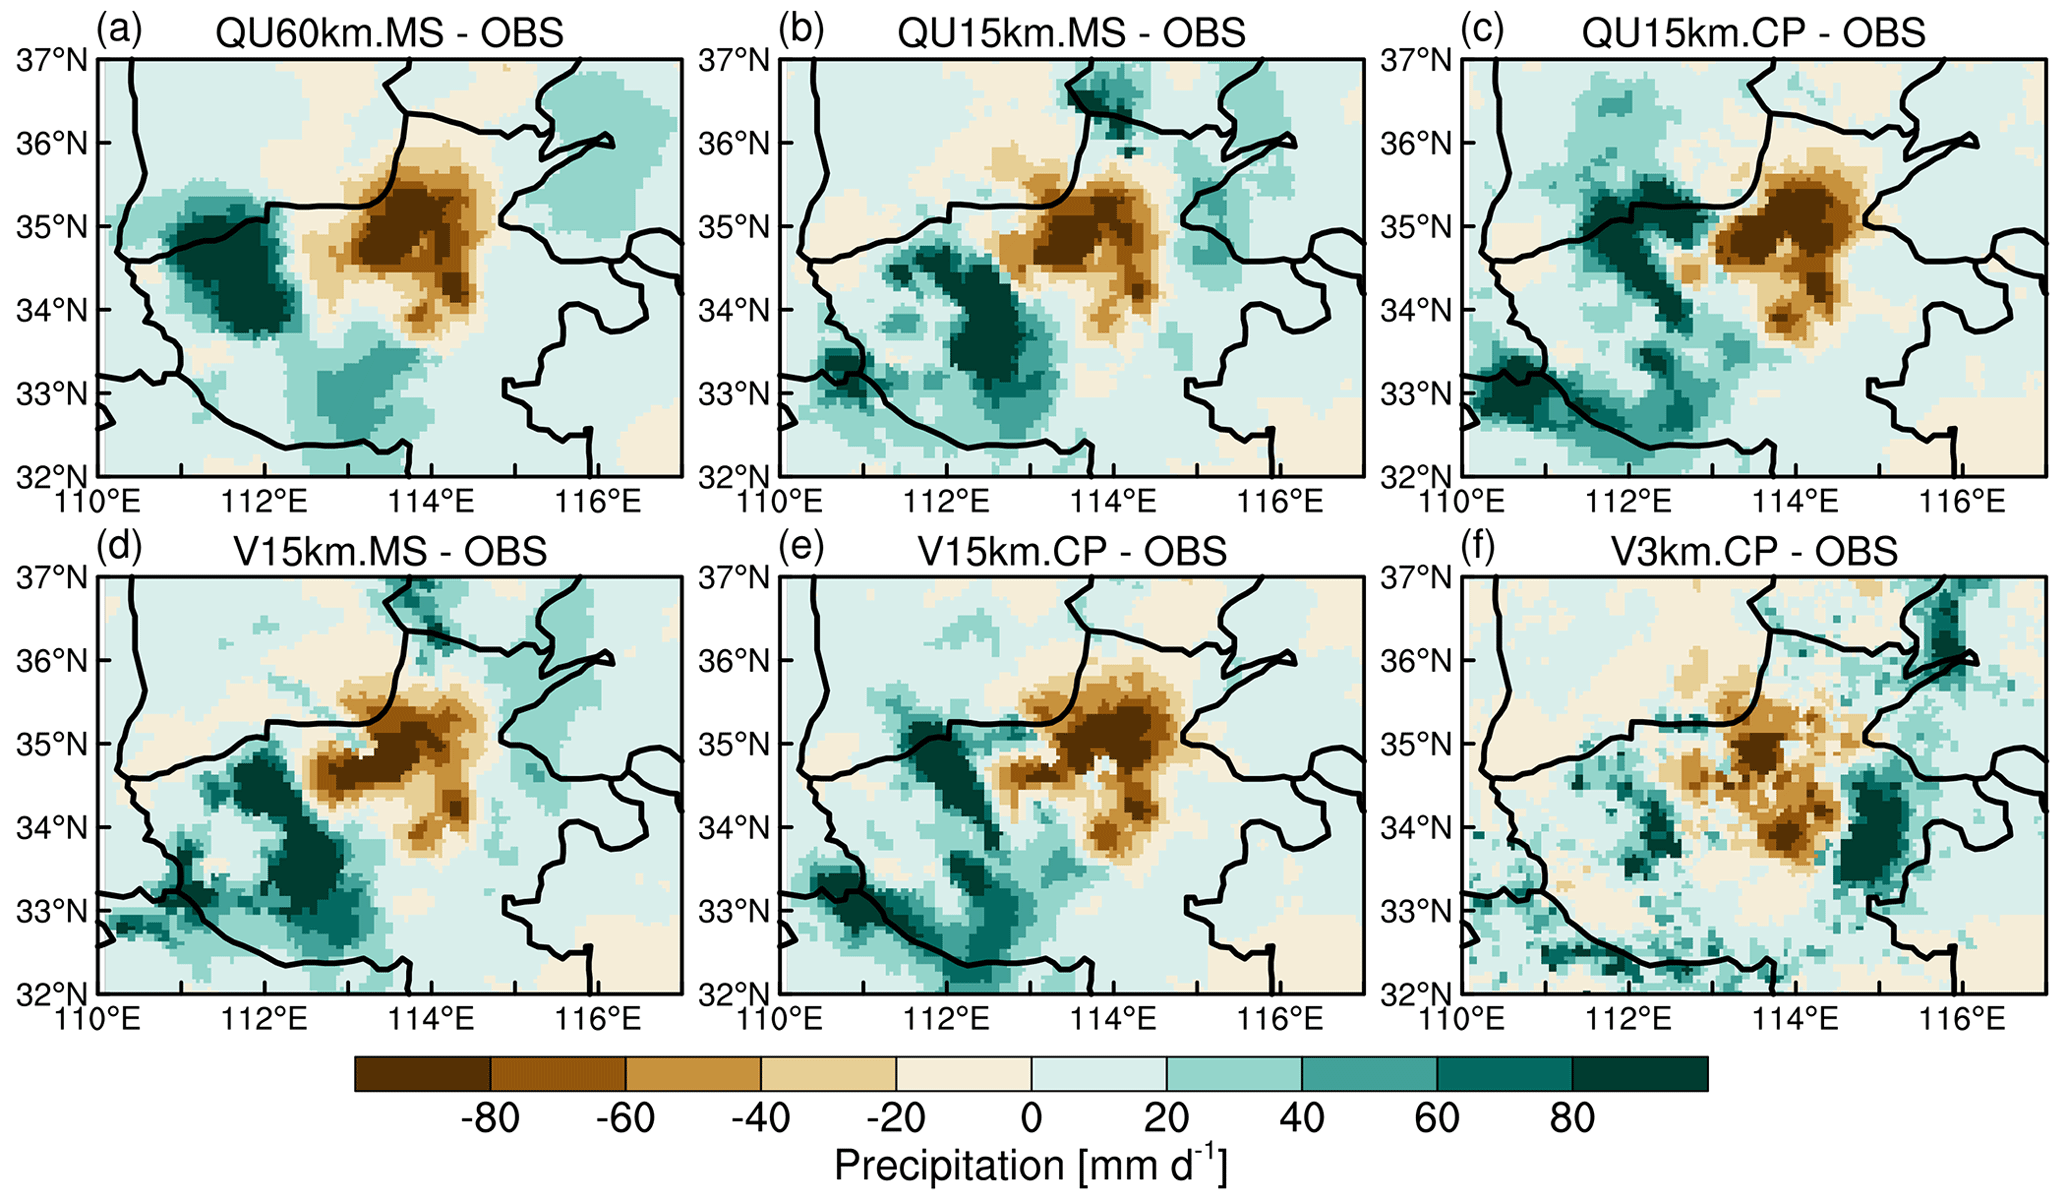
Figure 4The differences in precipitation between simulations and CMA stations from 20 July at 00:00 to 21 July at 00:00 UTC.
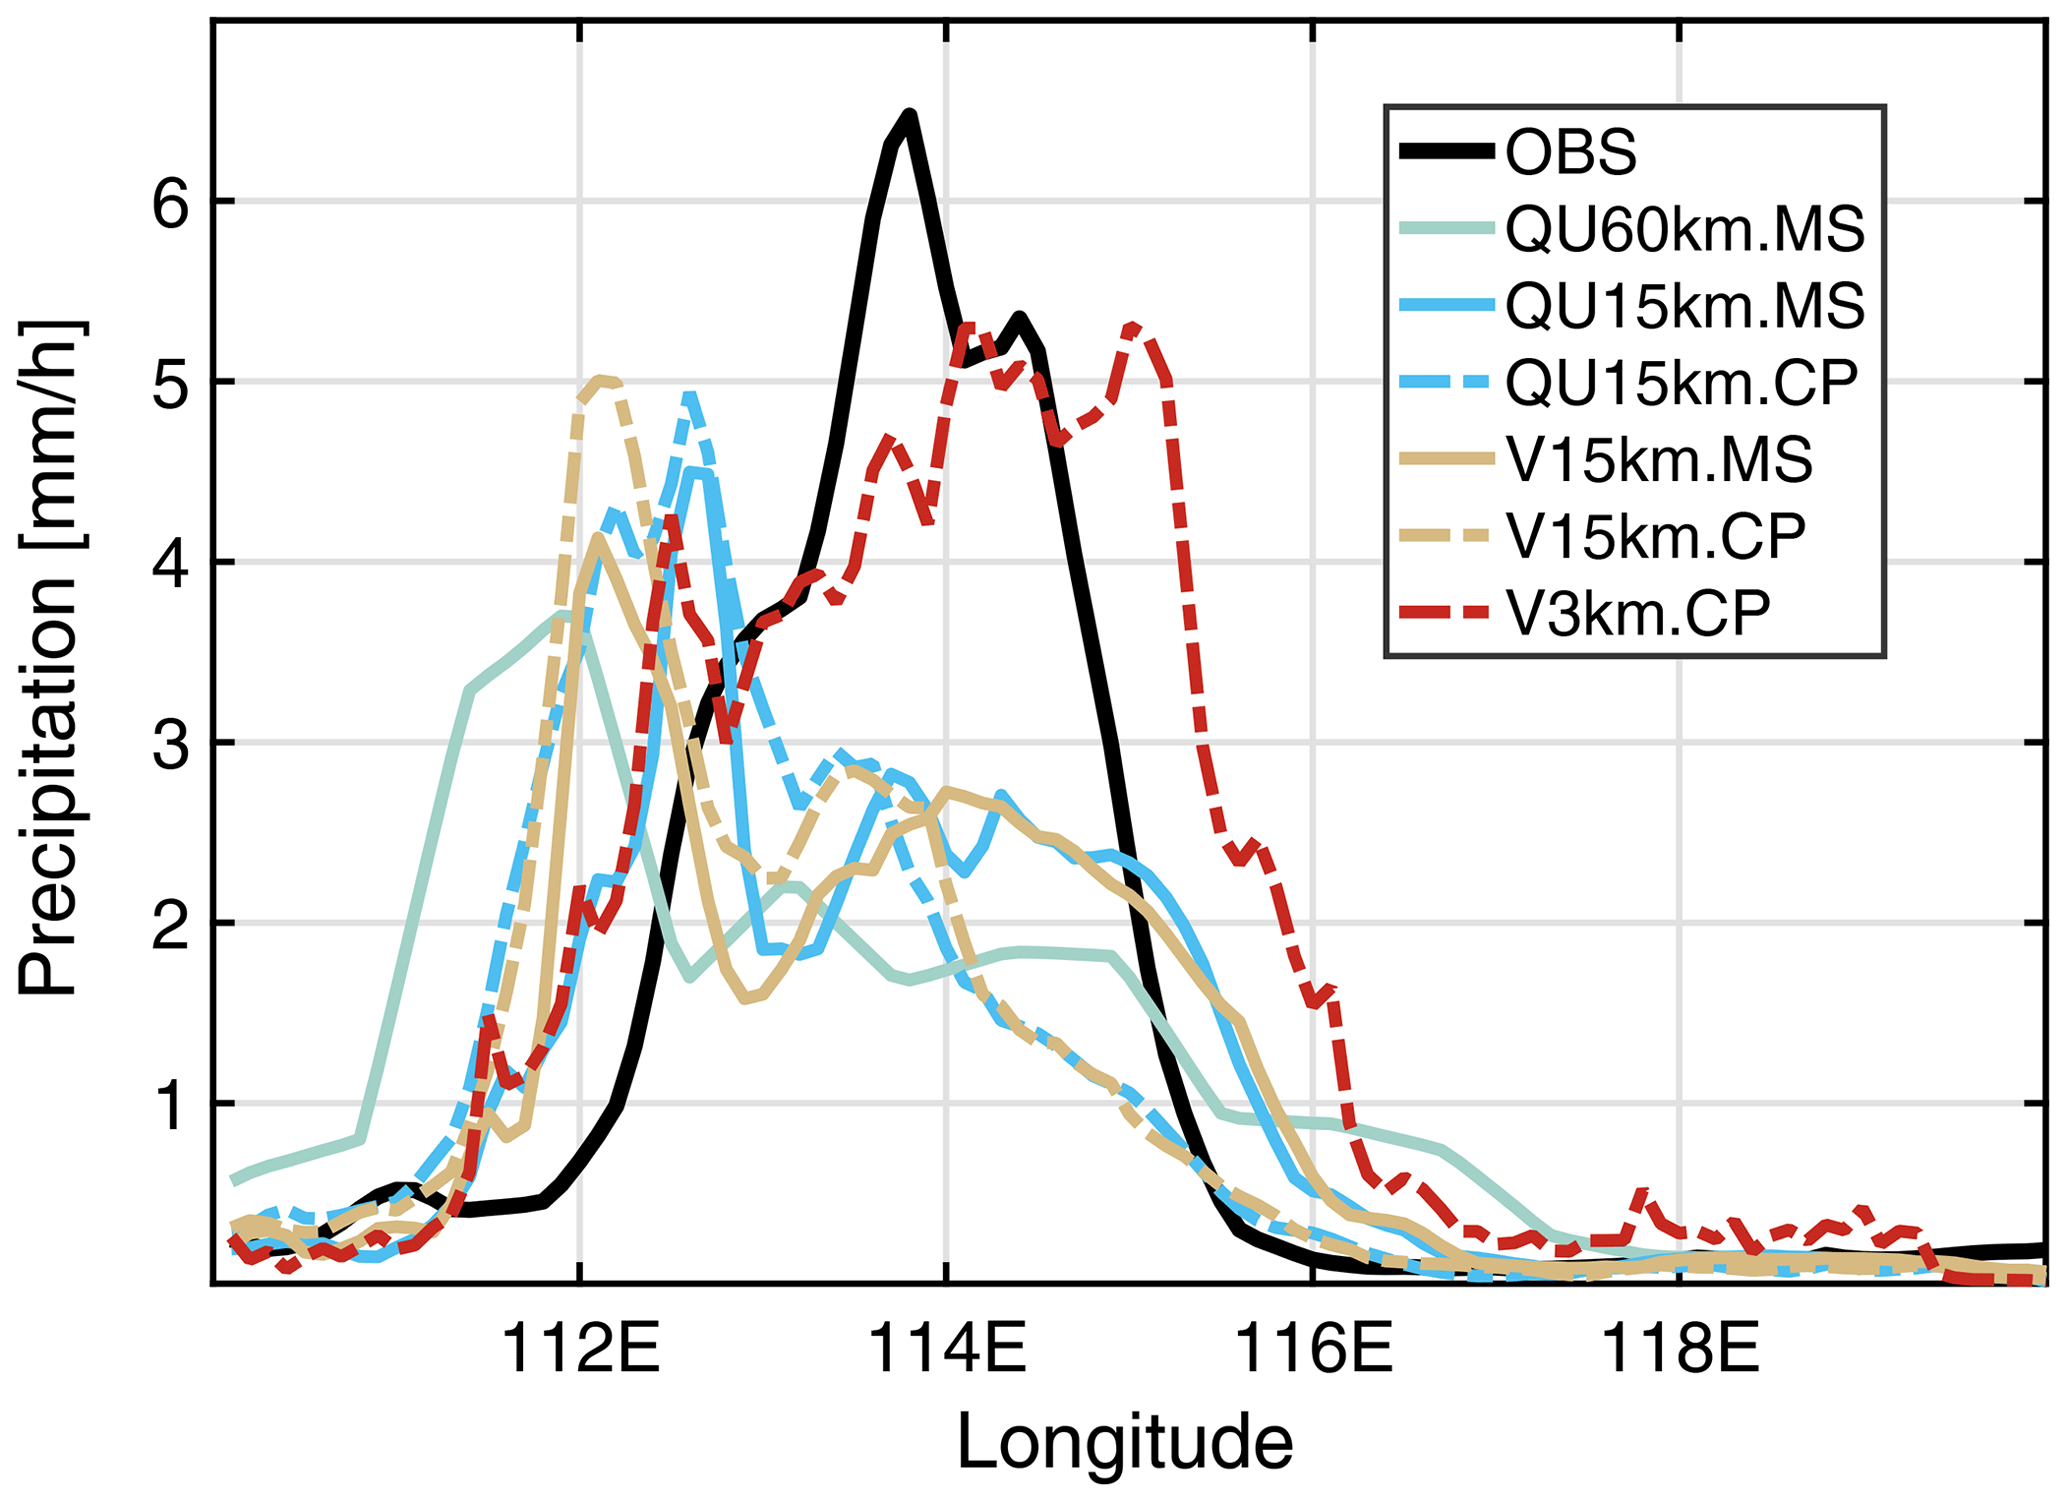
Figure 5Zonal distributions of precipitation averaged from 20 July at 00:00 to 21 July at 00:00 UTC over Henan (denoted as the red box in Fig. 2) for the CMA station observations and the simulations with resolutions of 60, 15, and 3 km.
To better illustrate the performance of simulations in terms of precipitation, Fig. 4 shows the differences between the simulations and observations averaged from 20 July at 00:00 to 21 July at 00:00 UTC. All simulations consistently underestimated the precipitation intensity near Zhengzhou and forecasted higher intensity in the western region of Henan incorrectly except for the V3km.CP simulation. It is worth noting that V3km.CP exhibited the least pronounced discrepancies from observations, with an underestimation of 40 mm d−1 near Zhengzhou. These discrepancies were also more dispersed compared to other simulations. The simulations of variable and uniform resolutions are generally consistent at the mesh of the same fine resolution. However, the variable-resolution approach can significantly reduce computing cost. The discrepancy of QU60km.MS from observation is the most pronounced among all simulations, which is consistent with the conclusion in Fig. 3.
In order to visually represent the change in observed and simulated precipitation intensity along longitude over the peak precipitation region, we calculated the zonal distributions of precipitation averaged over the red-box region in Fig. 2 from 20 July at 00:00 to 21 July at 00:00 UTC as show in Fig. 5. Consistent with the previous conclusion, the V3km.CP simulation outperforms all other experimental configurations with CC, RMSE, and MB being 0.86, 0.72, and +0.12, respectively. Regarding 15 km simulations, the variable-resolution simulation generally presents a peak precipitation slightly west of that simulated by the quasi-uniform simulation. Meanwhile, for both the 15 km variable-resolution simulation and 15 km quasi-uniform simulation, the CP parameterization suite surpasses the MS suite by presenting greater maximum precipitation close to observed values. Finally, the quasi-uniform 60 km simulation presents the least sufficient performance with an excessively low simulated precipitation peak value and incorrect zonal distribution. In summary, due to the outstanding resolution and matching parameterization scheme utilized, the V3km.CP exhibits the optimal forecasting skills. In contrast, the QU60km.MS shows the worst prediction performance. The utilization of the CP scheme in the simulations effectively captures the maximum values, given that the convection-permitting scheme suite is scale aware in that it can dynamically compute resolved and convective precipitation according to different resolutions in the variable-resolution mesh.
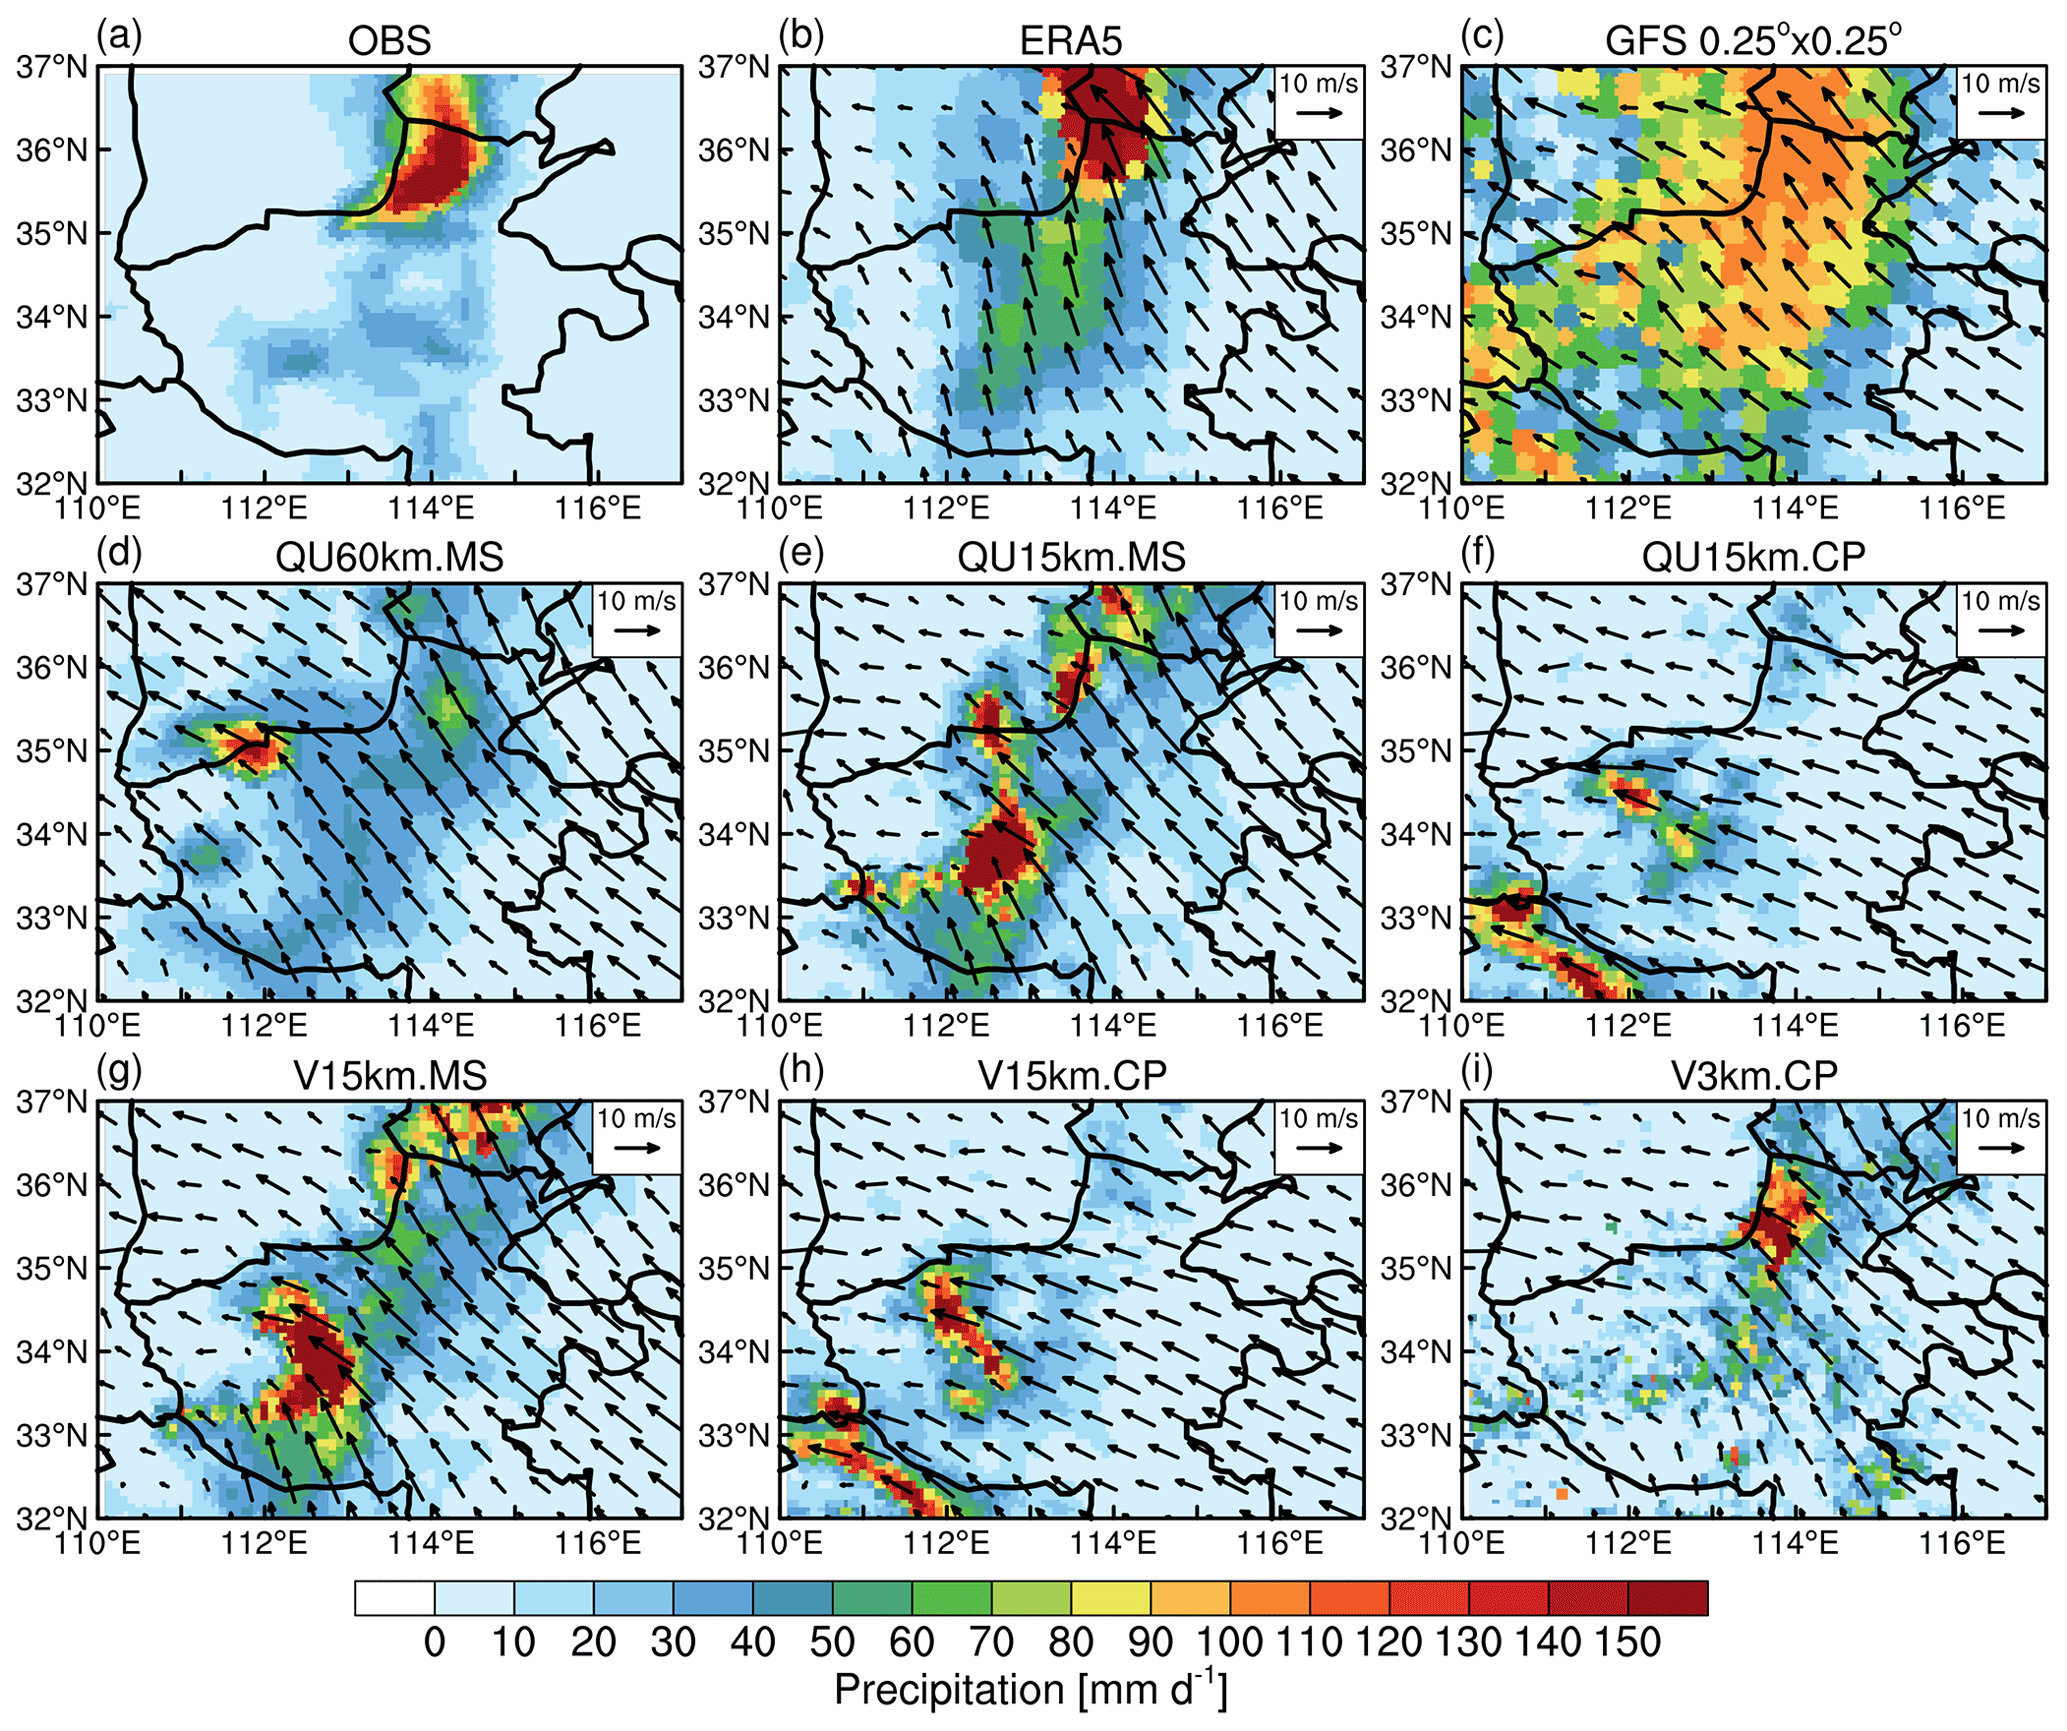
Figure 6Same as Fig. 3, except for the average from 21 July at 00:00 to 22 July at 00:00 UTC.
3.2 Second peak period
Figure 6 shows the precipitation and wind among observations, ERA5 reanalysis, GFS, and simulations, just the same as Fig. 3 except for the time period from 00:00 UTC on 21 July to 00:00 UTC on 22 July. During this 24 h period, the observed rainfall zone keeps moving northward and reaches northern Henan Province, indicated in Fig. 6a. Among all simulations, only V3km.CP correctly captures both the position and intensity of the precipitation, having the CC and RMSE of 0.62 and 12.23, respectively (Table 3). Generally, at 15 km hydrostatic-scale resolution, with the same parameterization scheme suite being selected, the variable-resolution simulation results resemble the 15 km quasi-uniform simulation results closely. Meanwhile, the two sets of parameterization suites, i.e., MS vs. CP, turn out to have different impacts upon the simulated precipitation at 15 km resolution. Specifically, the MS parameterization suite tends to give rise to two locations of simulated peak precipitation; i.e., one is over northern Henan Province, just nearly identical to the observation. The other is over southwest Henan Province with even greater precipitation intensity. As for the CP parameterization suite, there is nearly no precipitation simulated over northern Henan Province. Instead, the simulated two precipitation bands are spread out over southwest Henan Province. In this sense, the MS suite seems superior to CP for this 24 h simulation period at 15 km resolution. This is reflected in Fig. 7 as well. As for the simulated 850 mb wind field, among all simulation experiments, the V3km.CP experiment exhibits a closer resemblance to ERA5. Nevertheless, the performance of model simulations for this 24 h period is generally inferior to that of the first 24 h period. Table 4 reveals that, at 15 km resolution of both quasi-uniform and variable-resolution meshes, the simulated 850 mb wind with the MS suite outperforms the CP suite. This discrepancy is one of the contributing factors leading to the subpar performance of the CP scheme in this 24 h precipitation simulation. It is very likely that the simulated wind field from MS and CP parameterization suites plays a key role in governing the location of the simulated peak precipitation. Namely, the MS suite generates prevailing 850 mb southeasterly wind which tends to maintain the peak precipitation region over north Henan Province while shifting another peak precipitation region to southwest Henan Province. As for the CP suite, it seems to favor 850 mb easterly wind generation over Henan Province such that the simulated peak precipitation region tends to shift further west and no peak precipitation is reproduced over north Henan Province. The in-depth analysis upon the source of this simulation bias will be elaborated in the following paragraphs. Once again, it is confirmed that the simulated low-level wind field plays a vital role in the peak precipitation simulations, in terms of both precipitation intensity and location.
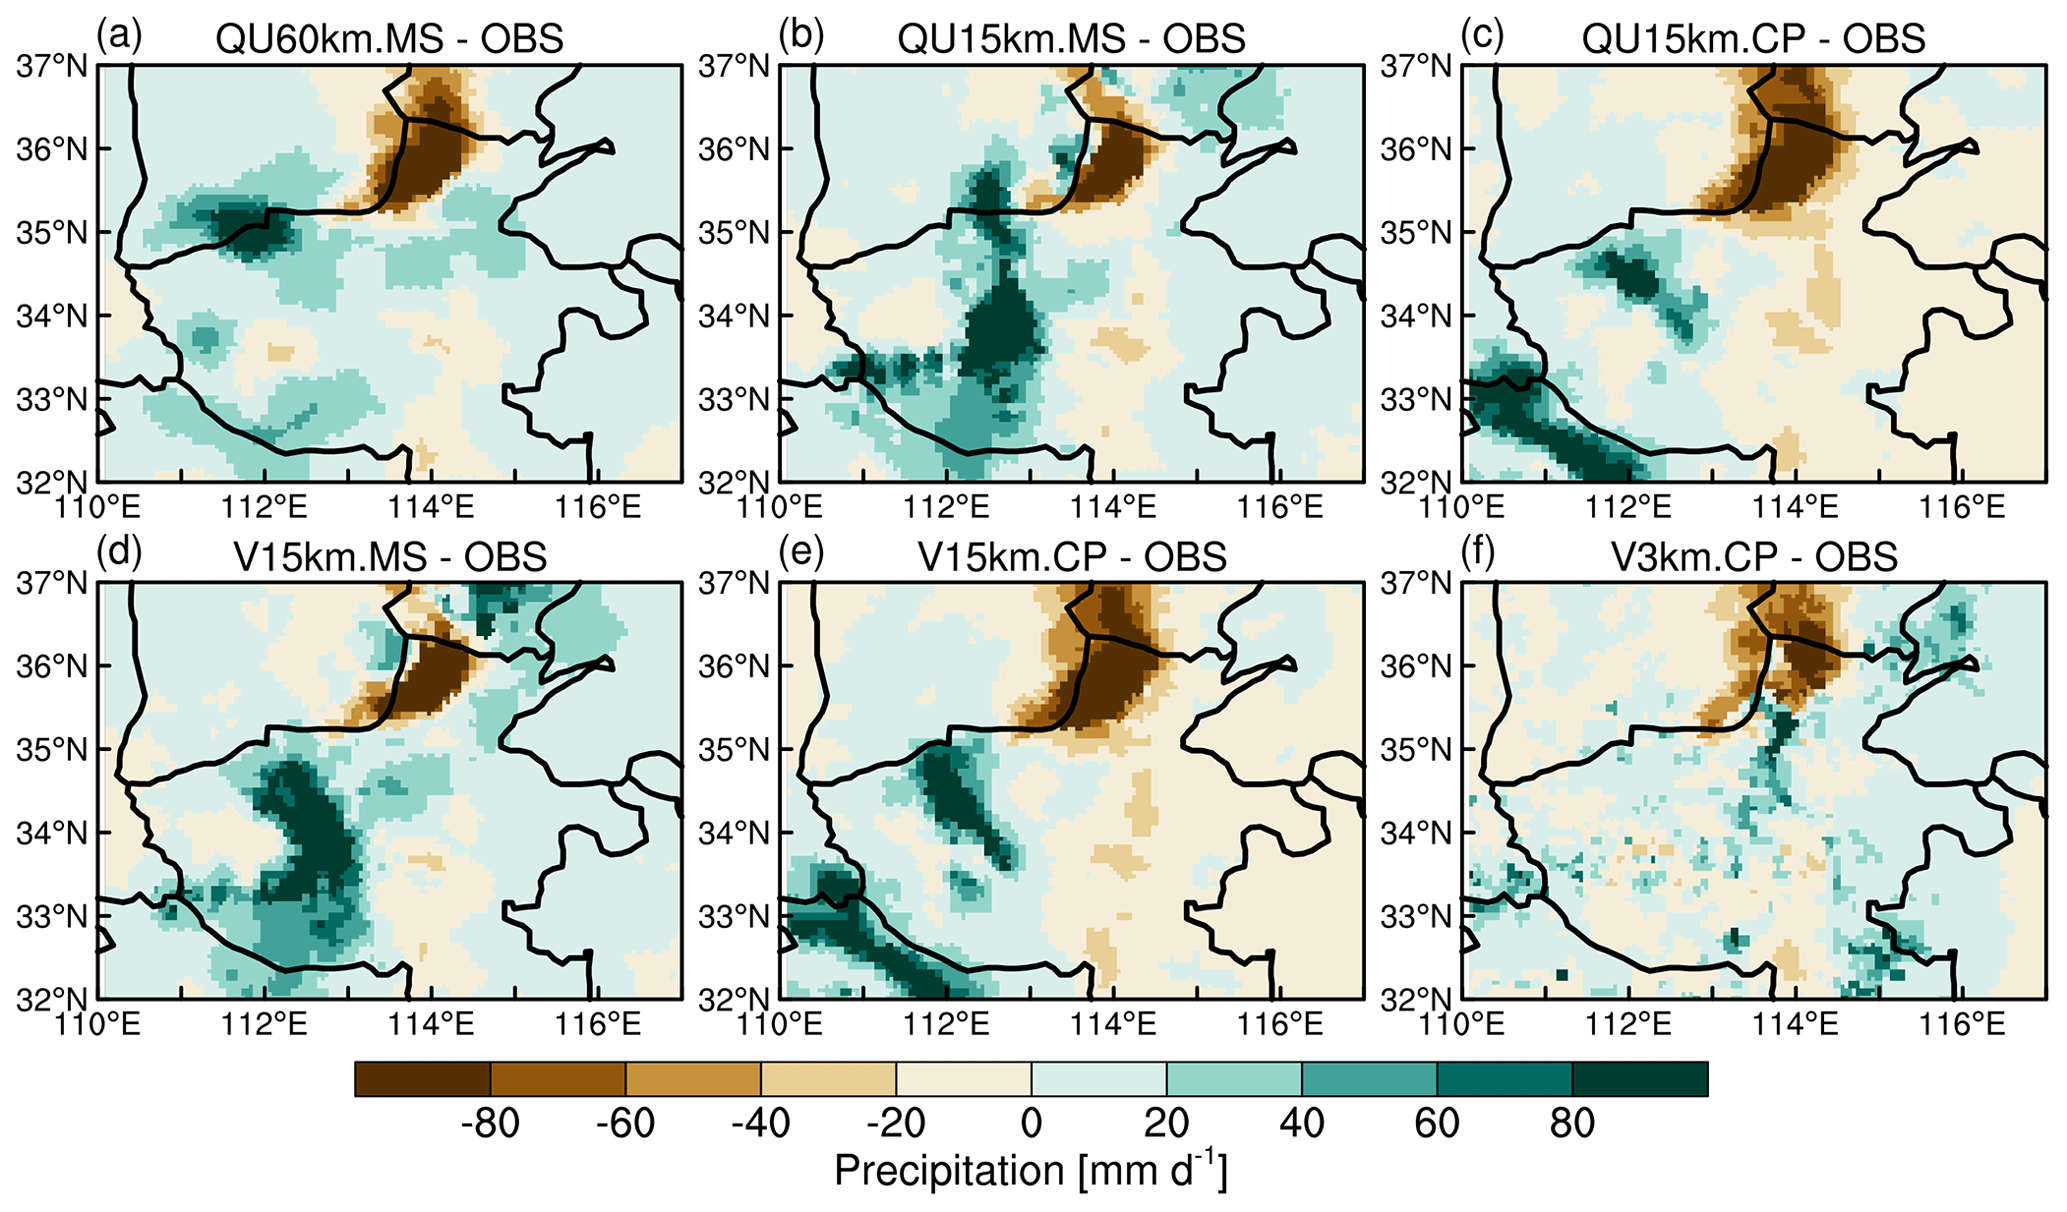
Figure 7Same as Fig. 4, except for the average from 21 July at 00:00 to 22 July at 00:00 UTC.
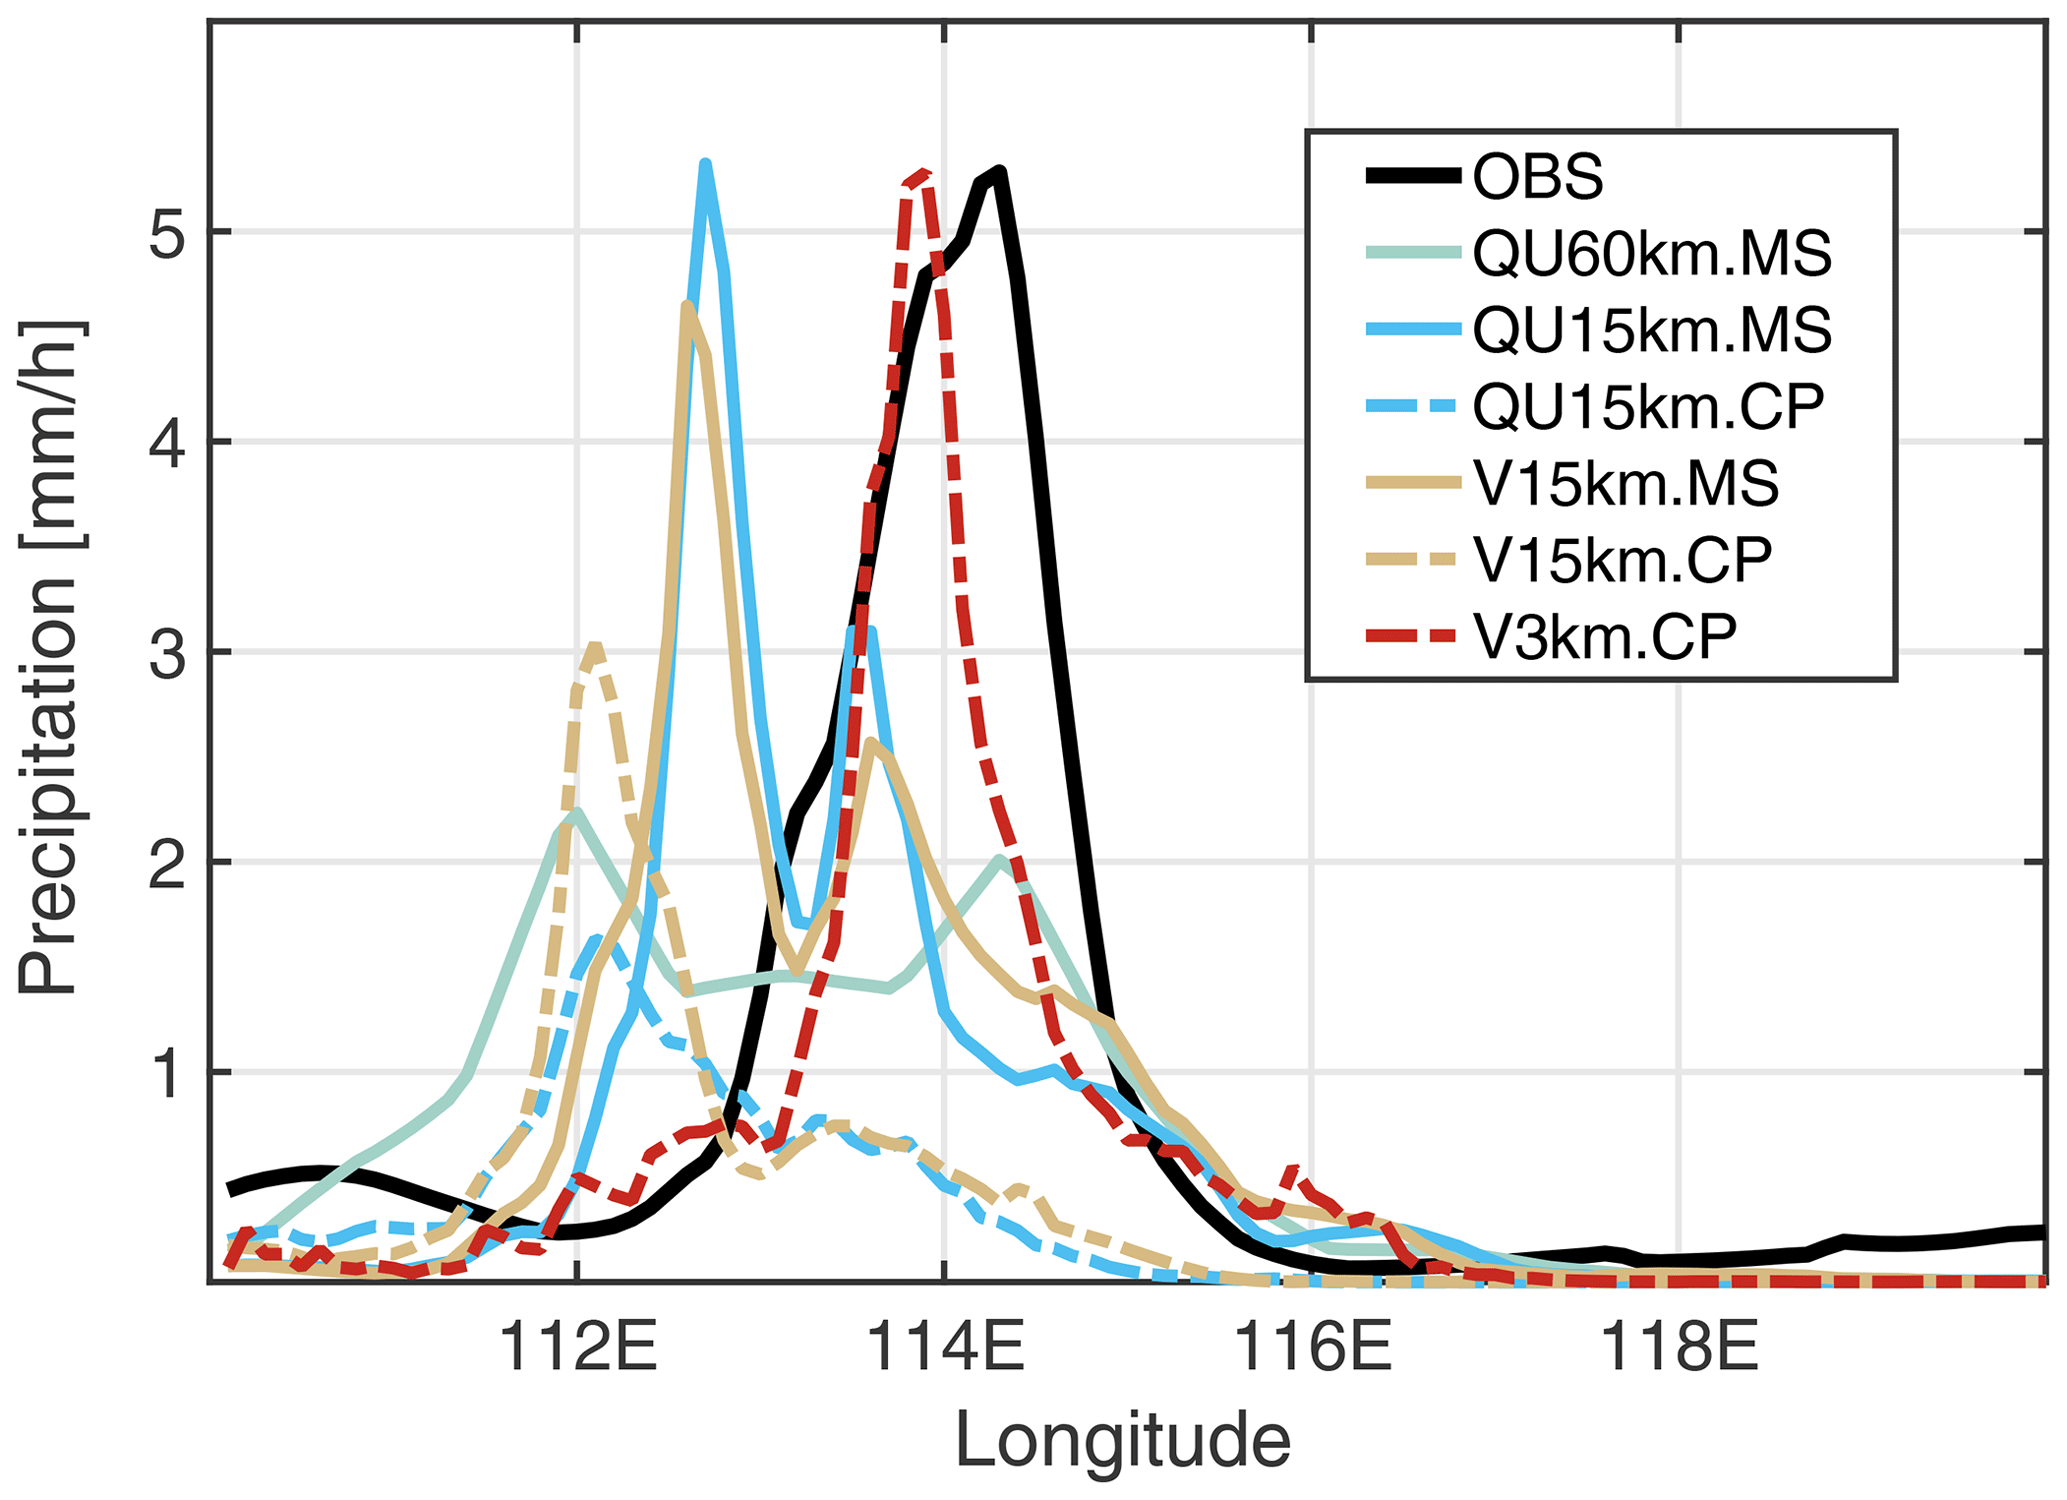
Figure 8Same as Fig. 5, except for the average from 21 July at 00:00 to 22 July at 00:00 UTC.
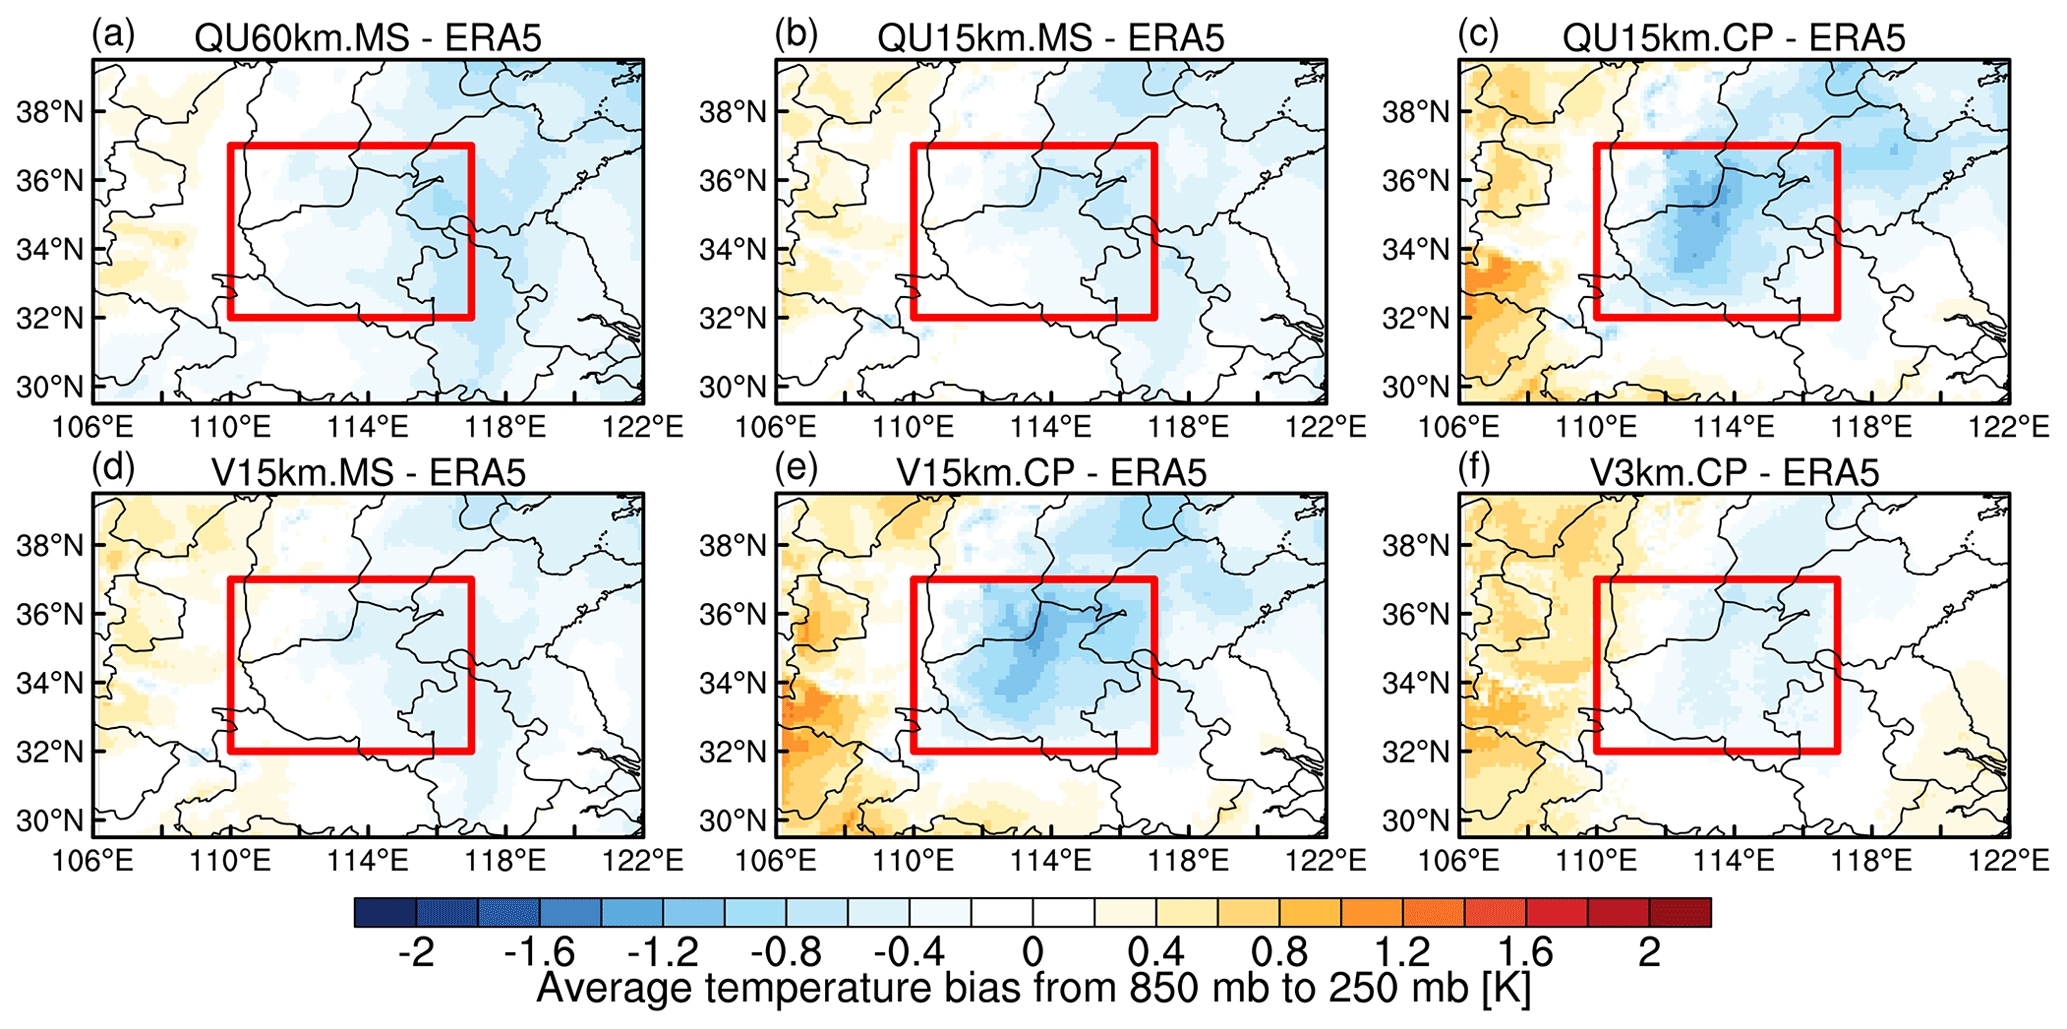
Figure 9The differences in vertically averaged temperature from 850 to 250 mb between simulations and ERA5 from 21 July at 00:00 to 22 July at 00:00 UTC.
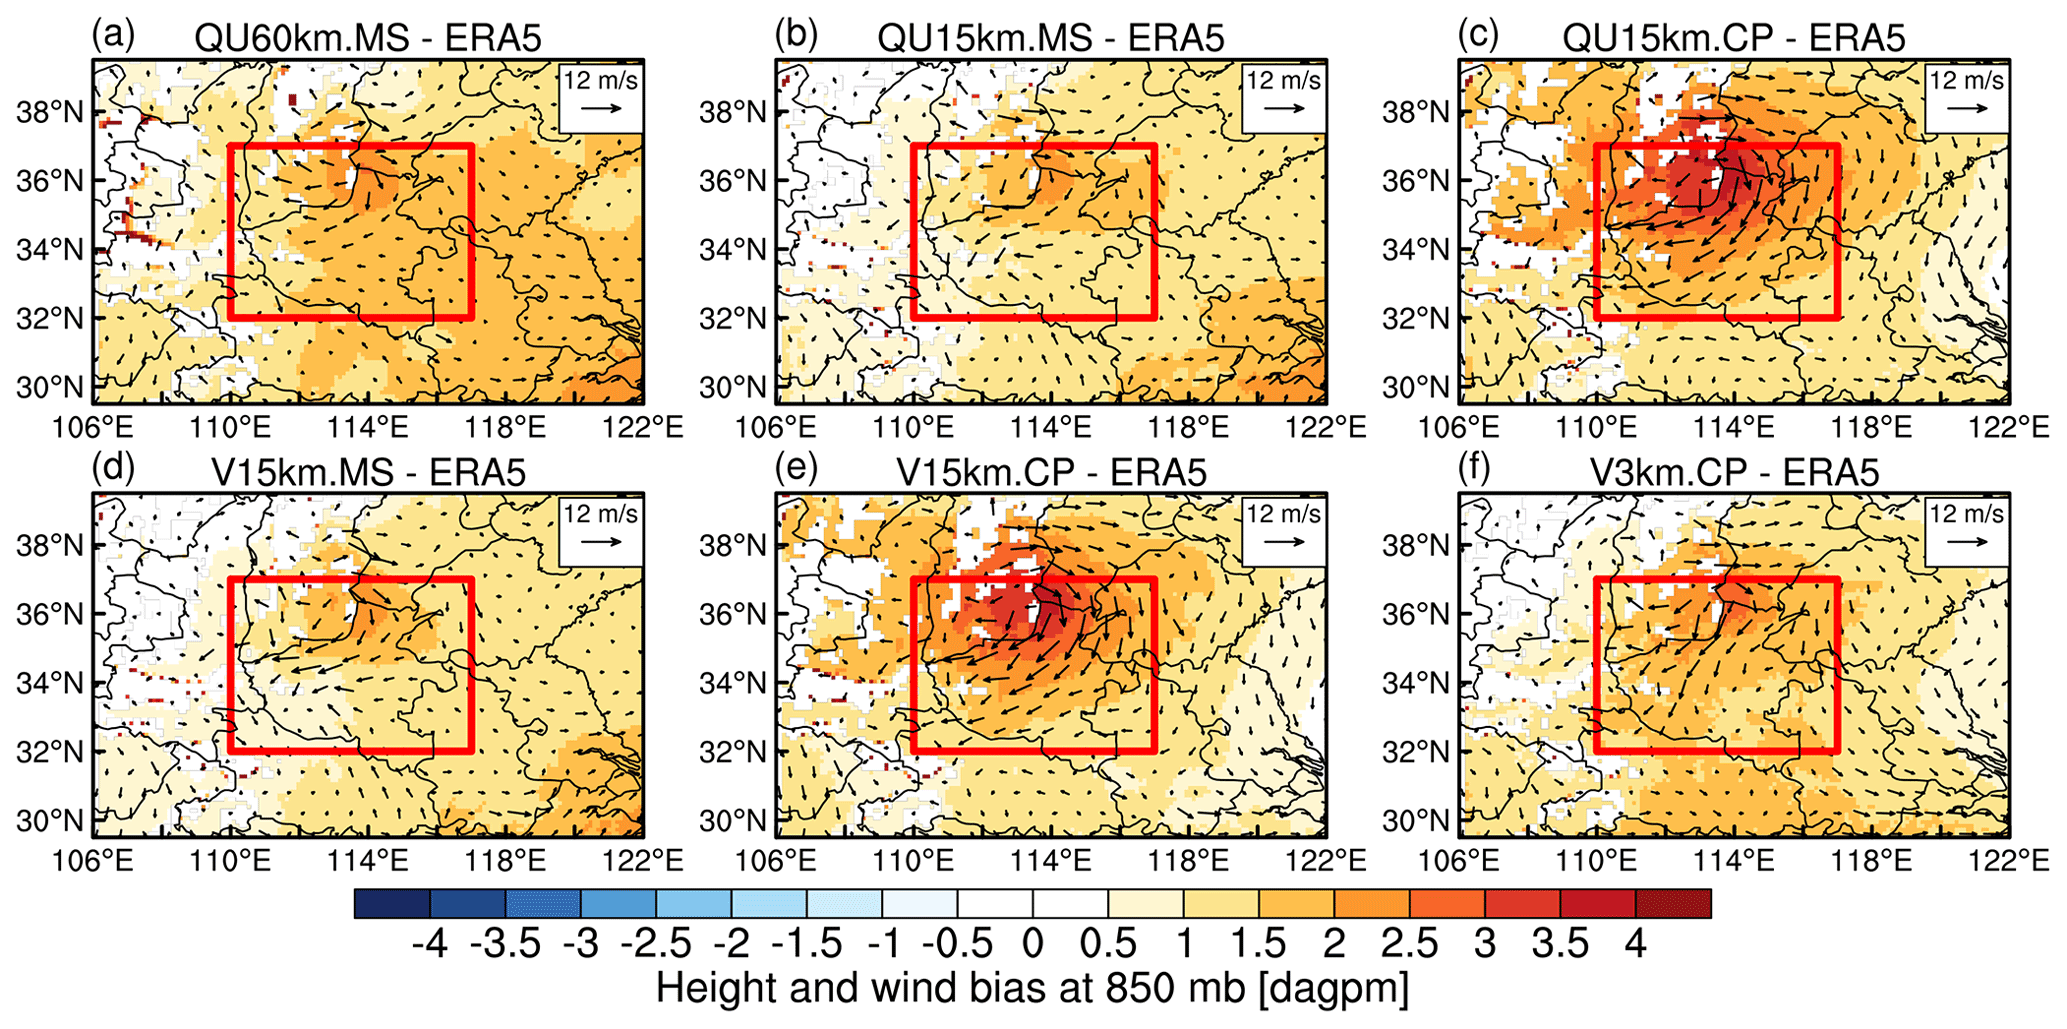
Figure 10The differences in geopotential height and wind at 850 mb between simulations and ERA5 from 21 July at 00:00 to 22 July at 00:00 UTC.
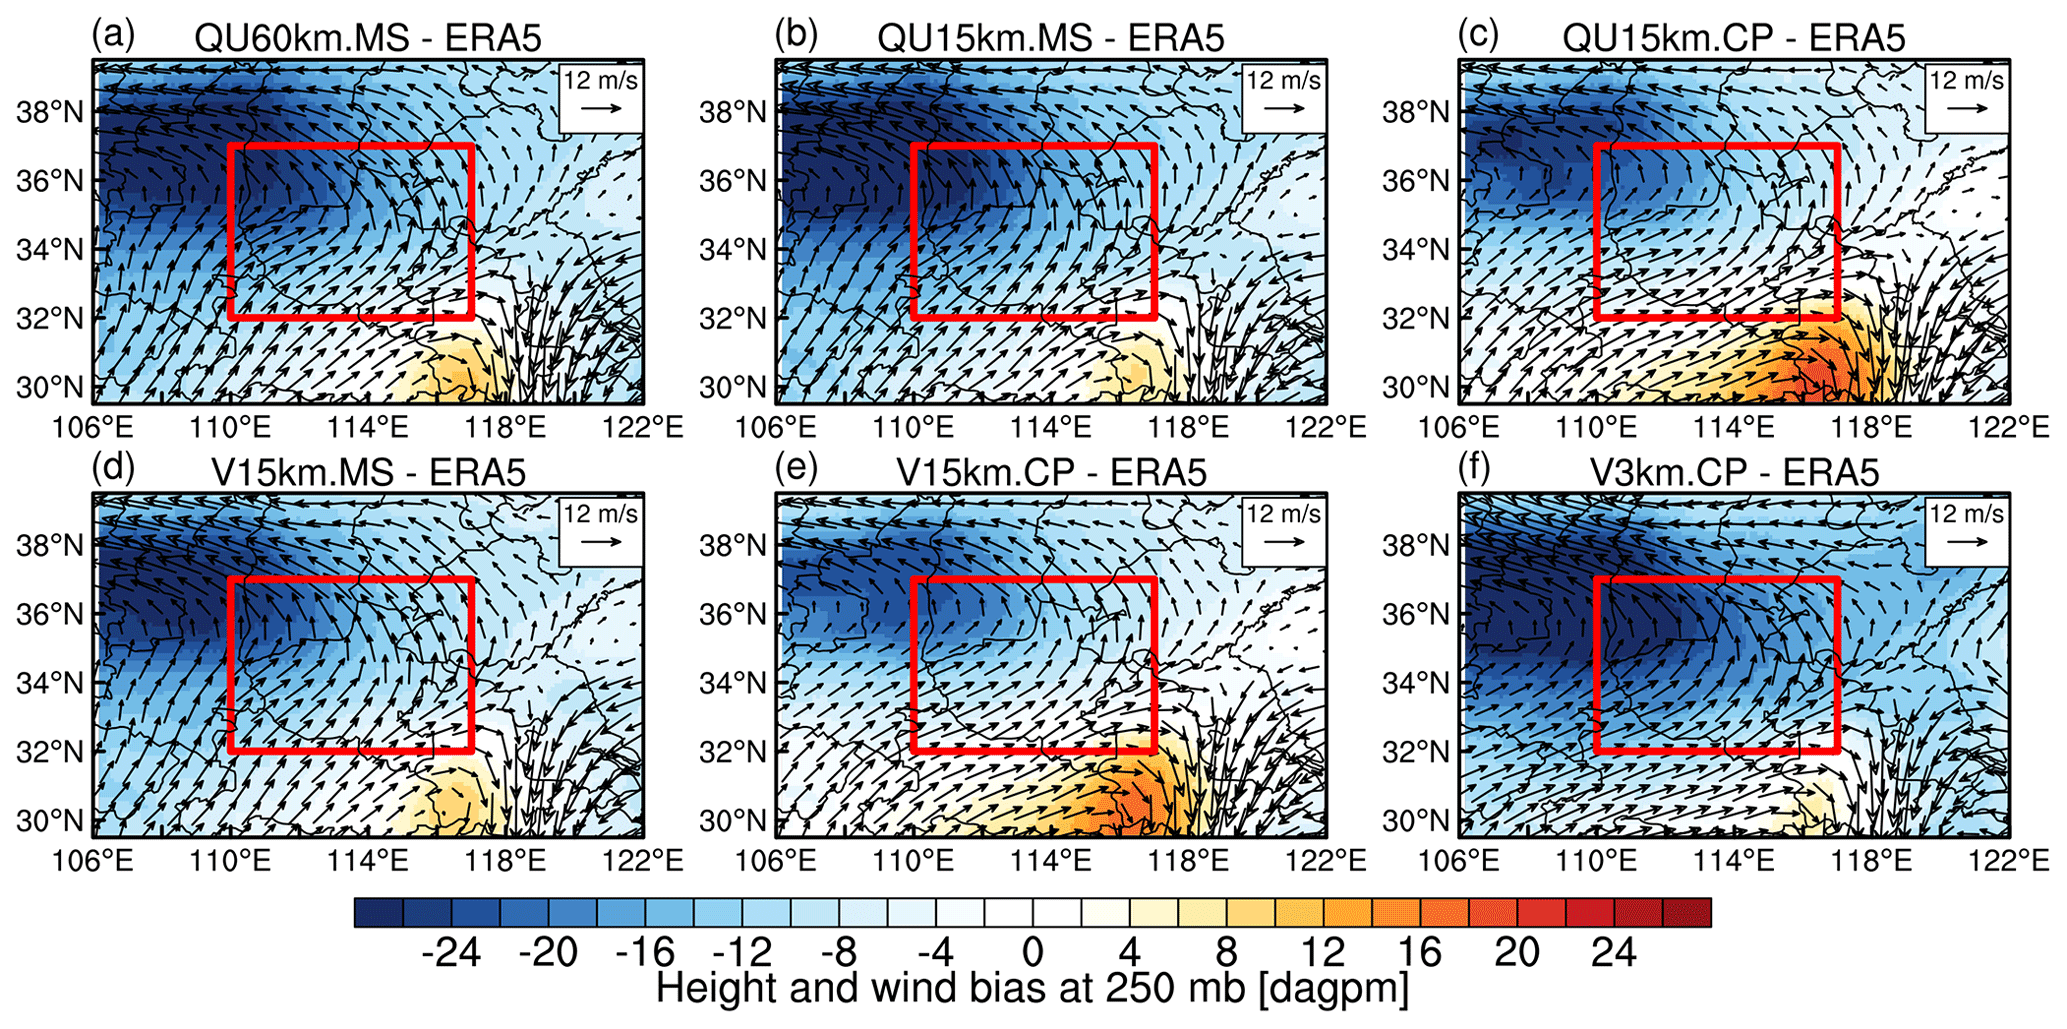
Figure 11The differences in geopotential height and wind at 250 mb between simulations and ERA5 from 21 July at 00:00 to 22 July at 00:00 UTC.
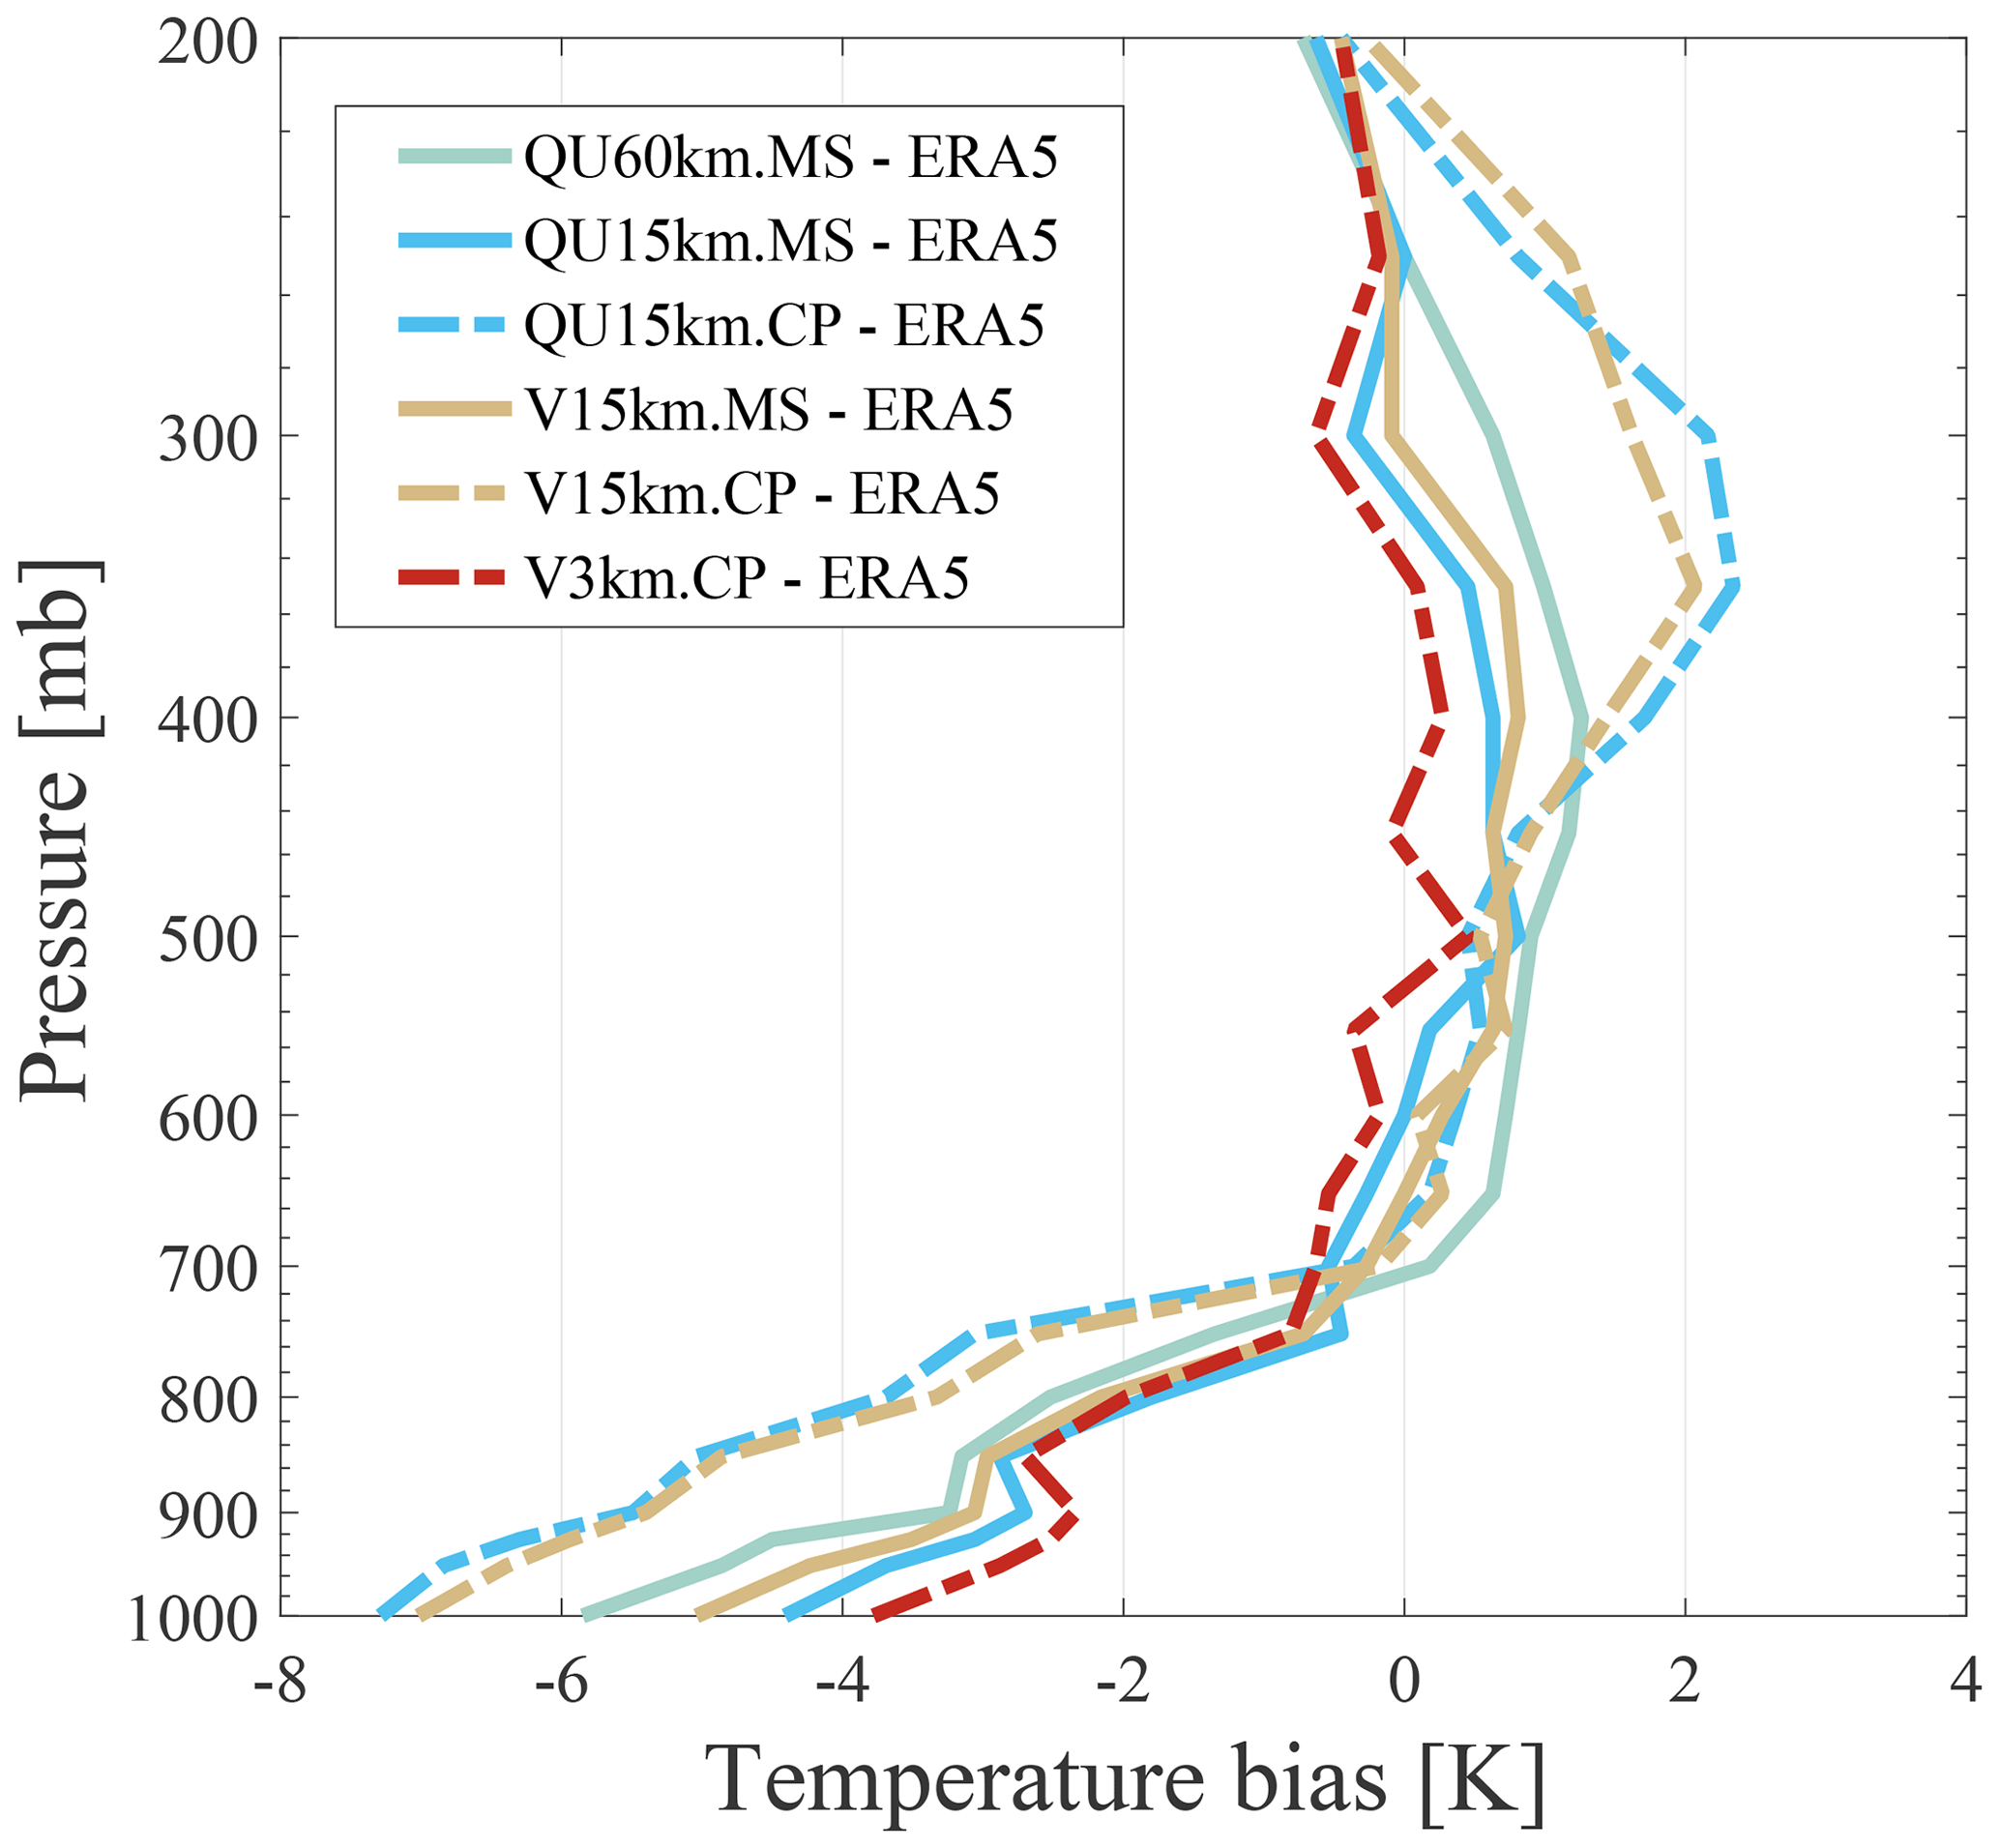
Figure 12Vertical profiles of the averaged temperature differences between the simulation and ERA5 from 21 July at 00:00 to 22 July at 00:00 UTC. The averaged areas are denoted as the red boxes in Fig. 2.
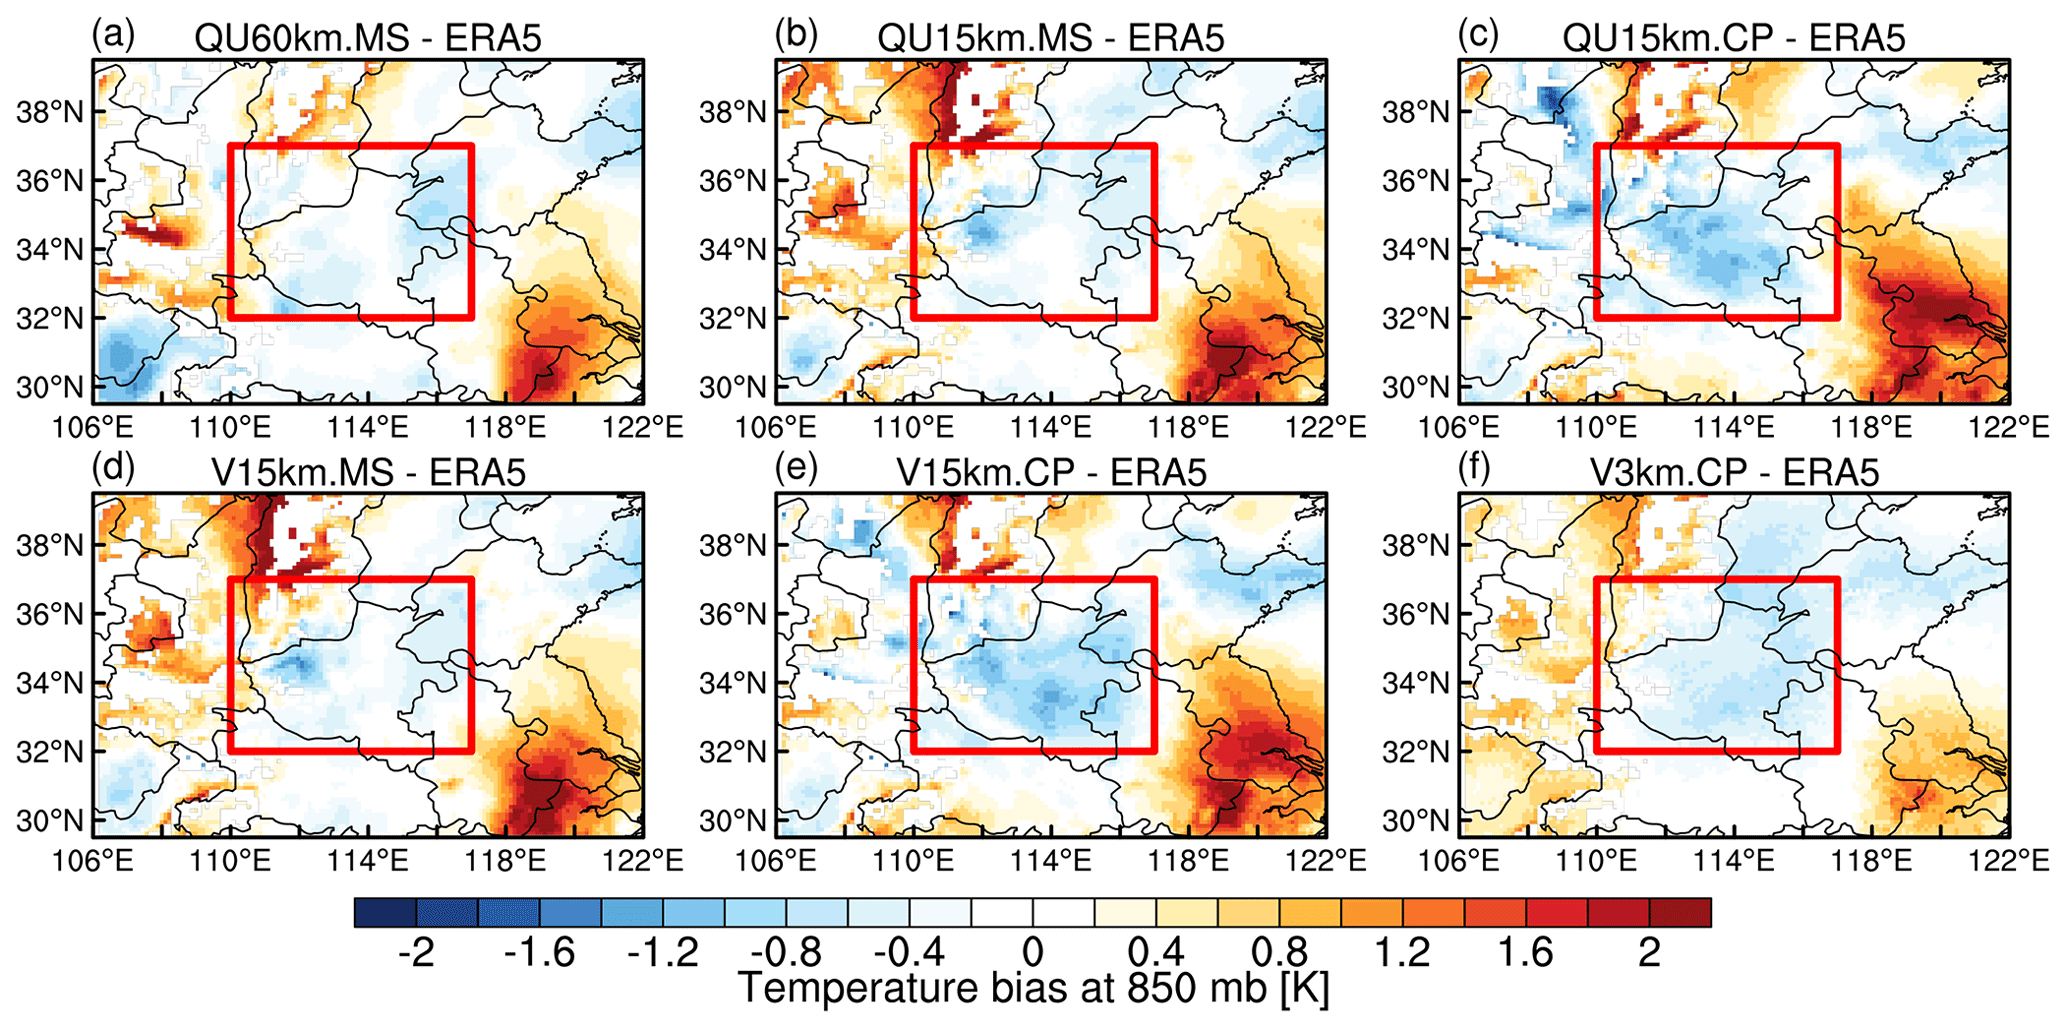
Figure 13The differences in temperature at 850 mb between simulations and ERA5 from 21 July at 00:00 to 22 July at 00:00 UTC.
The contents presented in Fig. 8 are consistent with those in Fig. 5 but represent the hourly average precipitation from 21 July at 00:00 to 22 July at 00:00 UTC. The observation indicates a weakening of the precipitation peak during this period (5 mm h−1), with the maximum precipitation value slightly shifting eastward to 114° E. Once again, for simulations at 15 km resolution, regardless of variable-resolution or quasi-uniform mesh, it is found that the MS parameterization scheme suite outperforms the CP scheme suite in terms of precipitation intensity simulation with the CP scheme suite predicting a precipitation intensity (3 mm h−1) far below the observed value (above 5 mm h−1). This is consistent with what Fig. 6 depicts. As for 3 km resolution, the variable-resolution simulation with the CP parameterization scheme suite achieves the supreme performance, accompanied by a pattern correlation coefficient with observations being 0.89.
In order to figure out why the simulation at 15 km with the CP suite tends to produce an easterly wind component anomaly relative to the MS suite during this 24 h period, we did further analysis to pursue the possible source error. Figure 9 shows the 850–250 mb vertically averaged temperature anomaly from ERA5, and it clearly shows that simulations with the CP suite generate a greater cooling anomaly (Fig. 9c and e) relative to the MS suite (Fig. 9a, b, and d). This cooling anomaly results in an intensified thickness shrinking within the 850–250 mb air column for the simulations with the CP suite, which in turn leads to a local rise in the lower-tropospheric geopotential height, as shown in Fig. 10c and e. This local increase in geopotential height corresponds to an anticyclonic circulation anomaly which gives rise to an easterly wind anomaly for simulations with the CP suite relative to the MS suite.
Furthermore, Fig. 11 presents the geopotential height and wind anomaly changes over the upper troposphere in response to the 850–250 mb vertically averaged air column cooling effect. The evident 250 mb southwesterly anomaly flow over the outlined region is coincident with the cool–warm temperature gradient along the northwest–southeast diagonal (Fig. 13c and e), based on the thermal wind balance. In addition, it is observed that a local drop of 250 mb geopotential height is dominant over the outlined region for all simulations, where simulations at 15 km resolution with the CP suite generate a smaller magnitude of geopotential height drop relative to the MS suite. This can be attributed to the enhanced warming within the upper troposphere for simulations with the CP suite, as depicted in Fig. 12. In other words, given the anomalous cooling effect within the 850–250 mb air column for simulations with the CP suite, the geopotential height at the top layer would drop due to the reduced air column thickness; however, at the same time the upper-level warming anomaly within the air column would offset this height drop such that the overall drop of 250 mb geopotential height would decrease in magnitude. Figure 12 clearly demonstrates that for simulations with the CP suite at 15 km resolution there is an amplified cooling in the lower troposphere, whereas there is an enhanced warming in the upper troposphere. This is very likely due to simulation bias of condensational warming in the upper troposphere and evaporational cooling in the lower troposphere. Further investigation of this diabatic heat bias will be presented in the coming section.
4.1 Convective precipitation and grid-scale precipitation
The moist processes and precipitation can be classified as implicitly represented using convective parameterization schemes (convective rain) or explicitly simulated using cloud microphysics parameterization schemes (grid-scale rain) (Fowler et al., 2016). The adaptability of mass-flux-based convective parameterization to function effectively across scales is illustrated by Arakawa and Wu (2013) through reducing the convective vertical eddy transport in proportion to the horizontal fraction of the grid box. Arakawa and Wu (2013) calculate the vertical eddy transport as
where ω is the vertical velocity, σ is the convective updraft fraction, and denotes the vertical eddy transport in the context of full quasi-equilibrium adjustment. Fowler et al. (2016) calculates the σ as
where A represents the grid box area, and ε is an initial fractional entrainment rate pre-defined as m−1. In QU60km and QU15km simulations, the calculation of σ is carried out using Eq. (2), resulting in values of 0.01 and 0.11, respectively. In V3km simulations, the value of σ transitions from 0.7 to 0 smoothly as the grid distance continually increases, whereas in the V15km simulation, σ transitions from 0.11 to 0 as mesh resolutions changes from 15 to 60 km (Fowler et al., 2016). For cloud microphysics schemes, as mentioned above, the WSM6 scheme in the MS scheme suite and Thompson scheme in the CP scheme suite are both bulk microphysical parameterizations and include water vapor, cloud water, rain, cloud ice, snow, and graupel.
Due to the exponential decay parameter, the Thompson scheme permits an increase in fall speed as resolution increases. To demonstrate the scale-aware performance of the GF convective parameterization across various resolutions, which is embedded in the convection-permitting physics suite, we evaluate the performance of GF using quasi-uniform and variable-resolution meshes, which vary from hydrostatic (60 km) to nonhydrostatic (3 km) scales. Figure 14 shows the spatial distribution of convective (upper four panels), resolved (medium four panels), and total (lower four panels) precipitation simulated by MPAS, averaged from 20 July at 00:00 to 22 July at 00:00 UTC. At the mesh resolution of 60 km, in the QU60km.MS simulation, the spatial distribution of total precipitation is mainly influenced by convective rain, whereas the spatial maximum of precipitation is influenced by grid-scale rain. In contrast, at the mesh resolution of 3 km, both the spatial distribution of total precipitation and the extreme precipitation are primarily influenced by grid-scale rain, with the impact of convective rain being negligible. Since the scale-aware GF convection scheme performs as a conventional deep convective scheme over the coarse region and as a shallow convective scheme over the refined region with the increasing mesh resolution, the grid-scale precipitation becomes dominant in the total precipitation relative to the convective precipitation.
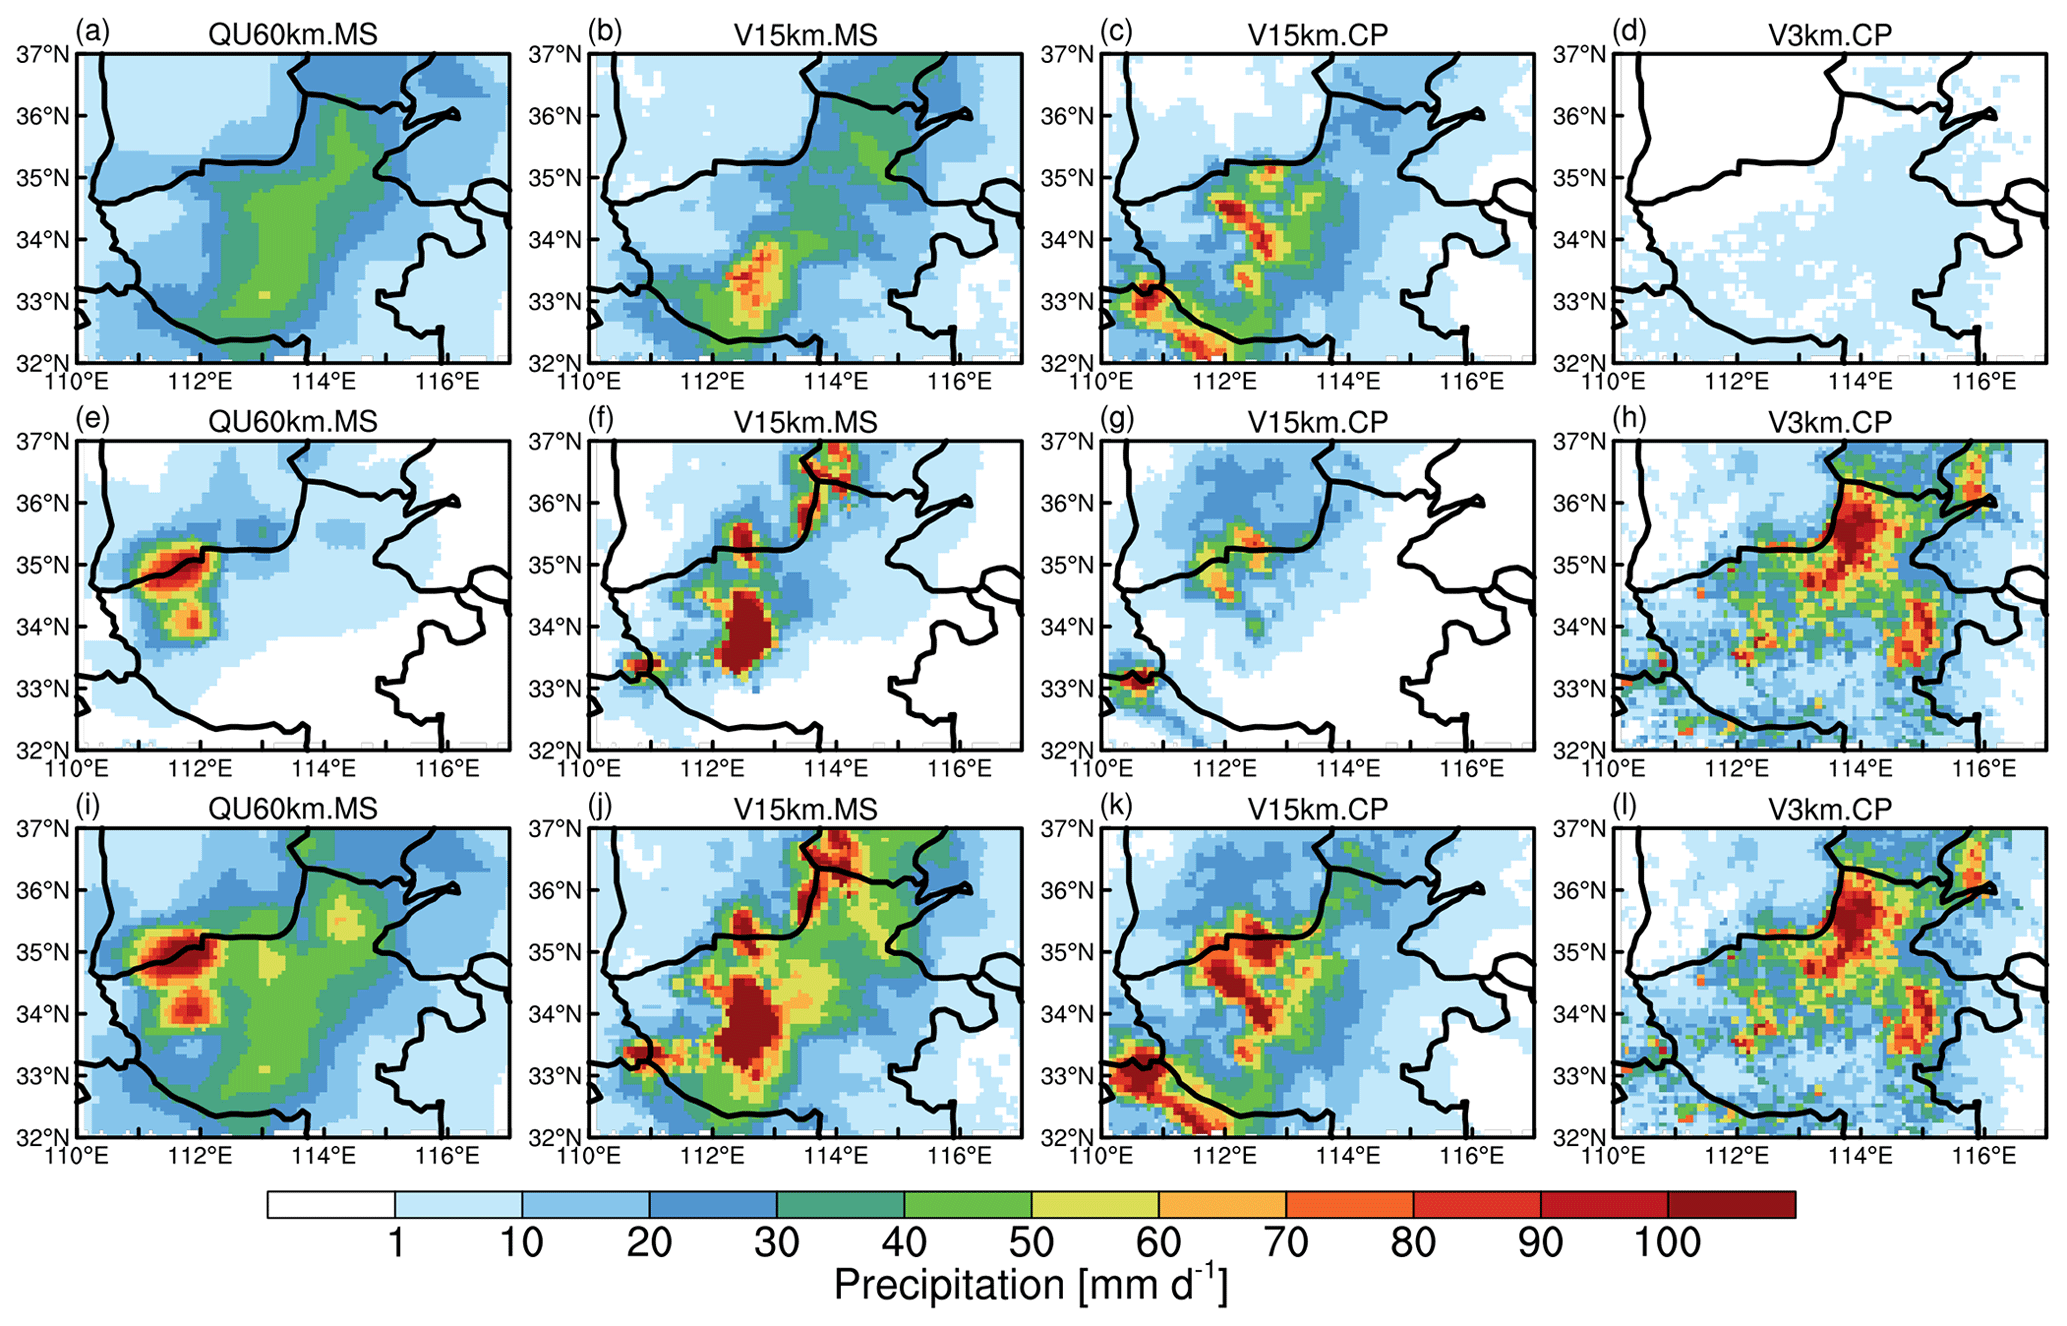
Figure 14Spatial distribution of convective (a–d), grid-scale (e–h), and total (i–l) precipitation averaged from 20 July at 00:00 to 22 July at 00:00 UTC over Henan Province from the simulations with resolutions of 60, 15, and 3 km, respectively.
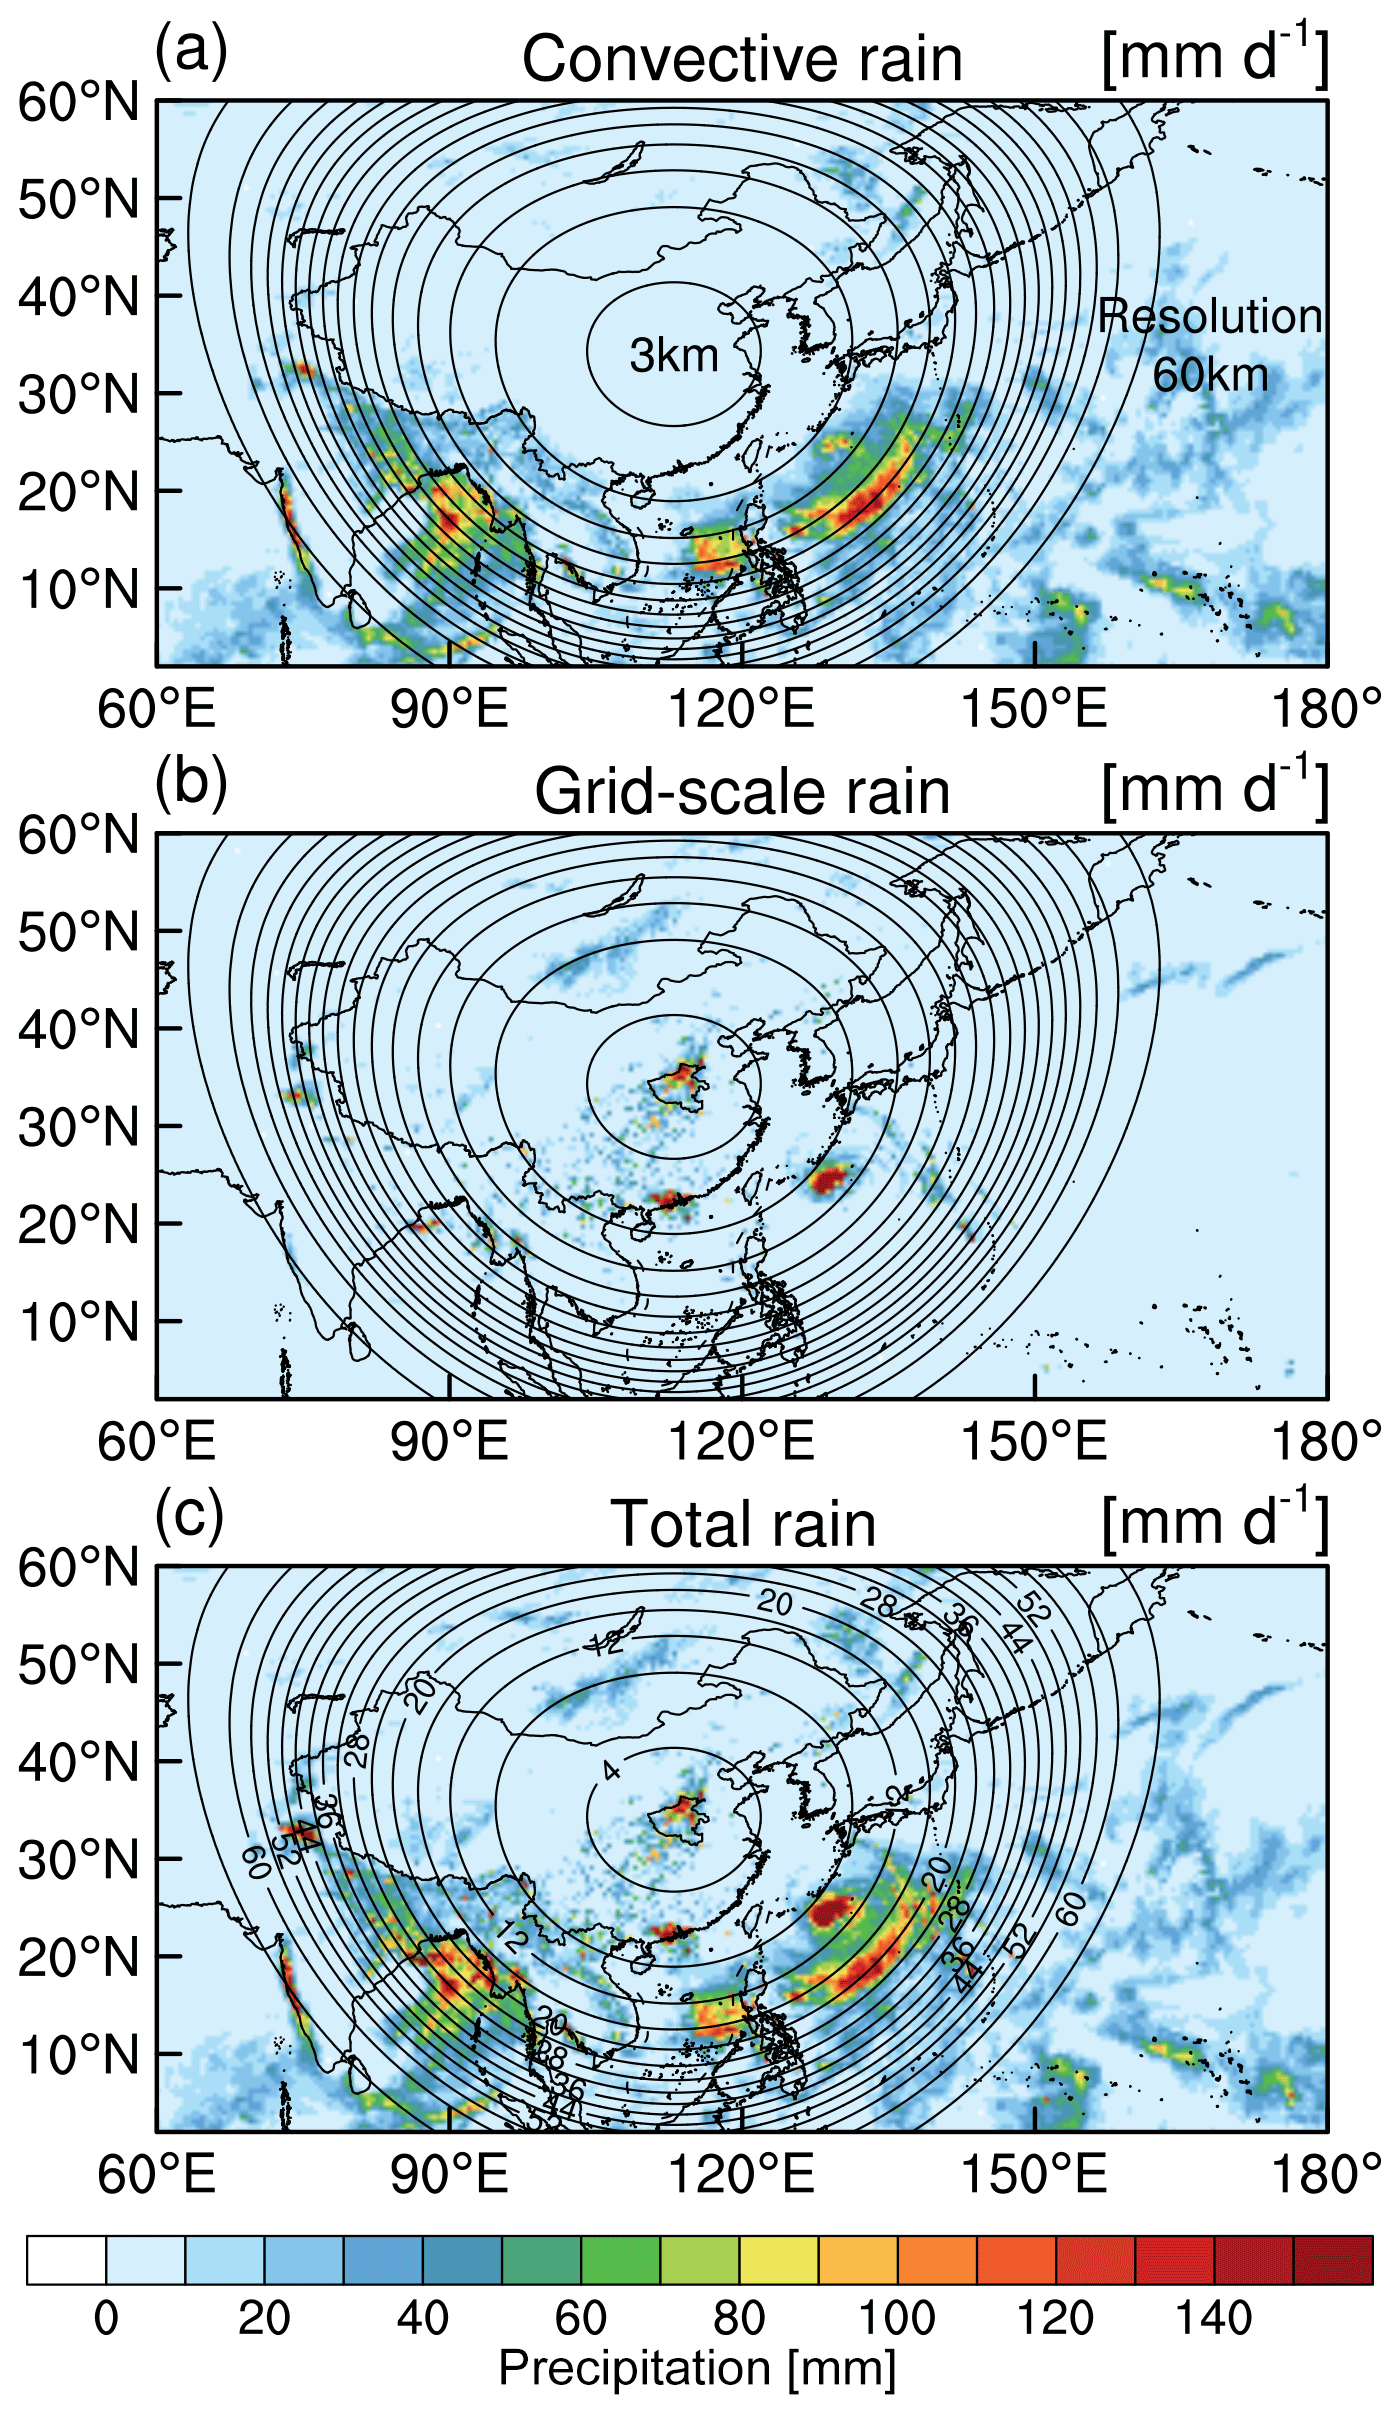
Figure 15Spatial distribution of averaged convective, grid-scale, and total precipitation from 20 July at 00:00 to 22 July at 00:00 UTC from the V3km.CP simulation. The solid black line represents the grid resolution from 64 km to 4 km by 4 km, and the label “3 km” (“60 km”) in panel (a) denotes a horizontal resolution of 3 km (60 km) within the specified region.
At the mesh resolution of 15 km, the contribution of convective precipitation and grid-scale precipitation to total precipitation lies between the performances of QU60km.MS and V3km.CP. Here we analyze the impact of the scaling factor (1−σ)2 upon the updraft mass flux. In the V15km.CP simulation, the value of σ in the refined region is 0.11, with (1−σ)2 equal to 0.79. The large value of this (1−σ)2, in conjunction with , predominantly governs the vertical eddy transport , leading to the evident convective precipitation shown in Fig. 14c. In contrast, in the V3km.CP simulation, the value of σ in the refined region is 0.7, with (1−σ)2 equal to 0.09. Here, the small value of (1−σ)2 primarily minimizes the vertical eddy transport , resulting in almost no convective precipitation in Fig. 14d. In the V15km.MS simulation, where the mass-flux-based convective scheme NTD is used, equivalent to the GF scheme with σ equal to 0, convective rain is closer to that in QU60km.MS despite an erroneous precipitation center over southwest Henan Province. Regarding total rain, the V15km.MS simulation correctly predicts a high precipitation center in northern Henan compared to V15km.CP, although there are still numerous incorrect predictions in the southwestern region. In addition to different contributions from convective precipitation, the contribution to total rain from grid-scale rain generated by microphysics parameterization in both V15km.MS and V15km.CP remains significant. We found that the discrepancy between V15km.MS and V15km.CP arises from the distinct microphysics schemes generating different grid-scale precipitation, ultimately resulting in disparate total rain outcomes. Previous study of comparing Thompson and WSM6 schemes found that the dominant size of graupel particles with Thompson scheme is larger than that with the WSM6 scheme such that the different rainwater production and accompanying evaporative cooling below freezing level could be the result (Bao et al., 2019). This may help explain the amplified evaporative cooling in the lower troposphere and intensified condensational warming in the upper troposphere (shown in Fig. 12) for simulations at 15 km resolution with the CP scheme suite where the Thompson scheme is used in contrast to the MS scheme suite where the WSM6 scheme is used.
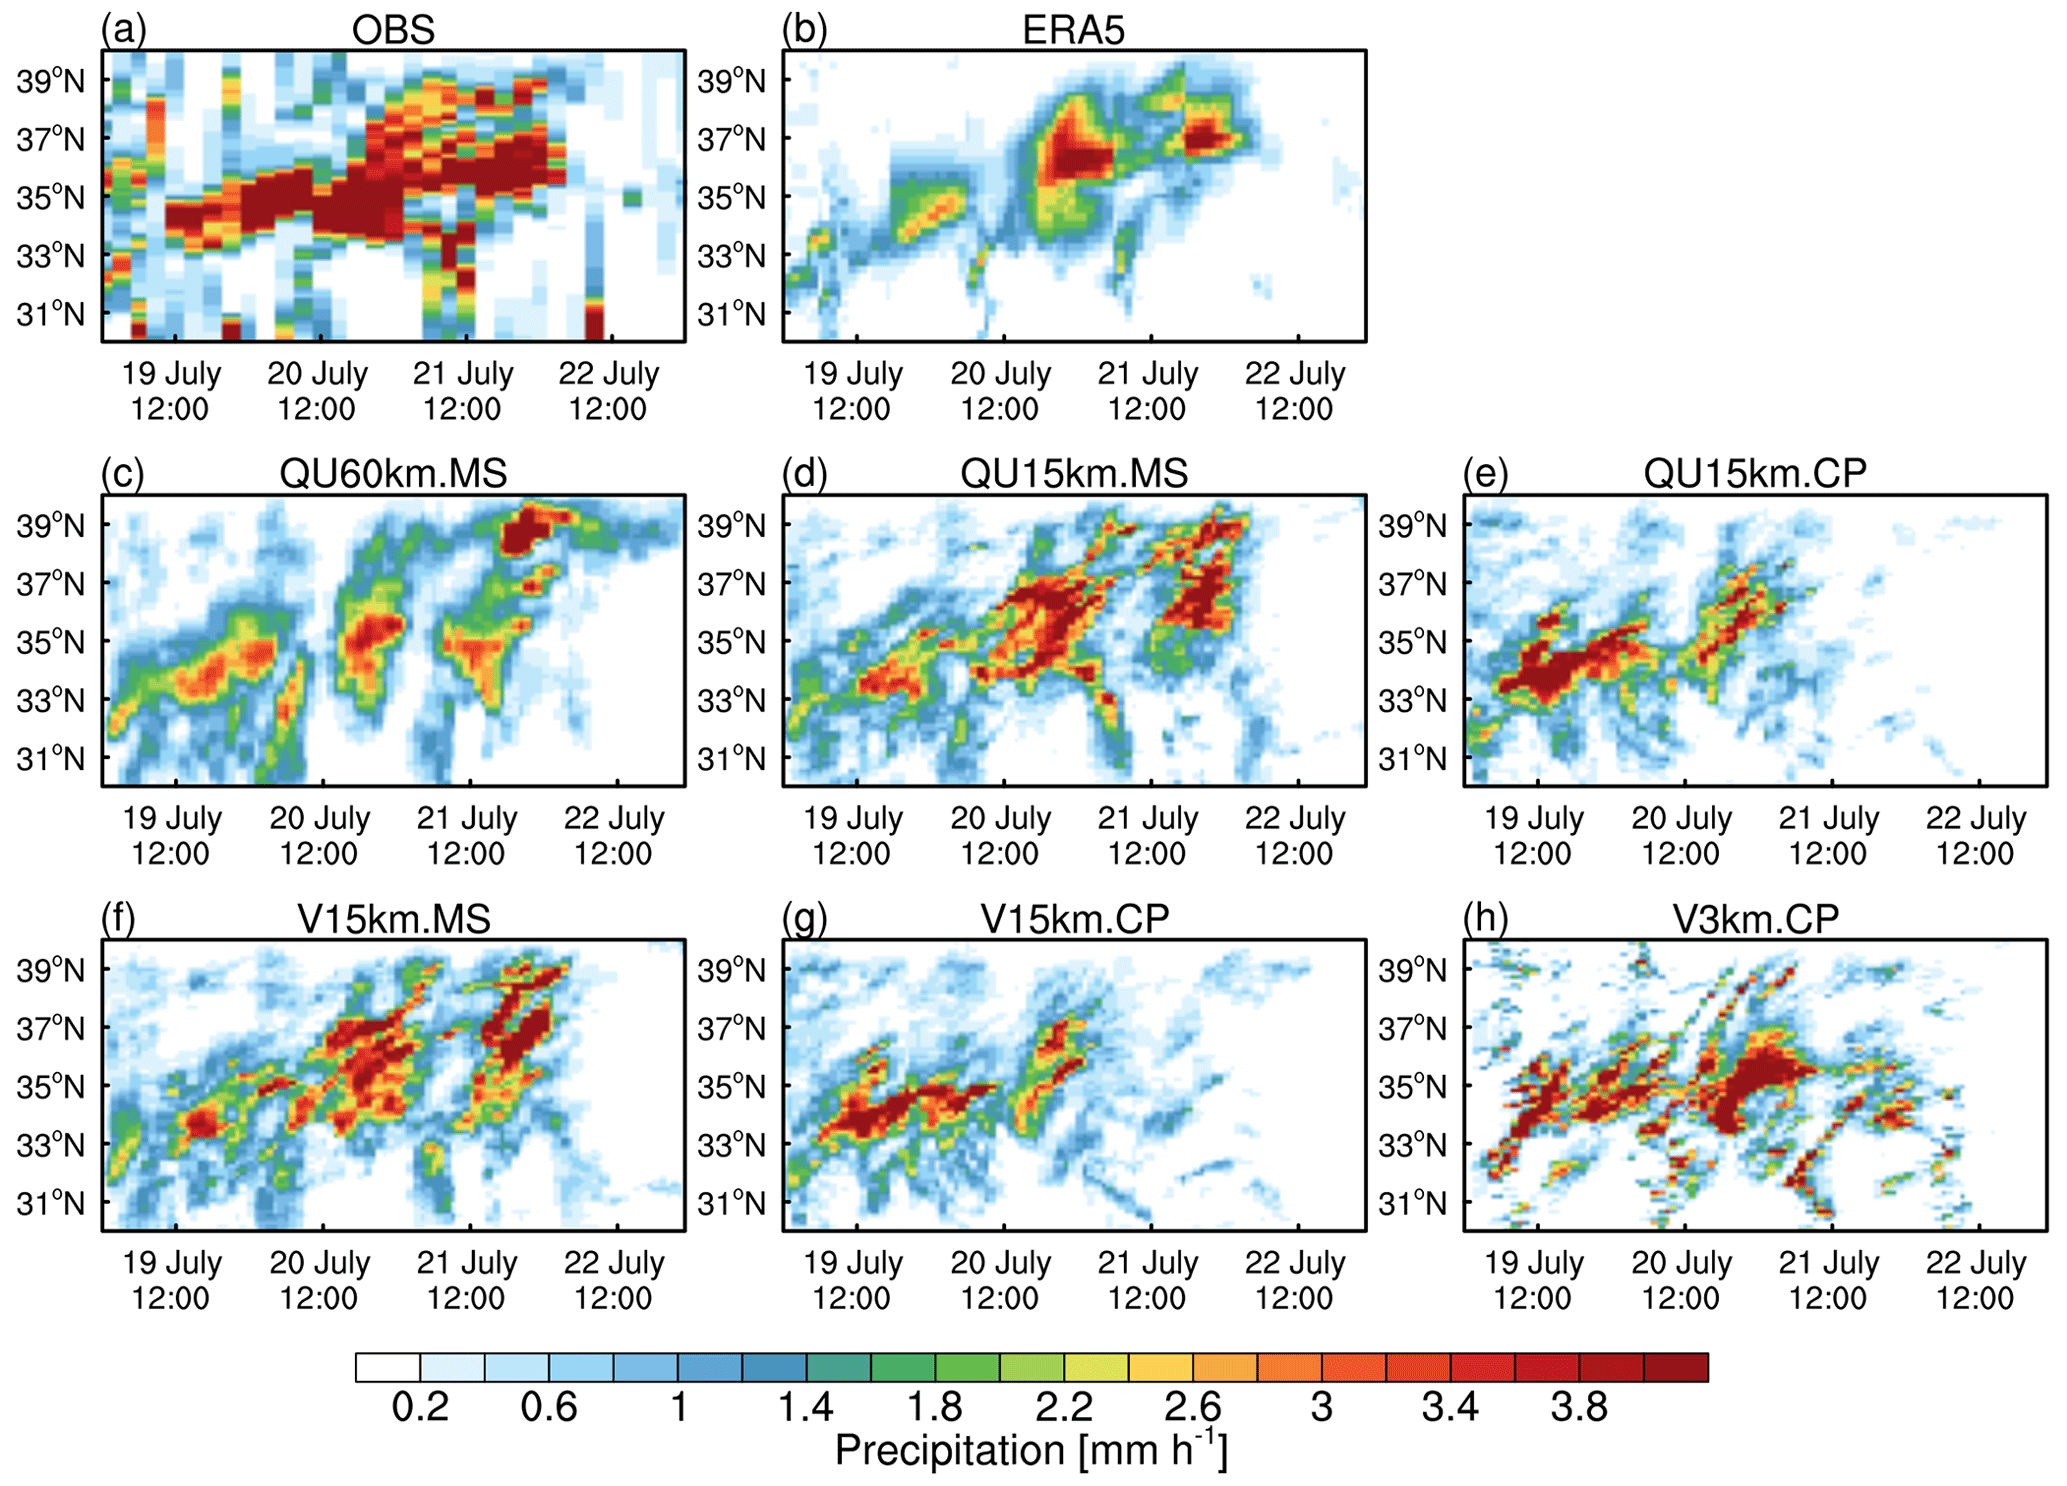
Figure 16Time–latitude cross section of precipitation over Henan Province (30–40° N, 110–130° E) from the CMA station observations and the simulations with global uniform and variable resolution with two parameterization scheme suites.
In order to show the smooth transition from coarse to fine resolution of the global variable-resolution simulation using the convection-permitting scale-aware scheme suite, we calculated the convective, grid-scale, and total precipitation along with the corresponding mesh spacing in the V3km.CP simulation (Fig. 15). As mentioned above, σ is set to 0.7 in the refined region (at the resolution of 3 km) in the V3km.CP simulation, and this leads to the scaling factor 0.09 being multiplied by the maximum convective vertical eddy transport. It implies that only 9 % of the cloud mass-flux-based parameterization of convection is utilized over the refined mesh region, whereas the rest of the precipitation is computed from the grid-scale precipitation. The comparison of the convective precipitation against grid-scale precipitation inside and outside the mesh refinement region clearly highlights the scale dependence of simulated precipitation upon the convective faction in the GF scheme. We found that the comparison between Fig. 15a and b shows that as the spatial resolution transitions from 60 to 3 km over northern China, the convective precipitation significantly decreases, while the grid-scale precipitation increases. The increasing grid-scale precipitation is compensated for smoothly, decreasing convective precipitation over the area of mesh refinement, which means that the GF scheme accomplishes the remarkable scale-aware performance, enabling a continuous adjustment of the cloud mass flux based on the convective updraft fraction. Another interesting feature arising from Fig. 15 is that the typhoon-associated precipitation is clearly stratified as convective precipitation and grid-scale precipitation over the mesh transition area. Approaching the refined region, more grid-scale precipitation can be found, which implies that the variable-resolution mesh could be an ideal tool to study horizontal scale dependence of convective and grid-scale moist processes associated with typhoons.
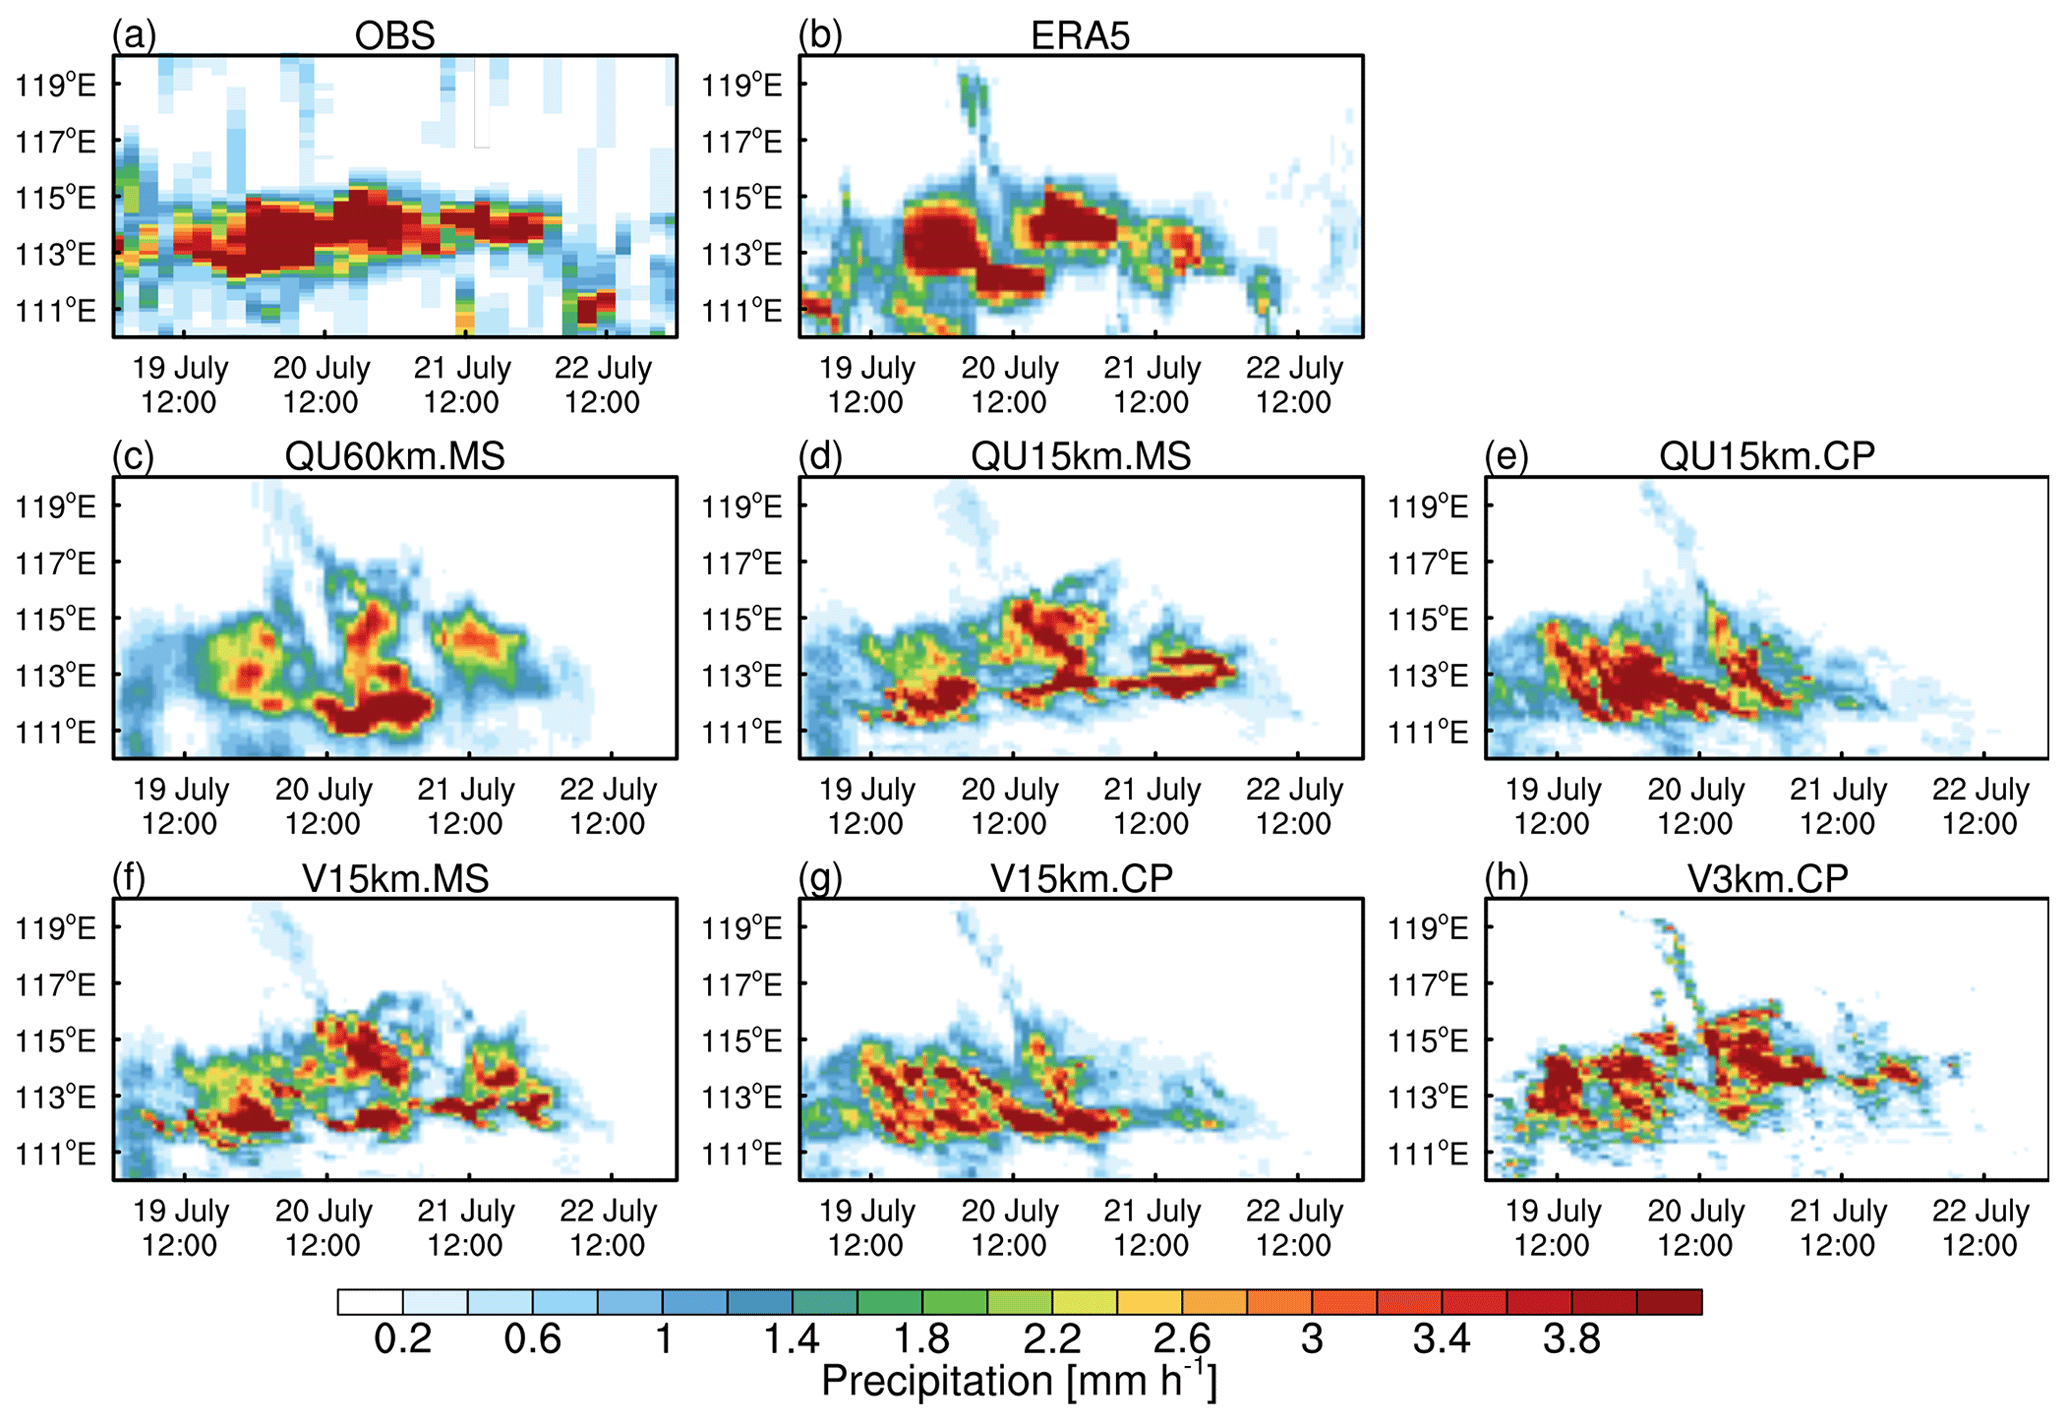
Figure 17Time–longitude cross section of precipitation averaged over Henan Province (30–40° N, 110–130° E) from the CMA station observations and the simulations with global uniform and variable resolution with two schemes.
4.2 Spatial and temporal variation
Figure 16 shows the meridional precipitation propagation over Henan Province during the event. The CMA observation and the ERA5 reanalysis data show that the position of the rain belt moved northward from near 33° N on 19 July at 00:00 UTC to 37° N on 22 July at 00:00 UTC. All simulations effectively predicted the northward movement of the precipitation pattern. It is noteworthy that all CP simulations, including V3km.CP, failed to simulate the precipitation from 21 July at 12:00 to 22 July at 06:00 UTC, which can be characterized as the third peak period. Nevertheless, this third peak period is accompanied by the least precipitation amount during this heavy rainfall event. Conversely, all MS simulations, including QU60km.MS, captured the precipitation during the mentioned period, albeit with intensity deviations. In addition to the meridional propagation of the precipitation phases investigated here, we also examined the simulated zonal propagation of rainfall over Henan Province from 20 July at 00:00 to 22 July at 00:00 UTC (Fig. 17). The precipitation mainly occurred at 113° E, and there was a tendency for the precipitation to move eastward over time. The precipitation forecasted by QU60km.MS was biased towards the east due to the coarse resolution. The forecast performance of the CP suite and MS suite at 15 km is comparable for the first peak period, but the performance of the CP suite worsened for the second and third peak periods. In particular, all simulations with the CP suite at 15 km missed the third peak. While the precipitation locations predicted by the QU15km.MS and V15km.MS simulations exhibit a broader east–west spread compared to observations, the QU15km.CP and V15km.CP simulations incorrectly position the precipitation to the west and erroneously omit the precipitation during the third peak period.
This pioneering study introduces a novel modeling approach to predicting a historic rainstorm that occurred over Henan Province, China, in July 2021 (7.20 extreme precipitation) by utilizing a global variable-resolution nonhydrostatic model (MPAS-Atmosphere). MPAS-Atmosphere v7.3 was employed to simulate this extreme precipitation event. A series of simulations has been done at both quasi-uniform (60 and 15 km) and variable-resolution (60–15 and 60–3 km) meshes from hydrostatic to nonhydrostatic scale with two parameterization scheme suites. For the 48 h peak precipitation duration (20–22 July), the 60–3 km variable-resolution simulation coupled with the scale-aware convection-permitting parameterization scheme suite stands out among all tested simulations as it reproduces this extreme precipitation event most accurately in terms of both the intensity and location of the peak precipitation. At 15 km resolution, given the same parameterization schemes are selected, the 60–15 km variable-resolution simulation achieves comparable forecasting skills to the 15 km quasi-uniform simulation but with the former being performed at a much reduced computing cost. In addition, we further compared two sets of built-in physical parameterization schemes, namely the mesoscale suite and scale-aware convection-permitting suite, at a quasi-uniform and a variable-resolution mesh of 15 km, respectively. The default mesoscale suite generally outperforms the convection-permitting suite in simulating precipitation at 15 km resolution during the three peak periods of this event. In particular, both 15 km quasi-uniform and 60–15 km variable-resolution simulations coupled with the convection-permitting parameterization scheme suite missed the third peak period, which is associated with the least amount of precipitation though. Hence, it is essential to match parameterization schemes with the grid resolution for optimal compatibility. Furthermore, we found that the large-scale circulation plays a critical role in the peak precipitation simulations via influencing the simulated large-scale low-level wind. Specifically, during the second 24 h period, simulations with the convection-permitting parameterization scheme suite at 15 km resolution are found to be associated with an easterly wind component bias in the lower troposphere relative to the default mesoscale suite. This easterly wind component bias is very likely due to the excessive evaporative cooling in the lower troposphere from the convection-permitting parameterization scheme suite in which the Thompson microphysics scheme is used, whereas in the default mesoscale suite the WSM6 microphysics scheme is used. In other words, at 15 km resolution, the diabatic heating associated with grid-scale precipitation largely accounts for the large-scale wind simulation bias such that this wind bias would, in turn, feedback to the total precipitation simulation bias.
Moreover, in this study, we demonstrate that for simulations at hydrostatic scale (60 km), the convective precipitation is computed based on the equilibrium mass-flux-based parameterizations of convection with a scaling factor as 1, namely the deep convection scheme. As the resolution is being pushed from the coarse to the intermediate level (15 km), this scaling factor gradually decreases. For instance, for simulations at 15 km, the scaling factor in front of the mass-flux-based convective scheme is approximately 0.8. When the resolution is pushed to the cloud-resolving scale (3 km), the convective scheme becomes considerably small. For instance, for simulations with the variable-resolution mesh spanning between hydrostatic and nonhydrostatic scales (60–3 km), the associated scale-aware GF convection scheme performs as a conventional deep convective scheme over the coarse region, whereas it behaves as a shallow convective scheme over the refined region with the scaling factor becoming 0.09. Therefore, as the mesh resolution increases, the grid-scale precipitation becomes dominant in the total precipitation relative to the convective precipitation. Therefore, the MPAS variable-resolution meshes bridging hydrostatic and nonhydrostatic scales provide an excellent tool for evaluating the dependence of grid-scale and subgrid-scale precipitation upon horizontal resolutions.
For the conventional limited-area atmospheric model that is used for numerical weather prediction such as WRF, it has a number of long-standing issues including mismatching solution between the outer domain and inner domain, wave reflection along the imposed boundary of the inner domain, and setting sponge zones next to lateral boundaries. So the MPAS variable-resolution model provides an alternative way to bypass these issues as the simulations are done within an entire global framework. In addition, the scale-aware GF convection parameterization scheme makes it possible to quantify the scale dependence of convective and grid-scale precipitation, even over the smooth transition-zone resolutions, while the conventional limited-area model fails in this aspect. Therefore, the analysis done in this study regarding the precipitation partitioning can be conducted in MPAS simulations of other extreme rainfall events similar to the 20 July event studied here. In addition, MPAS can be equally used for typhoon simulations given its excellent ability for investigating issues related to precipitation scale dependence.
The study of Xu et al. (2023) using WRF with the GF convective scheme with a one-way nesting configuration for the 7.20 event, where the outer domain has a resolution of 20 km and the inner domain has a resolution of 4 km, showed large biases in simulated precipitation in contrast to the excellent simulation results by the 60–3 km variable-resolution simulation performed in the present study. Nevertheless, both studies have found that the flawed convective parameterization scheme could lead to significant bias in the simulated large-scale circulation, thereby producing biased precipitation simulation results. Moreover, in the current study, we have also found that the computed grid-scale precipitation based on different microphysics schemes may result in inaccurate diabatic heating and thus misrepresented large-scale circulation. Sun et al. (2023) diagnosed various mesoscale factors of the same 7.20 extreme precipitation event with a 4D data assimilation system, and their results are consistent with what we found here in that this extreme precipitation event was maintained by the dynamical lifting of low-level converging flows from the south, southeast, and east of Henan Province. In addition, our study further elucidates how the easterly wind anomalies affect precipitation simulation bias. The specific topography may also be a key factor influencing this extreme rainfall event as Sun et al. (2023) and Yin et al. (2021) pointed out. Their study emphasized the role of the unique terrain of the Taihang and Funiu mountains located to the west of Henan Province. Hence, their results are aligned with our findings in that the 60–3 km variable-resolution simulation in the refined region can capture well the small details of these terrain effects.
This study found that the global 60–3 km variable-resolution MPAS simulation coupled with the scale-aware convection-permitting parameterization scheme suite outperforms alternative simulations, which is consistent with the previous studies (Zhao et al., 2019; Skamarock et al., 2018; Feng et al., 2018; Prein et al., 2015). Sakaguchi et al. (2015) used the variable-resolution MPAS model, as a regional climate model, to simulate precipitation over East Asia and found that the surface heterogeneity exerts significant influence on the regional precipitation simulation, which is consistent with the role played by terrains in the extreme precipitation simulations. Endeavors aimed at improving the scale-aware function of convective parameterization may yield further advancements in the future (Gao et al., 2017; Hagos et al., 2013; Skamarock et al., 2012). Further study is underway to investigate various variable-resolution meshes coupled with different convection schemes in simulating other extreme precipitation event.
The exact version of the MPAS-A model along with all the datasets used in this study is available on Zenodo: https://doi.org/10.5281/zenodo.10503571 (Liu and Dong, 2024). In addition, the model (MPAS-A v7.3) used is available from the project website: https://mpas-dev.github.io/ (last access: 14 January 2024, MPAS, 2024). The global meshes generated for all the MPAS experiments in this study can be downloaded from Zenodo: https://doi.org/10.5281/zenodo.10503571 (Liu and Dong, 2024). Hourly precipitation, wind, and temperature data from the European Centre for Medium-Range Weather Forecasts (ECMWF) Reanalysis can be downloaded from https://doi.org/10.24381/cds.bd0915c6 (Hersbach et al., 2023). Hourly surface observation data used in this study can be downloaded from Zenodo: https://doi.org/10.5281/zenodo.10503571 (Liu and Dong, 2024).
LD and ZL designed the study and the experiments. LD, ZL, ZQ, and XL analyzed the observations. LD, ZL, HY, DM, and XQ analyzed the simulations. ZL, DL, and YW performed simulations and created the figures.
The contact author has declared that none of the authors has any competing interests.
Publisher's note: Copernicus Publications remains neutral with regard to jurisdictional claims made in the text, published maps, institutional affiliations, or any other geographical representation in this paper. While Copernicus Publications makes every effort to include appropriate place names, the final responsibility lies with the authors.
The authors thank the European Centre for Medium-Range Weather Forecasts for providing datasets, models, etc. All computations of this work were done at the Center for Computational Science and Engineering at Southern University of Science and Technology, and we appreciate the high-quality service provided by the staff of this center.
This research has been supported by the National Natural Science Foundation of China (grant no. 41975060) and the Shenzhen Science and Technology Innovation Program (grant nos. JCYJ20190809163007701 and JCY20200925160922002).
This paper was edited by Yongze Song and reviewed by two anonymous referees.
Arakawa, A. and Wu, C.-M.: A unified representation of deep moist convection in numerical modeling of the atmosphere. Part I, J. Atmos. Sci., 70, 1977–1992, https://doi.org/10.1175/JAS-D-12-0330.1, 2013. a, b
Arakawa, A., Jung, J.-H., and Wu, C.-M.: Toward unification of the multiscale modeling of the atmosphere, Atmos. Chem. Phys., 11, 3731–3742, https://doi.org/10.5194/acp-11-3731-2011, 2011. a
Bao, J.-W., Michelson, S. A., and Grell, E. D.: Microphysical Process Comparison of Three Microphysics Parameterization Schemes in the WRF Model for an Idealized Squall-Line Case Study, Mon. Weather Rev., 147, 3093–3120, https://doi.org/10.1175/MWR-D-18-0249.1, 2019. a
Bechtold, P., Chaboureau, J.-P., Beljaars, A., Betts, A., Köhler, M., Miller, M., and Redelsperger, J.-L.: The simulation of the diurnal cycle of convective precipitation over land in a global model, Q. J. Roy. Meteor. Soc., 130, 3119–3137, https://doi.org/10.1256/qj.03.103, 2004. a
Bechtold, P., Köhler, M., Jung, T., Doblas-Reyes, F., Leutbecher, M., Rodwell, M. J., Vitart, F., and Balsamo, G.: Advances in simulating atmospheric variability with the ECMWF model: From synoptic to decadal time-scales, Q. J. Roy. Meteor. Soc., 134, 1337–1351, https://doi.org/10.1002/qj.289, 2008. a
Bechtold, P., Semane, N., Lopez, P., Chaboureau, J.-P., Beljaars, A., and Bormann, N.: Representing equilibrium and nonequilibrium convection in large-scale models, J. Atmos. Sci., 71, 734–753, https://doi.org/10.1175/JAS-D-13-0163.1, 2014. a
Chen, F. and Dudhia, J.: Coupling an advanced land surface–hydrology model with the Penn State–NCAR MM5 modeling system. Part I: Model implementation and sensitivity, Mon. Weather Rev., 129, 569–585, https://doi.org/10.1175/1520-0493(2001)129<0569:CAALSH>2.0.CO;2, 2001. a
Chen, F., Yuan, H., Sun, R., and Yang, C.: Streamflow simulations using error correction ensembles of satellite rainfall products over the Huaihe river basin, J. Hydrol., 589, 125179, https://doi.org/10.1016/j.jhydrol.2020.125179, 2020. a
Cheng, Y., Hui, P., Liu, D., Fang, J., Wang, S., Wang, S., and Tang, J.: MPAS-A Variable-Resolution Simulations for Summer Monsoon Over China: Comparison Between Global and Regional Configuration, J. Geophys. Res.-Atmos., 128, e2022JD037541, https://doi.org/10.1029/2022JD037541, 2023. a
Davis, C. A., Ahijevych, D. A., Wang, W., and Skamarock, W. C.: Evaluating medium-range tropical cyclone forecasts in uniform-and variable-resolution global models, Mon. Weather Rev., 144, 4141–4160, https://doi.org/10.1175/MWR-D-16-0021.1, 2016. a
Ding, Y. and Chan, J. C.: The East Asian summer monsoon: an overview, Meteorol. Atmos. Phys., 89, 117–142, https://doi.org/10.1007/s00703-005-0125-z, 2005. a
Ding, Y., Wang, Z., and Sun, Y.: Inter-decadal variation of the summer precipitation in East China and its association with decreasing Asian summer monsoon. Part I: Observed evidences, Int. J. Climatol., 28, 1139–1161, https://doi.org/10.1002/joc.1615, 2008. a
Ding, Y., Liu, Y., and Hu, Z.-Z.: The record-breaking mei-yu in 2020 and associated atmospheric circulation and tropical SST anomalies, Adv. Atmos. Sci., 38, 1980–1993, https://doi.org/10.1007/s00376-021-0361-2, 2021. a
Du, Y. and Chen, G.: Heavy rainfall associated with double low-level jets over southern China. Part II: Convection initiation, Mon. Weather Rev., 147, 543–565, https://doi.org/10.1175/MWR-D-18-0102.1, 2019. a
Feng, Z., Leung, L. R., Houze Jr, R. A., Hagos, S., Hardin, J., Yang, Q., Han, B., and Fan, J.: Structure and evolution of mesoscale convective systems: Sensitivity to cloud microphysics in convection-permitting simulations over the United States, J. Adv. Model. Earth Sy., 10, 1470–1494, https://doi.org/10.1029/2018MS001305, 2018. a
Fowler, L. D., Skamarock, W. C., Grell, G. A., Freitas, S. R., and Duda, M. G.: Analyzing the Grell–Freitas convection scheme from hydrostatic to nonhydrostatic scales within a global model, Mon. Weather Rev., 144, 2285–2306, https://doi.org/10.1175/MWR-D-15-0311.1, 2016. a, b, c, d, e, f, g
Gao, Y., Leung, L. R., Zhao, C., and Hagos, S.: Sensitivity of US summer precipitation to model resolution and convective parameterizations across gray zone resolutions, J. Geophys. Res.-Atmos., 122, 2714–2733, https://doi.org/10.1002/2016JD025896, 2017. a
Grell, G. A. and Dévényi, D.: A generalized approach to parameterizing convection combining ensemble and data assimilation techniques, Geophys. Res. Lett., 29, 38–1, https://doi.org/10.1029/2002GL015311, 2002. a
Grell, G. A. and Freitas, S. R.: A scale and aerosol aware stochastic convective parameterization for weather and air quality modeling, Atmos. Chem. Phys., 14, 5233–5250, https://doi.org/10.5194/acp-14-5233-2014, 2014. a
Hagos, S., Leung, R., Rauscher, S. A., and Ringler, T.: Error characteristics of two grid refinement approaches in aquaplanet simulations: MPAS-A and WRF, Mon. Weather Rev., 141, 3022–3036, https://doi.org/10.1175/MWR-D-12-00338.1, 2013. a
Hersbach, H., Bell, B., Berrisford, P., Biavati, G., Horányi, A., Muñoz Sabater, J., Nicolas, J., Peubey, C., Radu, R., Rozum, I., Schepers, D., Simmons, A., Soci, C., Dee, D., and Thépaut, J.-N.: ERA5 hourly data on pressure levels from 1940 to present. Copernicus Climate Change Service (C3S) Climate Data Store (CDS) [data set], https://doi.org/10.24381/cds.bd0915c6, 2023. a
Hong, S.-Y.: A new stable boundary-layer mixing scheme and its impact on the simulated East Asian summer monsoon, Q. J. Roy. Meteor. Soc., 136, 1481–1496, https://doi.org/10.1002/qj.665, 2010. a
Hong, S. Y. and Lim, J. O. J.: The WRF single-moment 6-class microphysics scheme (WSM6), J. Korean Meteor. Soc., 42, 129–151, 2006. a
Hong, S. Y., Noh, Y., and Dudhia, J.: A new vertical diffusion package with an explicit treatment of entrainment processes, Mon. Weather Rev., 134, 2318–2341, https://doi.org/10.1175/MWR3199.1, 2006. a
Houze Jr., R. A.: Mesoscale convective systems, Rev. Geophys., 42, RG4003, https://doi.org/10.1029/2004RG000150, 2004. a
Iacono, M. J., Mlawer, E. J., Clough, S. A., and Morcrette, J.-J.: Impact of an improved longwave radiation model, RRTM, on the energy budget and thermodynamic properties of the NCAR community climate model, CCM3, J. Geophys. Res.-Atmos., 105, 14873–14890, https://doi.org/10.1029/2000JD900091, 2000. a
Klemp, J. B.: A terrain-following coordinate with smoothed coordinate surfaces, Mon. Weather Rev., 139, 2163–2169, https://doi.org/10.1175/MWR-D-10-05046.1, 2011. a
Klemp, J. B., Skamarock, W. C., and Dudhia, J.: Conservative split-explicit time integration methods for the compressible nonhydrostatic equations, Mon. Weather Rev., 135, 2897–2913, 'https://doi.org/10.1175/MWR3440.1, 2007. a, b
Li, Z., Lau, W. K. M., Ramanathan, V., Wu, G., Ding, Y., Manoj, M. G., Liu, J., Qian, Y., Li, J., Zhou, T., Fan, J., Rosenfeld, D., Ming, Y., Wang, Y., Huang, J., Wang, B., Xu, X., Lee, S. S., Cribb, M., Zhang, F., Yang, X., Zhao, C., Takemura, T., Wang, K., Xia, X., Yin, Y., Zhang, H., Guo, J., Zhai, P. M., Sugimoto, N., Babu, S. S., and Brasseur, G. P.: Aerosol and monsoon climate interactions over Asia, Rev. Geophys., 54, 866–929, https://doi.org/10.1002/2015RG000500, 2016. a
Liang, Y., Yang, B., Wang, M., Tang, J., Sakaguchi, K., Leung, L. R., and Xu, X.: Multiscale Simulation of Precipitation Over East Asia by Variable Resolution CAM-MPAS, J. Adv. Model. Earth Sy., 13, e2021MS002656, https://doi.org/10.1029/2021MS002656, 2021. a
Liu, B., Yan, Y., Zhu, C., Ma, S., and Li, J.: Record-breaking Meiyu rainfall around the Yangtze River in 2020 regulated by the subseasonal phase transition of the North Atlantic Oscillation, Geophys. Res. Lett., 47, e2020GL090342, https://doi.org/10.1029/2020GL090342, 2020. a, b
Liu, Z. and Dong, L.: Global variable-resolution simulations of extreme precipitation over Henan, China in 2021 with MPAS-Atmosphere v7.3, Zenodo [data set], https://doi.org/10.5281/zenodo.10503572, 2024. a, b, c
Lonfat, M., Marks Jr., F. D., and Chen, S. S.: Precipitation distribution in tropical cyclones using the Tropical Rainfall Measuring Mission (TRMM) Microwave Imager: A global perspective, Mon. Weather Rev., 132, 1645–1660, https://doi.org/10.1175/1520-0493(2004)132<1645:PDITCU>2.0.CO;2, 2004. a
MPAS: MPAS Overview, MPAS [code], https://mpas-dev.github.io/, last access: 14 January 2024. a
Nakanishi, M. and Niino, H.: An improved Mellor–Yamada level-3 model: Its numerical stability and application to a regional prediction of advection fog, Bound.-Lay. Meteorol., 119, 397–407, https://doi.org/10.1007/s10546-005-9030-8, 2006. a
Nakanishi, M. and Niino, H.: Development of an improved turbulence closure model for the atmospheric boundary layer, J. Meteorol. Soc. Jpn. Ser. II, 87, 895–912, https://doi.org/10.2151/jmsj.87.895, 2009. a
Nie, Y. and Sun, J.: Moisture sources and transport for extreme precipitation over Henan in July 2021, Geophys. Res. Lett., 49, e2021GL097446, https://doi.org/10.1029/2021GL097446, 2022. a
Park, S.-H., Skamarock, W. C., Klemp, J. B., Fowler, L. D., and Duda, M. G.: Evaluation of global atmospheric solvers using extensions of the Jablonowski and Williamson baroclinic wave test case, Mon. Weather Rev., 141, 3116–3129, ttps://doi.org/10.1175/MWR-D-12-00096.1, 2013. a
Prein, A. F., Langhans, W., Fosser, G., Ferrone, A., Ban, N., Goergen, K., and Brisson, E.: A review on regional convection-permitting climate modeling: Demonstrations, prospects, and challenges, Rev. Geophys., 53, 323–361, https://doi.org/10.1002/2014RG000475, 2015. a
Rao, J., Xie, J., Cao, Y., Zhu, S., and Lu, Q.: Record Flood-Producing Rainstorms of July 2021 and August 1975 in Henan of China: Comparative Synoptic Analysis Using ERA5, J. Meteorol. Res., 36, 809–823, https://doi.org/10.1007/s13351-022-2066-6, 2022. a, b
Rauscher, S. A., Ringler, T. D., Skamarock, W. C., and Mirin, A. A.: Exploring a global multiresolution modeling approach using aquaplanet simulations, J. Climate, 26, 2432–2452, https://doi.org/10.1175/JCLI-D-12-00154.1, 2013. a
Sakaguchi, K., Leung, L. R., Zhao, C., Yang, Q., Lu, J., Hagos, S., Rauscher, S. A., Dong, L., Ringler, T. D., and Lauritzen, P. H.: Exploring a multiresolution approach using AMIP simulations, J. Climate, 28, 5549–5574, https://doi.org/10.1175/JCLI-D-14-00729.1, 2015. a
Skamarock, W. C. and Gassmann, A.: Conservative transport schemes for spherical geodesic grids: High-order flux operators for ODE-based time integration, Mon. Weather Rev., 139, 2962–2975, https://doi.org/10.1175/MWR-D-10-05056.1, 2011. a
Skamarock, W. C. and Klemp, J. B.: A time-split nonhydrostatic atmospheric model for weather research and forecasting applications, J. Comput. Phys., 227, 3465–3485, https://doi.org/10.1016/j.jcp.2007.01.037, 2008. a, b
Skamarock, W. C., Klemp, J. B., Duda, M. G., Fowler, L. D., Park, S.-H., and Ringler, T. D.: A multiscale nonhydrostatic atmospheric model using centroidal Voronoi tesselations and C-grid staggering, Mon. Weather Rev., 140, 3090–3105, https://doi.org/10.1175/MWR-D-11-00215.1, 2012. a, b, c
Skamarock, W. C., Duda, M. G., Ha, S., and Park, S.-H.: Limited-area atmospheric modeling using an unstructured mesh, Mon. Weather Rev., 146, 3445–3460, https://doi.org/10.1175/MWR-D-18-0155.1, 2018. a
Skamarock, W. C., Snyder, C., Klemp, J. B., and Park, S.-H.: Vertical resolution requirements in atmospheric simulation, Mon. Weather Rev., 147, 2641–2656, https://doi.org/10.1175/MWR-D-19-0043.1, 2019. a
Sun, J., Li, R., Zhang, Q., Trier, S. B., Ying, Z., and Xu, J.: Mesoscale factors contributing to the extreme rainstorm on July 2021 in Zhengzhou, China as revealed by rapid update 4DVar analysis. Mon. Weather Rev., 151, 2153–2176, https://doi.org/10.1175/MWR-D-22-0337.1, 2023 a, b
Sun, R., Yuan, H., and Yang, Y.: Using multiple satellite-gauge merged precipitation products ensemble for hydrologic uncertainty analysis over the Huaihe River basin, J. Hydrol., 566, 406–420, https://doi.org/10.1016/j.jhydrol.2018.09.024, 2018. a
Sun, W., Mu, X., Song, X., Wu, D., Cheng, A., and Qiu, B.: Changes in extreme temperature and precipitation events in the Loess Plateau (China) during 1960–2013 under global warming, Atmos. Res., 168, 33–48, https://doi.org/10.1016/j.atmosres.2015.09.001, 2016. a
Thompson, G. and Eidhammer, T.: A study of aerosol impacts on clouds and precipitation development in a large winter cyclone, J. Atmos. Sci., 71, 3636–3658, https://doi.org/10.1175/JAS-D-13-0305.1, 2014. a
Thompson, G., Field, P. R., Rasmussen, R. M., and Hall, W. D.: Explicit forecasts of winter precipitation using an improved bulk microphysics scheme. Part II: Implementation of a new snow parameterization, Mon. Weather Rev., 136, 5095–5115, https://doi.org/10.1175/2008MWR2387.1, 2008. a
Tiedtke, M.: A comprehensive mass flux scheme for cumulus parameterization in large-scale models, Mon. Weather Rev., 117, 1779–1800, https://doi.org/10.1175/1520-0493(1989)117<1779:ACMFSF>2.0.CO;2, 1989. a
Wang, B., Xiang, B., and Lee, J.-Y.: Subtropical high predictability establishes a promising way for monsoon and tropical storm predictions, P. Natl. Acad. Sci. USA, 110, 2718–2722, https://doi.org/10.1073/pnas.1214626110, 2013. a
Wang, W.: Forecasting Convection with a “Scale-Aware” Tiedtke Cumulus Parameterization Scheme at Kilometer Scales, Weather Forecast., 37, 1491–1507, https://doi.org/10.1175/WAF-D-21-0179.1, 2022. a
Wicker, L. J. and Skamarock, W. C.: An Implicit–Explicit Vertical Transport Scheme for Convection-Allowing Models, Mon. Weather Rev., 148, 3893–3910, https://doi.org/10.1175/MWR-D-20-0055.1, 2020. a
Xu, H., Duan, Y., and Xu, X.: Indirect Effects of Binary Typhoons on an Extreme Rainfall Event in Henan Province, China From 19 to 21 July 2021: 1. Ensemble-Based Analysis, J. Geophys. Res.-Atmos., 127, e2021JD036265, https://doi.org/10.1029/2021JD036083, 2022. a
Xu, M., Zhao, C., Gu, J., Feng, J., Hagos, S., Leung, L. R., Luo, Y., Guo, J., Li, R., and Fu, Y.: Convection-Permitting Hindcasting of Diurnal Variation of Mei-yu Rainfall Over East China With a Global Variable-Resolution Model, J. Geophys. Res.-Atmos., 126, e2021JD034823, https://doi.org/10.1029/2021JD034823, 2021. a
Xu, M., Zhao, C., Gu, J., Feng, J., Li, G., and Guo, J.: Appropriately representing convective heating is critical for predicting catastrophic heavy rainfall in 2021 in Henan Province of China, Environ. Res. Commun., 5, 051002, https://doi.org/10.1088/2515-7620/accfec, 2023. a
Yin, J., Gu, H., Liang, X., Yu, M., Sun, J., Xie, Y., Li, F., and Wu, C.: A possible dynamic mechanism for rapid production of the extreme hourly rainfall in Zhengzhou City on 20 July 2021, J. Meteorol. Res., 36, 6–25, https://doi.org/10.1007/s13351-022-1166-7, 2021. a, b
Zhai, P., Zhang, X., Wan, H., and Pan, X.: Trends in total precipitation and frequency of daily precipitation extremes over China, J. Climate, 18, 1096–1108, https://doi.org/10.1175/JCLI-3318.1, 2005. a
Zhang, C., Wang, Y., and Hamilton, K.: Improved representation of boundary layer clouds over the southeast Pacific in ARW-WRF using a modified Tiedtke cumulus parameterization scheme, Mon. Weather Rev., 139, 3489–3513, https://doi.org/10.1175/MWR-D-10-05091.1, 2011. a
Zhang, M. and Meng, Z.: Warm-sector heavy rainfall in southern China and its WRF simulation evaluation: A low-level-jet perspective, Mon. Weather Rev., 147, 4461–4480, https://doi.org/10.1175/MWR-D-19-0110.1, 2019. a
Zhao, C., Leung, L. R., Park, S.-H., Hagos, S., Lu, J., Sakaguchi, K., Yoon, J., Harrop, B. E., Skamarock, W., and Duda, M. G.: Exploring the impacts of physics and resolution on aqua-planet simulations from a nonhydrostatic global variable-resolution modeling framework, J. Adv. Model. Earth Sy., 8, 1751–1768, https://doi.org/10.1002/2016MS000727, 2016. a
Zhao, C., Xu, M., Wang, Y., Zhang, M., Guo, J., Hu, Z., Leung, L. R., Duda, M., and Skamarock, W.: Modeling extreme precipitation over East China with a global variable-resolution modeling framework (MPASv5.2): impacts of resolution and physics, Geosci. Model Dev., 12, 2707–2726, https://doi.org/10.5194/gmd-12-2707-2019, 2019. a, b, c
Zheng, J. and Wang, C.: Influences of three oceans on record-breaking rainfall over the Yangtze River Valley in June 2020, Sci. China Earth Sci., 64, 1607–1618, https://doi.org/10.1007/s11430-020-9758-9, 2021. a