the Creative Commons Attribution 4.0 License.
the Creative Commons Attribution 4.0 License.
 | 21 Jun 2024
Implementing detailed nucleation predictions in the Earth system model EC-Earth3.3.4: sulfuric acid–ammonia nucleation
Carl Svenhag
Moa K. Sporre
Tinja Olenius
Daniel Yazgi
Sara M. Blichner
Lars P. Nieradzik
Pontus Roldin
Representing detailed atmospheric aerosol processes in global Earth system models (ESMs) has proven to be challenging from both a computational and a parameterization perspective. The representation of secondary organic aerosol (SOA) formation and new particle formation (NPF) in large ESMs is generally constructed with low detail to save computational costs. The simplification could result in losing the representation of some processes. In this study, we test and evaluate a new approach for improving the description of NPF processes in the ESM EC-Earth3 (ECE3) without significant additional computational burden. The current NPF scheme in EC-Earth3.3.4 is derived from the nucleation of low-volatility organic vapors and sulfuric acid (H2SO4) together with a homogeneous water–H2SO4 nucleation scheme. We expand the existing schemes and introduce a new lookup table approach that incorporates detailed formation rate predictions through molecular modeling of sulfuric acid–ammonia nucleation (H2SO2–NH3). We apply tables of particle formation rates for H2SO2–NH3 nucleation, including dependence on temperature, atmospheric ion production rate, and molecular cluster scavenging sink. The resulting differences between using the H2SO4–NH3 nucleation in ECE3 and the original default ECE3 scheme are evaluated and compared with a focus on changes in the aerosol composition, cloud properties, and radiation balance. From this new nucleation scheme, EC-Earth3's global average aerosol concentrations in the sub-100 nm sizes increased by 12 %–28 %. Aerosol concentrations above 100 nm and the direct radiative effect (in W m−2) showed only minor differences upon changing of the nucleation scheme. However, the radiative effect from clouds affected by aerosols from the new nucleation scheme resulted in a global decrease (cooling effect) by 0.28–1 W m−2. The modeled aerosol concentrations were compared to observed measurements at various stations. In most cases, the new NPF predictions (H2SO2–NH3) performed better at stations where previous underestimations for aerosol concentrations occurred.
- Article
(14665 KB) - Full-text XML
- BibTeX
- EndNote


Understanding atmospheric particulate matter and its influence on the climate and air quality is a vital scientific question for the outcome of our future planet (Canadell et al., 2021). We generally categorize two types of aerosol particles in the atmosphere based on their emission pathway, either emitted directly as “primary aerosols” or formed indirectly from precursor gases in the air as “secondary aerosols”. From a global climate perspective, the significance of new particle formation (NPF) leading to secondary aerosols has been shown to be broader than previously believed (Merikanto et al., 2009; Dunne et al., 2016). As aerosols in the atmosphere can scatter or absorb radiation in various wavelengths, additional secondary aerosols could promote planetary cooling or warming through the direct aerosol radiative effect (DRE). Furthermore, the secondary aerosols can influence the formation, properties, and lifetime of clouds, changing the reflective ability of clouds for incoming sunlight radiation, potentially cooling the planet (Twomey, 1974; Albrecht, 1989).
Secondary aerosols can form by condensation of vapors on pre-existing particles or through new particle formation (NPF). Studies on the radiative outcome and other climate effects caused by secondary aerosols have improved in recent years but are still highly uncertain (Shrivastava et al., 2017; Canadell et al., 2021). NPF occurs through gas-phase molecules forming molecular clusters that grow further into larger particles by condensation of low-volatility vapors. While understanding of the chemical species that drive the initial clustering processes has improved significantly during the last decade, the exact mechanisms and their effects on a global scale continue to be highly uncertain. A challenge in understanding the future extent of secondary aerosol climate effects is that the formation process in the atmosphere for aerosols is itself influenced by its ambient conditions (e.g., temperature and humidity). Outlining the correct conditions for secondary particle formation globally is crucial for quantifying the various feedback mechanisms involved and the net future effects of climate change (Forster et al., 2021).
Recent research indicates that low-volatility organic compounds (LVOCs) have an important role in the growth of aerosols with sizes starting from 1 nm (Paasonen et al., 2010; Kirkby et al., 2011; Ehn et al., 2014; Riccobono et al., 2014; Tröstl et al., 2016; Öström et al., 2017; Roldin et al., 2019). Volatile organic compounds (VOCs) in the atmosphere can exist in many different molecular constructions, and model estimates show that up to 85 % of VOCs originate from natural sources, labeled biogenic VOCs (BVOCs) (Lamarque et al., 2010; Guenther et al., 2012). In many Earth system models, BVOCs (and VOCs) are typically reduced to only two dominating species categorized by their volatility: semi-volatile (SVOC) and extremely low volatile (ELVOC) (Sporre et al., 2020). These are two BVOC species that are primarily formed by the oxidation of two naturally emitted precursors, isoprene and monoterpene. Experimental studies show that BVOCs can heavily influence the formation and growth of secondary organic aerosols (SOAs) in the atmosphere (Kulmala et al., 2004, 2013; Dunne et al., 2016). Most of the ambient BVOC gases will end up growing pre-existing particles by condensation, but some may also contribute to NPF. However, the estimations of BVOCs' net contribution to the global SOA budget are not well understood (Tsigaridis et al., 2014; Shrivastava et al., 2017).
To derive global-scale estimations for secondary particle formation and SOA budgets and their climate effects, we can use the application of Earth system models (ESMs). Many ESMs have parameterization for particle formation rates derived exclusively from binary homogenous nucleation and condensation of atmospheric sulfuric acid (H2SO4) and water in the gas phase (Vehkamäki, 2002). This method has yielded general underestimations for modeled results in boundary layer aerosol concentrations compared to observations (Mann et al., 2012). More recent model development has included the extremely low-volatility organic compounds (ELVOCs) in the NPF schematics and chemistry with strong growth (survival) dependency on the BVOCs (Kerminen and Kulmala, 2002; Bergman et al., 2022). However, experimental studies and detailed modeling have shown that atmospheric gas-phase ammonia (NH3) also plays an essential role in H2SO4-driven molecular clustering and cluster growth (Dunne et al., 2016; Roldin et al., 2019). Ammonia is predominantly emitted from agricultural sources and is not included in all ESM chemistry models, which obstructs its participation in the potential NPF schemes.
In this study, we use the ESM EC-Earth3.3.4 (ECE3), which includes atmospheric concentrations of ammonia. We implement a new scheme for ESM boundary layer NPF based on detailed modeling of molecular cluster formation kinetics with quantum-chemistry-derived input data for cluster evaporation (Olenius et al., 2013). This high-level molecular modeling approach has become a standard tool in NPF studies and has been used for detailed representations of particle formation applied in previous box models and column model studies (Roldin et al., 2019; Wollesen de Jonge et al., 2021). In this study, we test and evaluate the global application of this approach by incorporating the detailed formation rate predictions through a lookup table interface (Yazgi and Olenius, 2023b). Due to the high computational load of running a molecular cluster simulation fully coupled with EC-Earth, we utilize this lookup table approach for optimal performance. The EC-Earth3 model version in this study is part of the Coupled Model Intercomparison Project (CMIP), and we wish to further evaluate and improve the EC-Earth3-AerChem configuration (van Noije et al., 2021). The previous nucleation rate scheme for NPF in EC-Earth3 is based on Riccobono et al. (2014), which approximates the rate as a function of gas-phase ELVOC and H2SO4 concentrations. In this study, we evaluate the previous scheme against the new lookup tables of H2SO4–NH3 particle formation rates calculated using two different input quantum chemistry data sets for cluster evaporation. These two new table data sets are known to have tendencies towards under- and overpredictions and can thus be applied to assess the lower- and upper-limit effects of H2SO4–NH3 nucleation (Kürten et al., 2016; Besel et al., 2020). Since studies also support the mechanism of pure organic H2SO4 (without NH3) nucleation (Metzger et al., 2010; Riccobono et al., 2014), we include a fourth simulation with the lower-biased H2SO4–NH3 nucleation scheme together with the default Riccobono ELVOC–H2SO4 nucleation. We evaluate the resulting aerosol size number distributions from the four simulated EC-Earth3 schemes and compare them with observed measurements from multiple ground-based field stations. This study also compares the resulting changes in the modeled cloud characteristics and radiative balance from using the new NPF scheme.
2.1 EC-Earth3
In this study, we use EC-Earth3.3.4 as the EC-Earth3-AerChem configuration, which includes the global circulation model (GCM) Integrated Forecasting System (IFS) on cycle 36r4 coupled with chemistry from Tracer Model 5, massively parallel (TM5-MP) version 1.2 (Krol et al., 2005; van Noije et al., 2014; Williams et al., 2017). The IFS GCM includes the integrated land-surface model H-TESSEL (Balsamo et al., 2009). The models exchange information through the coupler OASIS3-MCT version 3.0 (Craig et al., 2017), with the coupling frequency between IFS and TM5 set to 6 h. The IFS model time step was set to 45 min with instantaneous output averaged into 6-hourly values, and TM5 had 1 h time steps with monthly averaged output. The IFS meteorology was nudged against ERA-Interim divergence, vorticity (U and V winds), and surface pressure, with a relaxation time of 6 h. The nudging of these parameters will force homogeneity in general synoptic weather for all simulations. For the horizontal resolutions, IFS operated on a T255 (0.7°) spectral truncation with an N128 reduced Gaussian grid and TM5 on a 2° × 3° (latitude × longitude) grid. Vertically, IFS and TM5 utilize the same represented hybrid sigma pressure levels, where IFS operates on 91 layers, while TM5 uses a lower resolution of 34 layers (excluding the top IFS layer). The EC-Earth-AerChem configuration is atmosphere-only with sea-ice content and sea-surface temperature inputs from the AMIP reader. A more detailed description of all model couplings and components is given in van Noije et al. (2014, 2021). A known issue concerning the exclusion of atmospheric methane sulfonic acid (MSA) in the EC-Earth3.3.4 version was corrected in this study.
2.2 Aerosol module M7 in TM5
The TM5-MP model represents the aerosol mass and number concentrations in the M7 module as seven lognormal modes (Vignati et al., 2004), with four “mixed” water-soluble nucleation (NUS), Aitken (AIS), accumulation (ASC), and coarse (COS) modes and three insoluble Aitken (AII), accumulation (ACI), and coarse (COI) modes. The aerosol lognormal distribution has fixed geometric standard deviations of 1.59 for all modes except the coarse mode with 2.0. The dry-radius size ranges for the modes are set as rnucl<5 nm, nm, nm, and rcoarse>500 nm. The six categorized species distributed (variously) over the seven modes are sea salt (SS), dust (DU), black carbon (BC), sulfate (SO4), primary organic aerosol (POA), and secondary organic aerosols (SOAs). For the water-soluble accumulation mode, there is additional condensation of methane sulfonic acid (MSA) and ammonium nitrate (AN), which can alter the optical properties and mass of the soluble accumulation mode. The optical characteristics of each species in the model are described by Mie theory lookup tables (Aan de Brugh et al., 2011). For more details on M7 aerosol modal dynamics and species, see Vignati et al. (2004) and van Noije et al. (2014).
2.3 Secondary aerosol formation
The TM5-MP chemistry in EC-Earth3 uses two BVOC emission species for non-methane VOCs that oxidize in the chemistry scheme: monoterpene (C10H16) and isoprene (C5H8). The two BVOCs have prescribed model inputs from monthly 0.5° × 0.5° emissions based on the MEGAN-MACC inventory (Sindelarova et al., 2014). The monthly emissions are then balanced in TM5 to a diurnal distribution formula for the 1 h time step. Subsequently, the BVOCs are oxidized from specified reaction yields with ozone (O3) or hydroxyl radicals (OH) into SVOC (C10H16O6) or ELVOC (C10H16O7). Rate coefficients are based on Atkinson et al. (2006), and the molar yields for producing ELVOCs and SVOCs are tabulated in Jokinen et al. (2015). Both VOC groups can condense to the three larger soluble modes and the insoluble Aitken mode. Furthermore, the ELVOCs are included in the default NPF scheme and for the growth of nucleated particles up to 5 nm in diameter through condensation in all schemes (including the CLUST cases) through the Kerminen and Kulmala (KK) factor of survival (Kerminen and Kulmala, 2002). There are two nucleation rates in the default NPF scheme in TM5. The first, JRiccobono, is the nucleation based on Eq. (1) from semi-empirical Riccobono et al. (2014) parameterization for particle formation rate at a diameter of 1.7 nm:
where cm6 s−1 is a constant empirical factor, and the two species [H2SO4] and [ELVOC] represent the gas-phase concentrations. The second nucleation rate in TM5 is the binary homogeneous nucleation (BHN) of water and H2SO4 following Vehkamäki (2002). The BHN pathway is included in the configurations with the new H2SO4–NH3 scheme. The KK factor is used to obtain the fraction of particles surviving growth to 5 nm for all the schemes (H2SO4–H2O, H2SO4–NH3, and H2SO4–ELVOC, for which the initial nucleation rates are given at sizes of ca. 1.0, 1.1, and 1.7 nm in diameter, respectively) by condensational growth from available H2SO4 and ELVOC. The 5 nm particles are then partitioned into the modal system of M7. See the schematic figure for the representation of the initial growth in Fig. A1. The growth to 5 nm and the formation of any new particles in TM5 are thereby limited by the available gas-phase ELVOC and H2SO4; if the concentration of one compound is insufficient the other compound (if available) will account for the remaining growth to 5 nm diameter. The full growth parameterization is given in Bergman et al. (2022).
2.4 Radiation and cloud interactions for aerosols
The activation of cloud droplets from aerosols is described by the activation scheme in Abdul-Razzak and Ghan (2000), which is a specific parameterization for modal aerosol models such as TM5-MP (M7). The soluble aerosol mode properties and supersaturation (derived from updraft velocity) determine the cloud droplet number concentrations (CDNCs) of stratiform clouds in IFS, where the CDNC has a minimum of 30 cm−3 (van Noije et al., 2021). The effective liquid droplet radii are subsequently determined by the CDNC and the liquid water content in the cloud from the activation scheme in Martin et al. (1994) and have a radius set between 4–30 µm. The cloud-lifetime effect is then determined by these parameters following the autoconversion of liquid cloud droplets to rain. The effective cloud radius is used for the calculation of the cloud radiative scattering in each IFS model grid; see further description in van Noije et al. (2021) and Wyser et al. (2020).
2.5 Lookup tables of H2SO4–NH3 nucleation rates
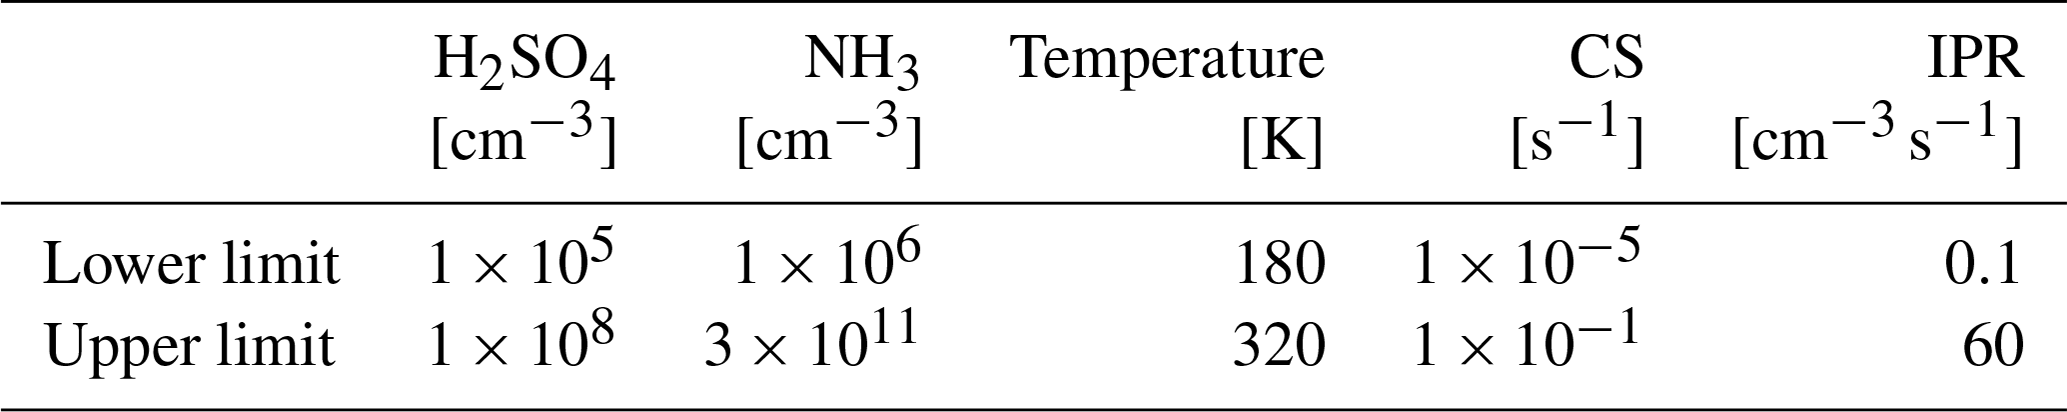
We implement a new lookup table approach to incorporate particle formation rates from molecular modeling by applying the J-GAIN tool (Formation rate lookup table Generator And Interpolator; Yazgi and Olenius, 2023b, 2021), which includes automatic routines for table generation and interpolation. The table generator calculates formation rates by molecular cluster dynamics modeling through an embedded application of the Atmospheric Cluster Dynamics Code (ACDC) cluster kinetics solver (Olenius, 2021). Tables are generated for user-defined input for the chemical species and the ambient conditions that determine the rate, including, e.g., the concentrations of the precursor vapors and the temperature (for more details, see Yazgi and Olenius, 2023b). This yields high-resolution formation rate data over a wide spectrum of atmospheric conditions. The chemistry input includes cluster compositions and quantum chemical thermodynamics data for calculating cluster evaporation (Elm et al., 2020; Olenius et al., 2013). The table interpolator applies multivariate interpolation to determine formation rates for given ambient conditions from user-defined tables. In this work, we generate formation rate tables for sulfuric acid and ammonia (H2SO4–NH3), which is a globally significant particle formation mechanism according to current understanding (e.g., Gordon et al., 2017). The rates are calculated as a function of [H2SO4], [NH3], temperature, cluster scavenging sink (CS), and atmospheric ion production rate (IPR), considering both electrically neutral and ion-mediated pathways (as detailed in, e.g., Olenius et al., 2013). In order to assess uncertainties related to the quantitative formation rate predictions, we use two alternative data sets computed with different quantum chemistry methods: a recent data set by the state-of-the-art method DLPNO-CCSD(T)/aug-cc-pVTZ//ωB97X-D/6-31++G(d,p), here referred to as CLUST-Low (Besel et al., 2020)), and a previous data set by the RICC2/aug-cc-pV(T+d)Z//B3LYP/CBSB7 method, here referred to as CLUST-High (Olenius et al., 2013). These data sets can be expected to provide a realistic range for the predictions, as the CLUST-Low (DLPNO) method may underpredict the quantitative rate values, while CLUST-High (RICC2) has a tendency towards overprediction (Besel et al., 2020; Kürten et al., 2016; Carlsson et al., 2020). We couple the table interpolator to the TM5 component and conduct simulations with either CLUST-High- or CLUST-Low-based formation rates for ECE3. The H2SO4 and NH3 concentrations covered by the lookup table have a restricted range (Table 1) where the routine returns zero nucleation rate if one or both of the concentrations are below the limits. For the inputs IPR, CS, and temperature, values are set to the maximum or minimum table value if the limits are exceeded. The wide value ranges are set to cover the variety of global conditions in the simulations.
The ion-pair production (IPR) from galactic cosmic rays (GCRs) is determined from an additional two-parameter lookup table based on Yu et al. (2019) added to the TM5 module for this study. This table reads the model pressure (203 layers) and magnetic latitude (91 latitudes) and calculates GCR based on calculations from Usoskin and Kovaltsov (2006). The IPR resulting from soil radon in this function is calculated from the model land fraction and altitude, adapted from Yu et al. (2019).
Table 1The H2SO4 and NH3 nucleation rate lookup table ranges for variables used in this study. Values outside the H2SO4 and NH3 lower limits return a zero nucleation rate, and the other three variables return the max or min value given here if limits are exceeded.
2.6 Simulations
We include four separate simulations for EC-Earth3.3.4 over a 5-year period from 2014–2018 with a 1-year spin-up period. For input emissions we use CMIP6 (Feng et al., 2020) data sets, with a “historical” scenario for 2014 and the SSP3-7.0 scenario from 2015 onwards. This follows the emission standards in EC-Earth-AerChem simulations for CMIP6 given in van Noije et al. (2021). The four simulations in this study are referred to as (1) control, (2) CLUST-High, (3) CLUST-Low, and (4) CLUST-Low+Riccobono. The control case is run with the default setup for EC-Earth3-AerChem with the nucleation rate based on Riccobono et al. (2014). For the two CLUST (high and low) cases, we replaced the nucleation scheme based on Riccobono et al. (2014) with the CLUST lookup table function. CLUST-High represents the use of the RICC2 version of the lookup table, and CLUST-Low is the DLPNO version described in Sect. 2.5. The fourth simulation is set up with the CLUST-Low (H2SO4–NH3) table nucleation rate coupled with the default Riccobono et al. (2014) nucleation rate from ELVOC–H2SO4 nucleation.
2.7 Ground station observations
For observation data in this study, we used the EBAS online data service for retrieving data sets of particle concentrations at measurement stations (Tørseth et al., 2012; Franco et al., 2022). The majority of these station data sets are situated in Europe, and coverage outside this region is scarce. The particle number size distribution is measured using SMPS and DMPS instrumentation with 10 min sampling intervals. The observations are then averaged to monthly mean values for uniformity with the model output. Months with measured data coverage below 50 % are excluded. The measured minimum diameter sizes are limited to around 10 nm for the particle samplers, with an exception for SMEAR II and Hyltemossa station (3 nm). The amount of EBAS data within the 2014–2018 period is moderate, and a tabulated description of the station measurements is given in Table A1. The selected stations in this study were chosen in order to obtain aerosol concentrations at different marine, urban, and rural environments at various altitudes.
2.8 Model post-process methods
As mentioned above, the IFS model output is a monthly average. For the IFS cloud characteristics, CDNC and effective liquid radius (reff), we apply a monthly weighted average for the 6-hourly output with respect to “cloud time” (IFS output variable) in each individual grid cell. This weighted average accounts for the actual lifetime of clouds in IFS spatially and temporally. For the IFS simulations, we use the “double call to radiation” diagnostic function (Hogan and Bozzo, 2018), which gives two separate radiative fluxes with (and without) an “aerosol-free” atmosphere for calculating radiative differences following Ghan (2013). We can then represent the top-of-atmosphere (TOA) net (short- and longwave) radiative flux only influenced by aerosols in a “clear-sky” model environment, here referred to as the direct aerosol radiative effect (DRE). Similarly, the cloud radiative effect (CRE) is calculated from the clear-sky (aerosol-free) condition subtracted from the “all-sky” (aerosol-free) condition. See van Noije et al. (2021) for the tabulated optical properties of all aerosol species in EC-Earth3 used for the radiative fluxes. In this study, for results classified as “near surface”, we use the bottom three model layers from TM5 output (chemistry and aerosol output). This is to capture the inhomogeneity seen in the bottom three model layers in Fig. 2a, d for sub-100 nm diameter aerosols and H2SO4 (Fig. A2) caused by sink processes in the model surface layer. For near-surface values from the IFS output of CDNC and reff, we use an average (weighted) of data points below an 850 hPa cutoff layer. The aerosol modal output from TM5-M7 is remapped into sectional bins to compare with the observations in units of dNdlog Dp.
The resulting near-surface mean particle formation rate (number of 5 nm diameter particles formed per unit volume and time) for the four EC-Earth simulations is shown in Fig. 1. The highest formation rate for all cases occurs in the regions with anthropogenic influence, with the greatest values in southern and eastern Asia. The CLUST-Low+Riccobono case in Fig. 1d shows the resulting particle formation rate using both H2SO4–NH3 nucleation and ELVOC–H2SO4 nucleation. Figure 1 shows that the near-surface formation rate for CLUST-Low is lower compared to the default control case, even in high-emission regions like China and India. The CLUST-High nucleation scheme has the highest mean particle formation rate, and compared with the control case it gives increased rates at higher latitudes but lower rates in the tropical regions. Some tropical regions have higher BVOC concentrations with lower NH3 and H2SO4 concentrations, so here ELVOC–H2SO4 near-surface nucleation dominates in the model. The CLUST scheme cases introduce near-surface particle formation over the ocean from H2SO4–NH3 nucleation (seen in Fig. 1). This was negligible () in the previous default model scheme due to the absence of marine ELVOCs and low BHN. However, ECE3 has gas-phase ammonia and sulfuric acid present in these marine regions as ammonia can be transported from land air masses and primary marine emissions sources, which gives boundary layer H2SO4–NH3 nucleation from the CLUST scheme.
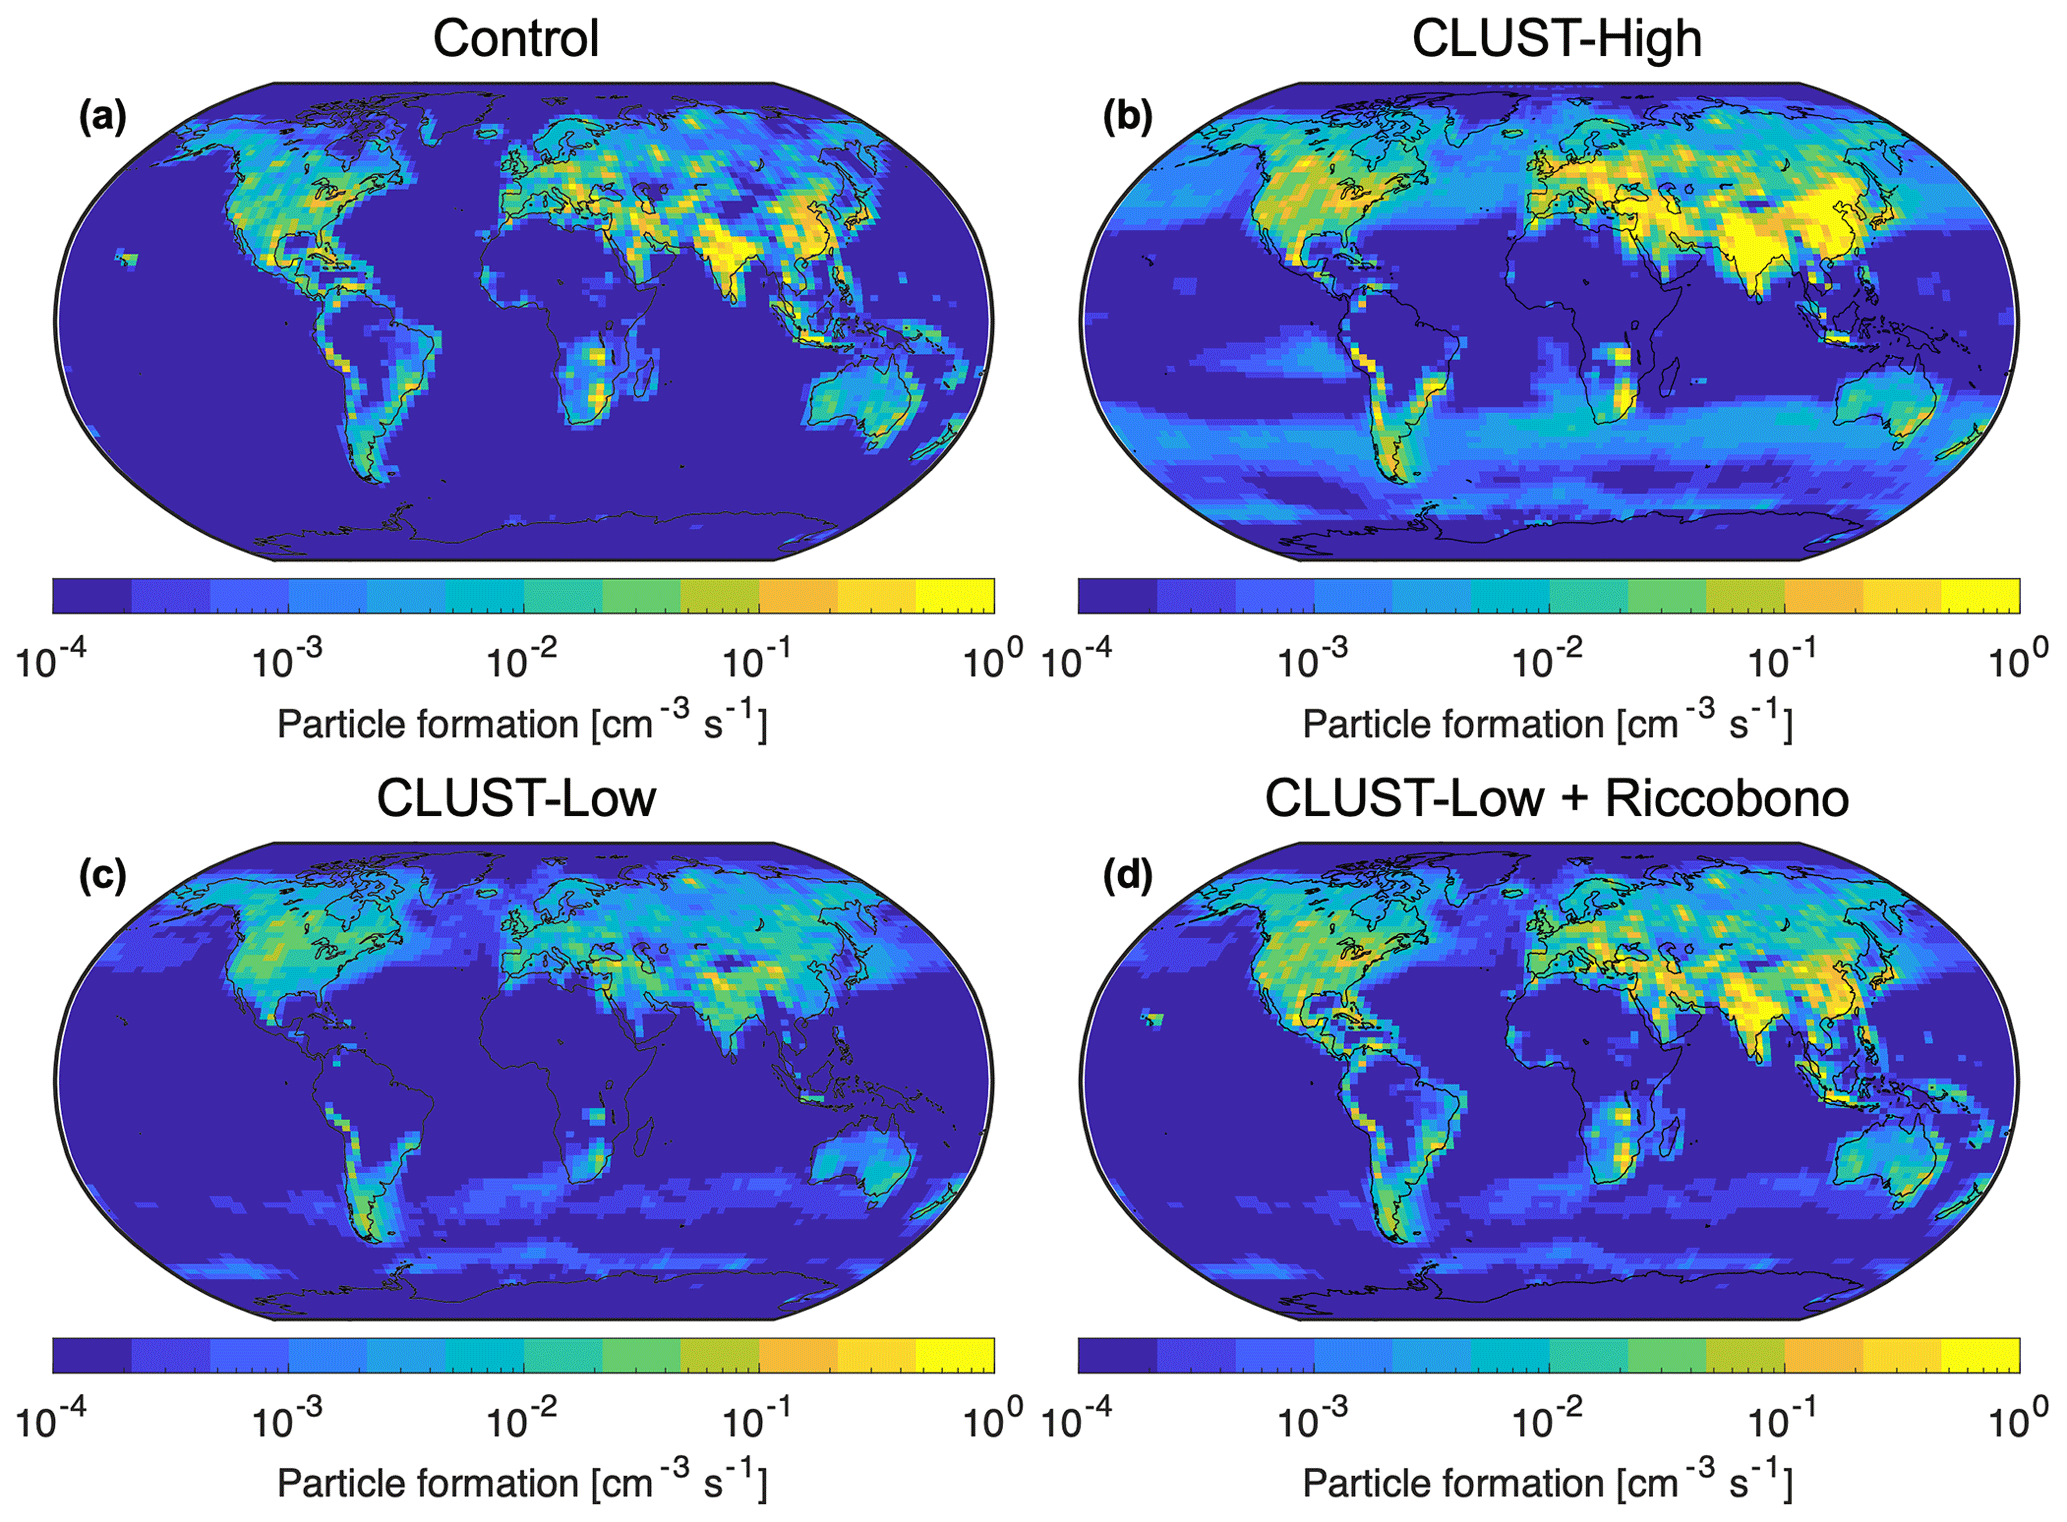
Figure 1The 5-year mean of 5 nm diameter aerosol particle formation rate (post-KK survivability) for the control run (a) and the CLUST-High (b), CLUST-Low (c), and CLUST-Low+Riccobono (d) cases at the near-surface level.
3.1 Global aerosol concentrations
The global mean vertical profiles for aerosol number concentrations for the four simulations can be seen in Fig. 2, where CLUST-High produces the highest particle formation rate profile, subsequently resulting in the highest aerosol number concentrations in the nucleation and Aitken modes. The mean profiles of CLUST-Low and CLUST-Low+Riccobono's soluble nucleation (NUS) and Aitken (AIS) mode aerosol number concentrations are substantially lower than CLUST-High but still higher than the control run. Figure 2c shows that the modeled global mean soluble accumulation mode gives similar mean profile values for all four simulations and has a minor response to the altered nucleation scheme. Furthermore, in the upper troposphere and lower stratosphere, the BHN from water and H2SO4 dominates, which results in less modeled differences for the particle formation rates and the aerosol concentrations at these altitudes. The resulting change in the global average concentration (total atmosphere) of sub-100 nm aerosols was an increase of 27.8 % for CLUST-High, 11.7 % for CLUST-Low, and 12.6 % for CLUST-Low+Riccobono. In the surface layer, the mean particle formation rate in CLUST-Low is lower compared to the control run (by a factor of 10) but has a higher nucleation mode concentration. This is likely due to more aerosols being transported down from the overlying model layers where CLUST-Low has greater particle formation. The nucleation mode could also be reduced if the control case experiences regional removal effects (e.g., high heterogeneous coagulation) that differ from CLUST-Low. Figures A4 and A5 show the different global NUS and AIS concentrations at near surface for the four simulations.
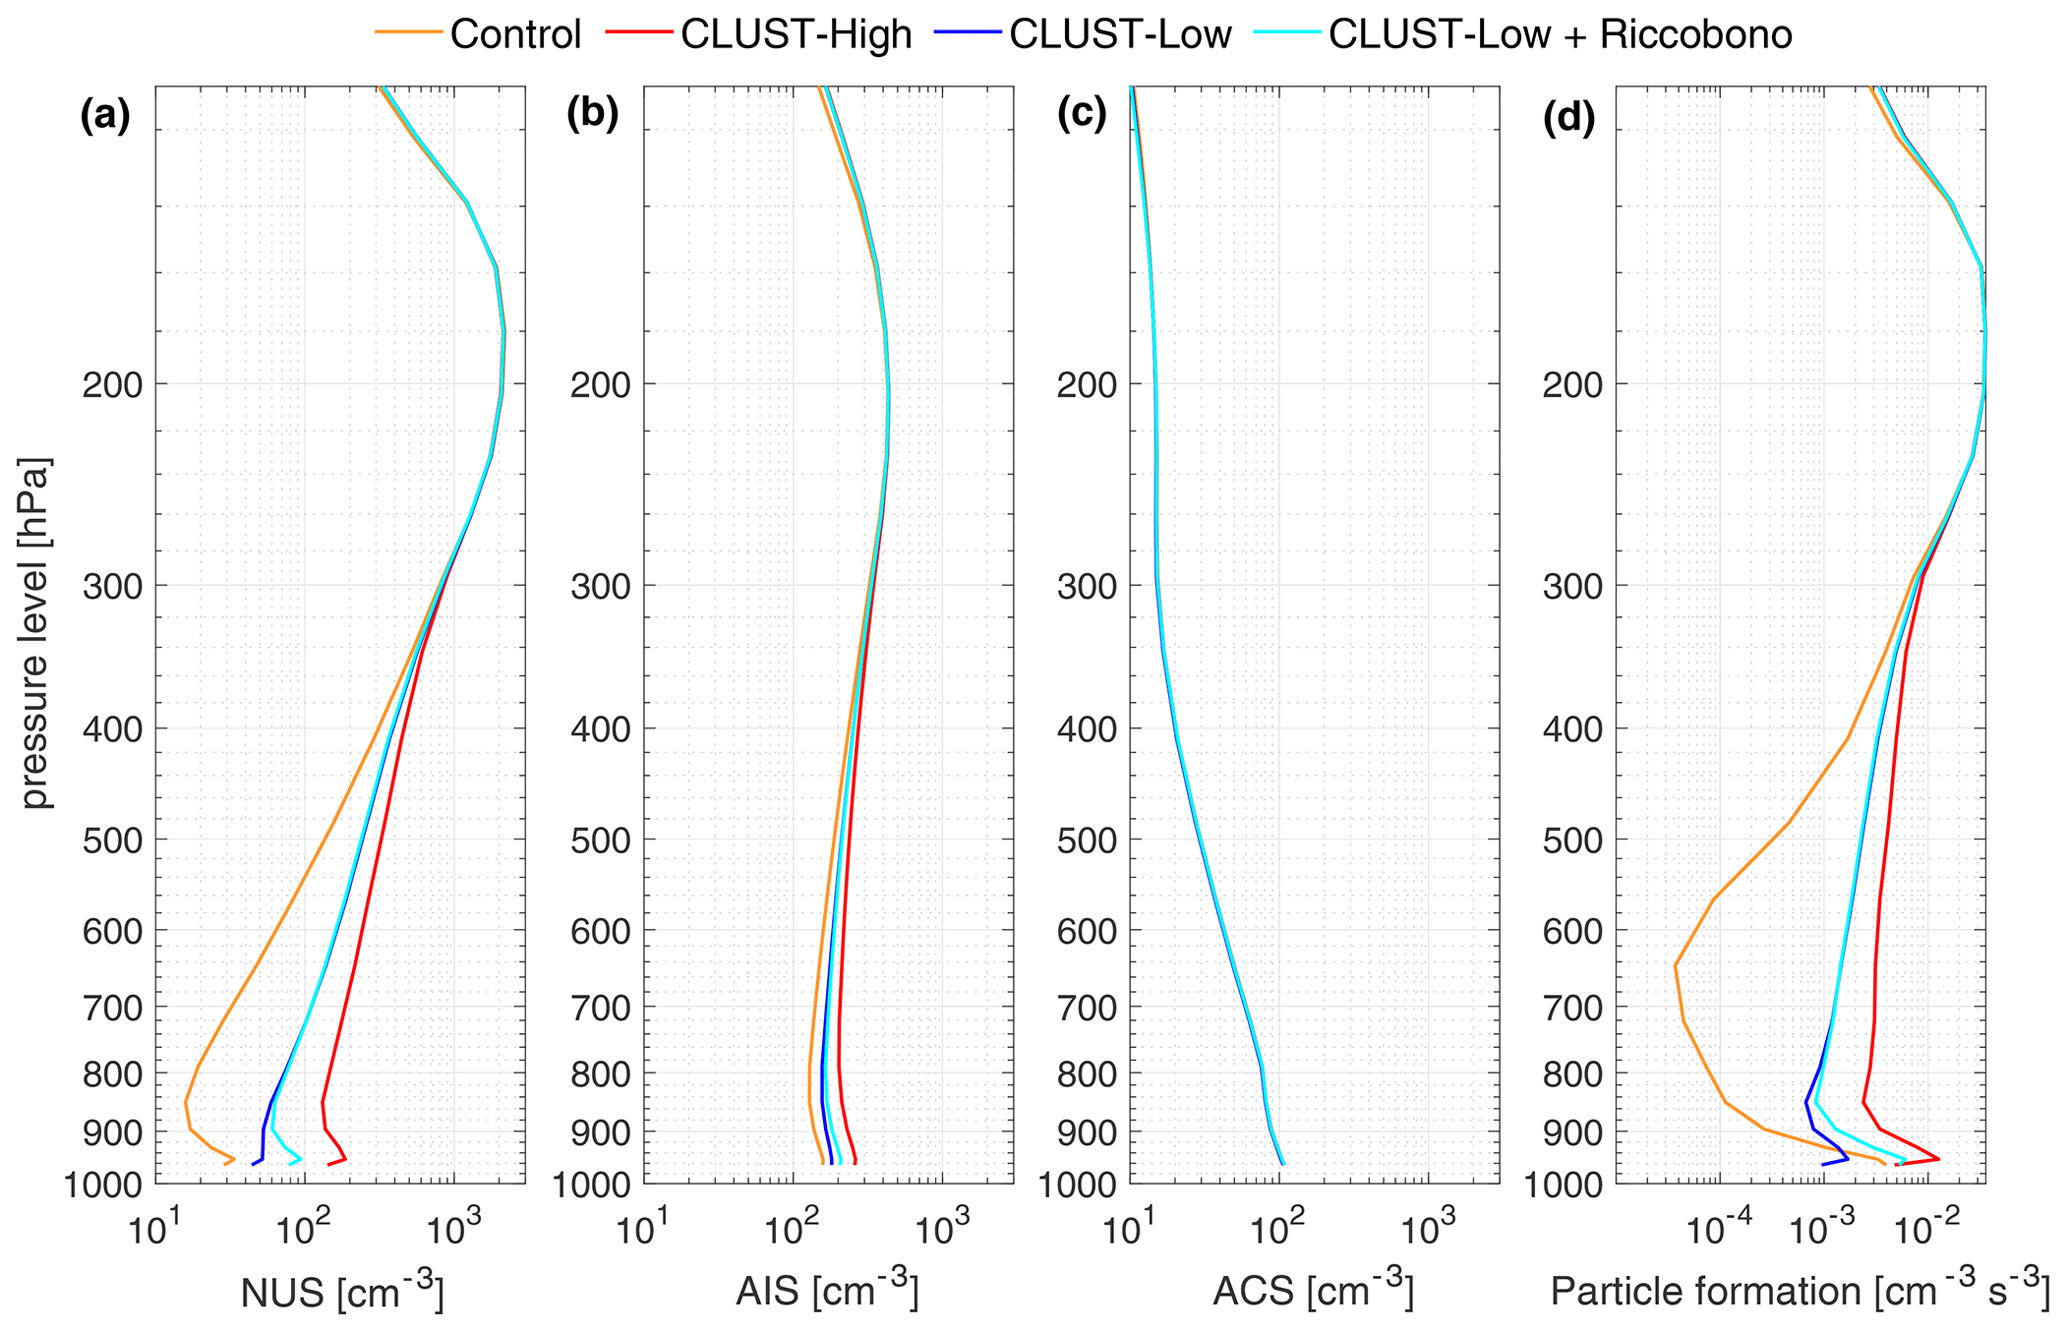
Figure 2Modeled global mean profile for aerosol number concentrations for the soluble nucleation (NUS), Aitken (AIS), and accumulation (ACS) modes and particle formation rate of 5 nm aerosols.
The vertical profile in Fig. 2d shows the significant increase in the global mean particle formation rate in the free troposphere for the three new CLUST scheme simulations. This could be explained by three potential changes made in our new parameterization. Firstly, it could be attributed to the introduced dependency of the nucleation rate in CLUST on ion-pair production, which increases with altitude. Secondly, the effect of decreasing temperature with altitude leads to an increasing nucleation rate from the CLUST lookup table, as the default scheme is not temperature dependent. Lastly, the rate of decreasing atmospheric ammonia concentrations with altitude is lower than the decreasing rate of ELVOC concentrations in the model shown in Fig. A2.
Figure 3 shows the relative and absolute differences in the sub-100 nm aerosol concentrations between the CLUST schemes and the default control. The zonal mean shows a global aerosol increase in all cases with the exception of a tropical decrease in the lower troposphere for the CLUST-Low case. The most dominant zonal increases in the Northern Hemisphere and mid-latitudes were expected for the absolute difference in Fig. 3a, b, c as they are the dominant regions of anthropogenic emissions of NH3 and H2SO4. The vertical distribution of sub-100 nm aerosols shows the difference follows a similar zonal pattern, with the exception of CLUST-High differences (Fig. 3d), where a spike in the difference occurs in the 800–500 hPa layer.
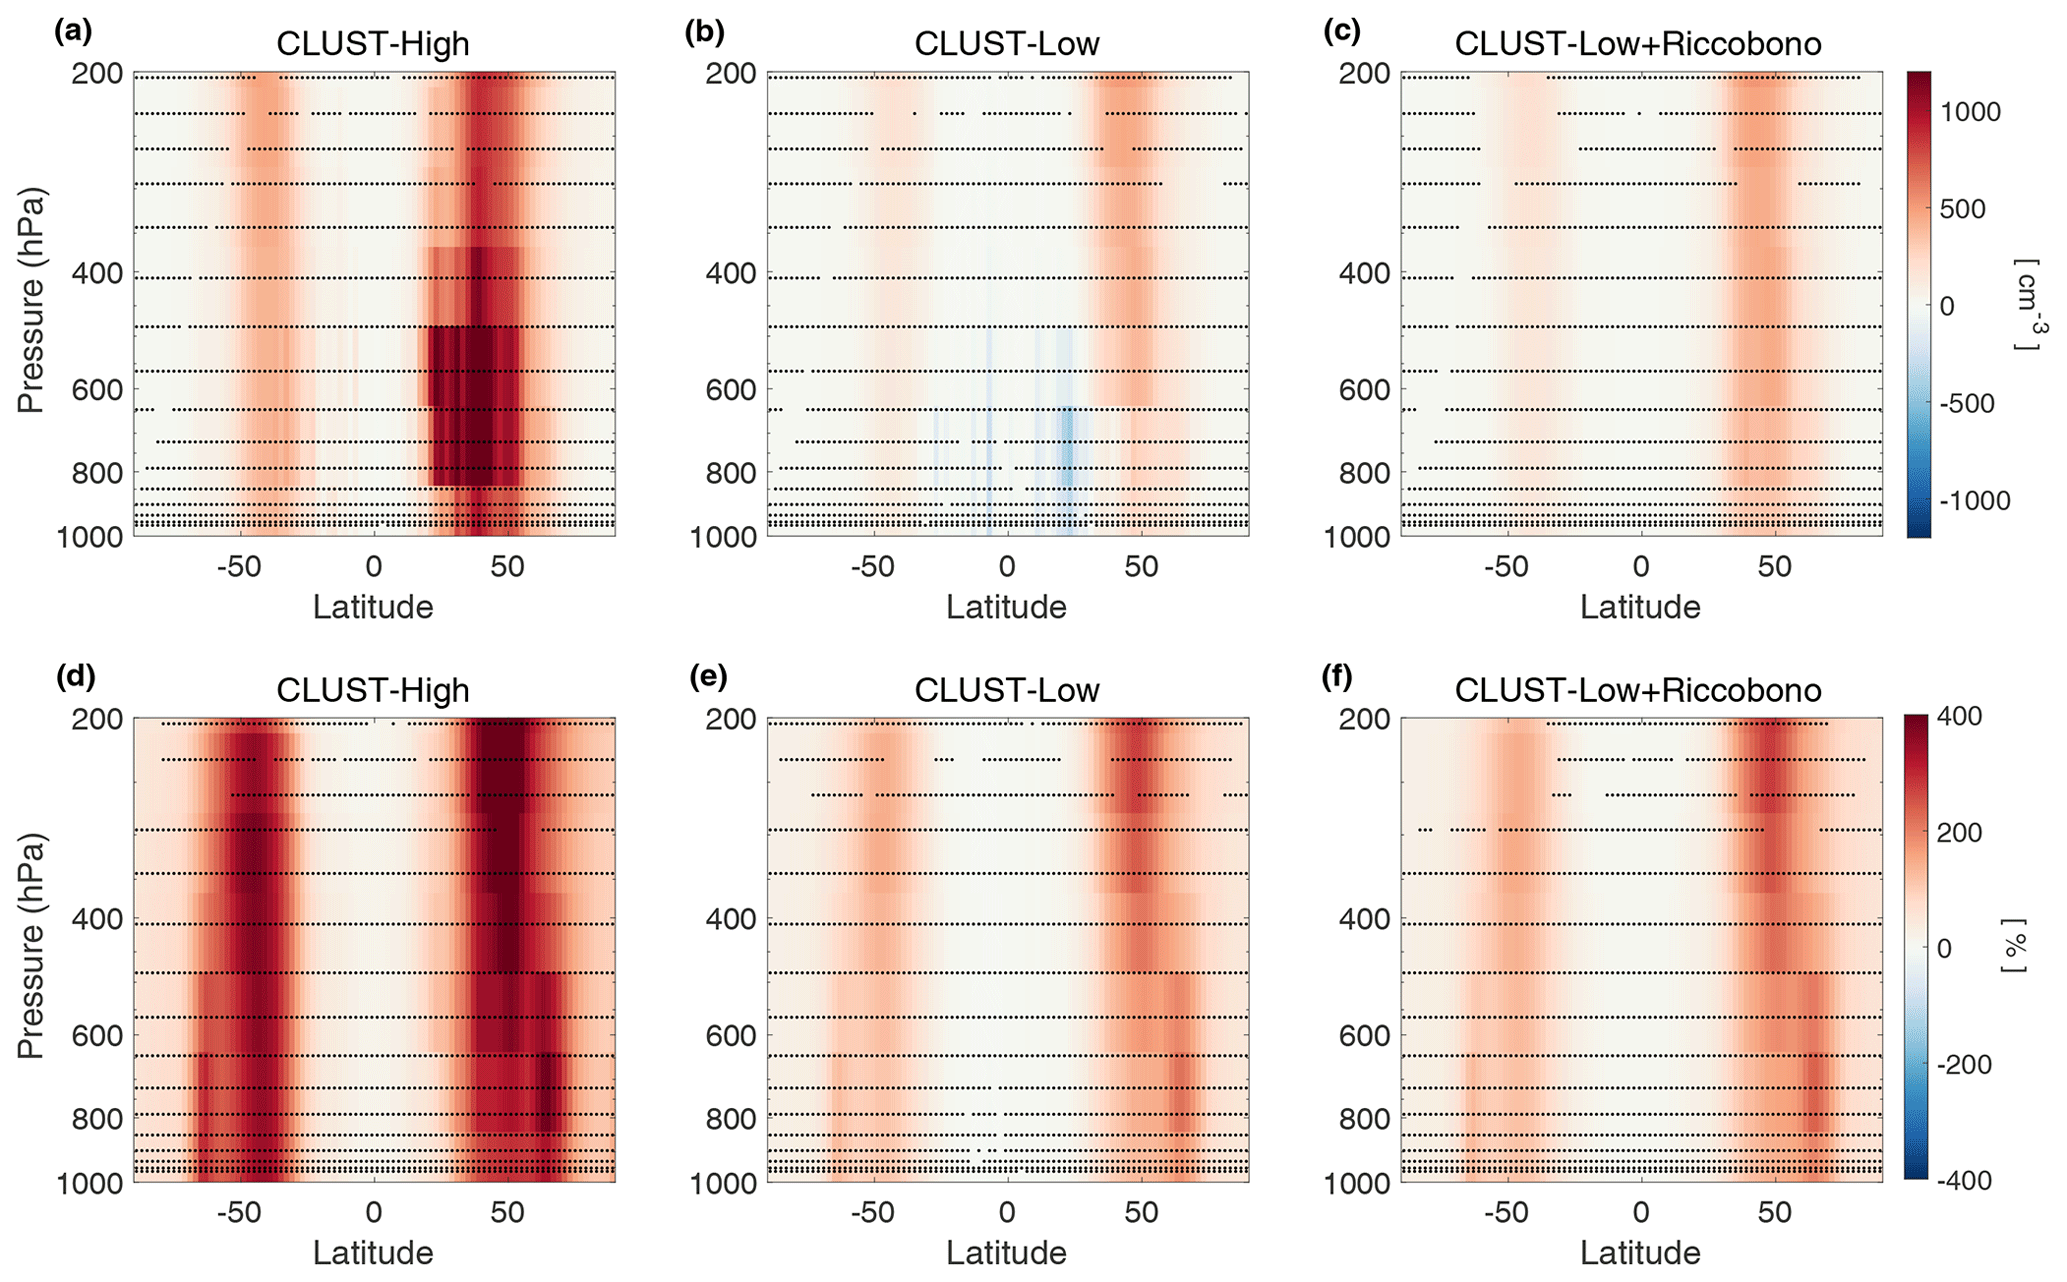
Figure 3The CLUST cases – control run difference in the zonal mean profile for sub-100 nm aerosol number concentrations (total sum of NUS, AIS, and AII modes), with the absolute difference (a, b, c) and the relative difference (d, e, f), showing Student's t-test significance (95 %) as dots.
3.2 Modeled station observations
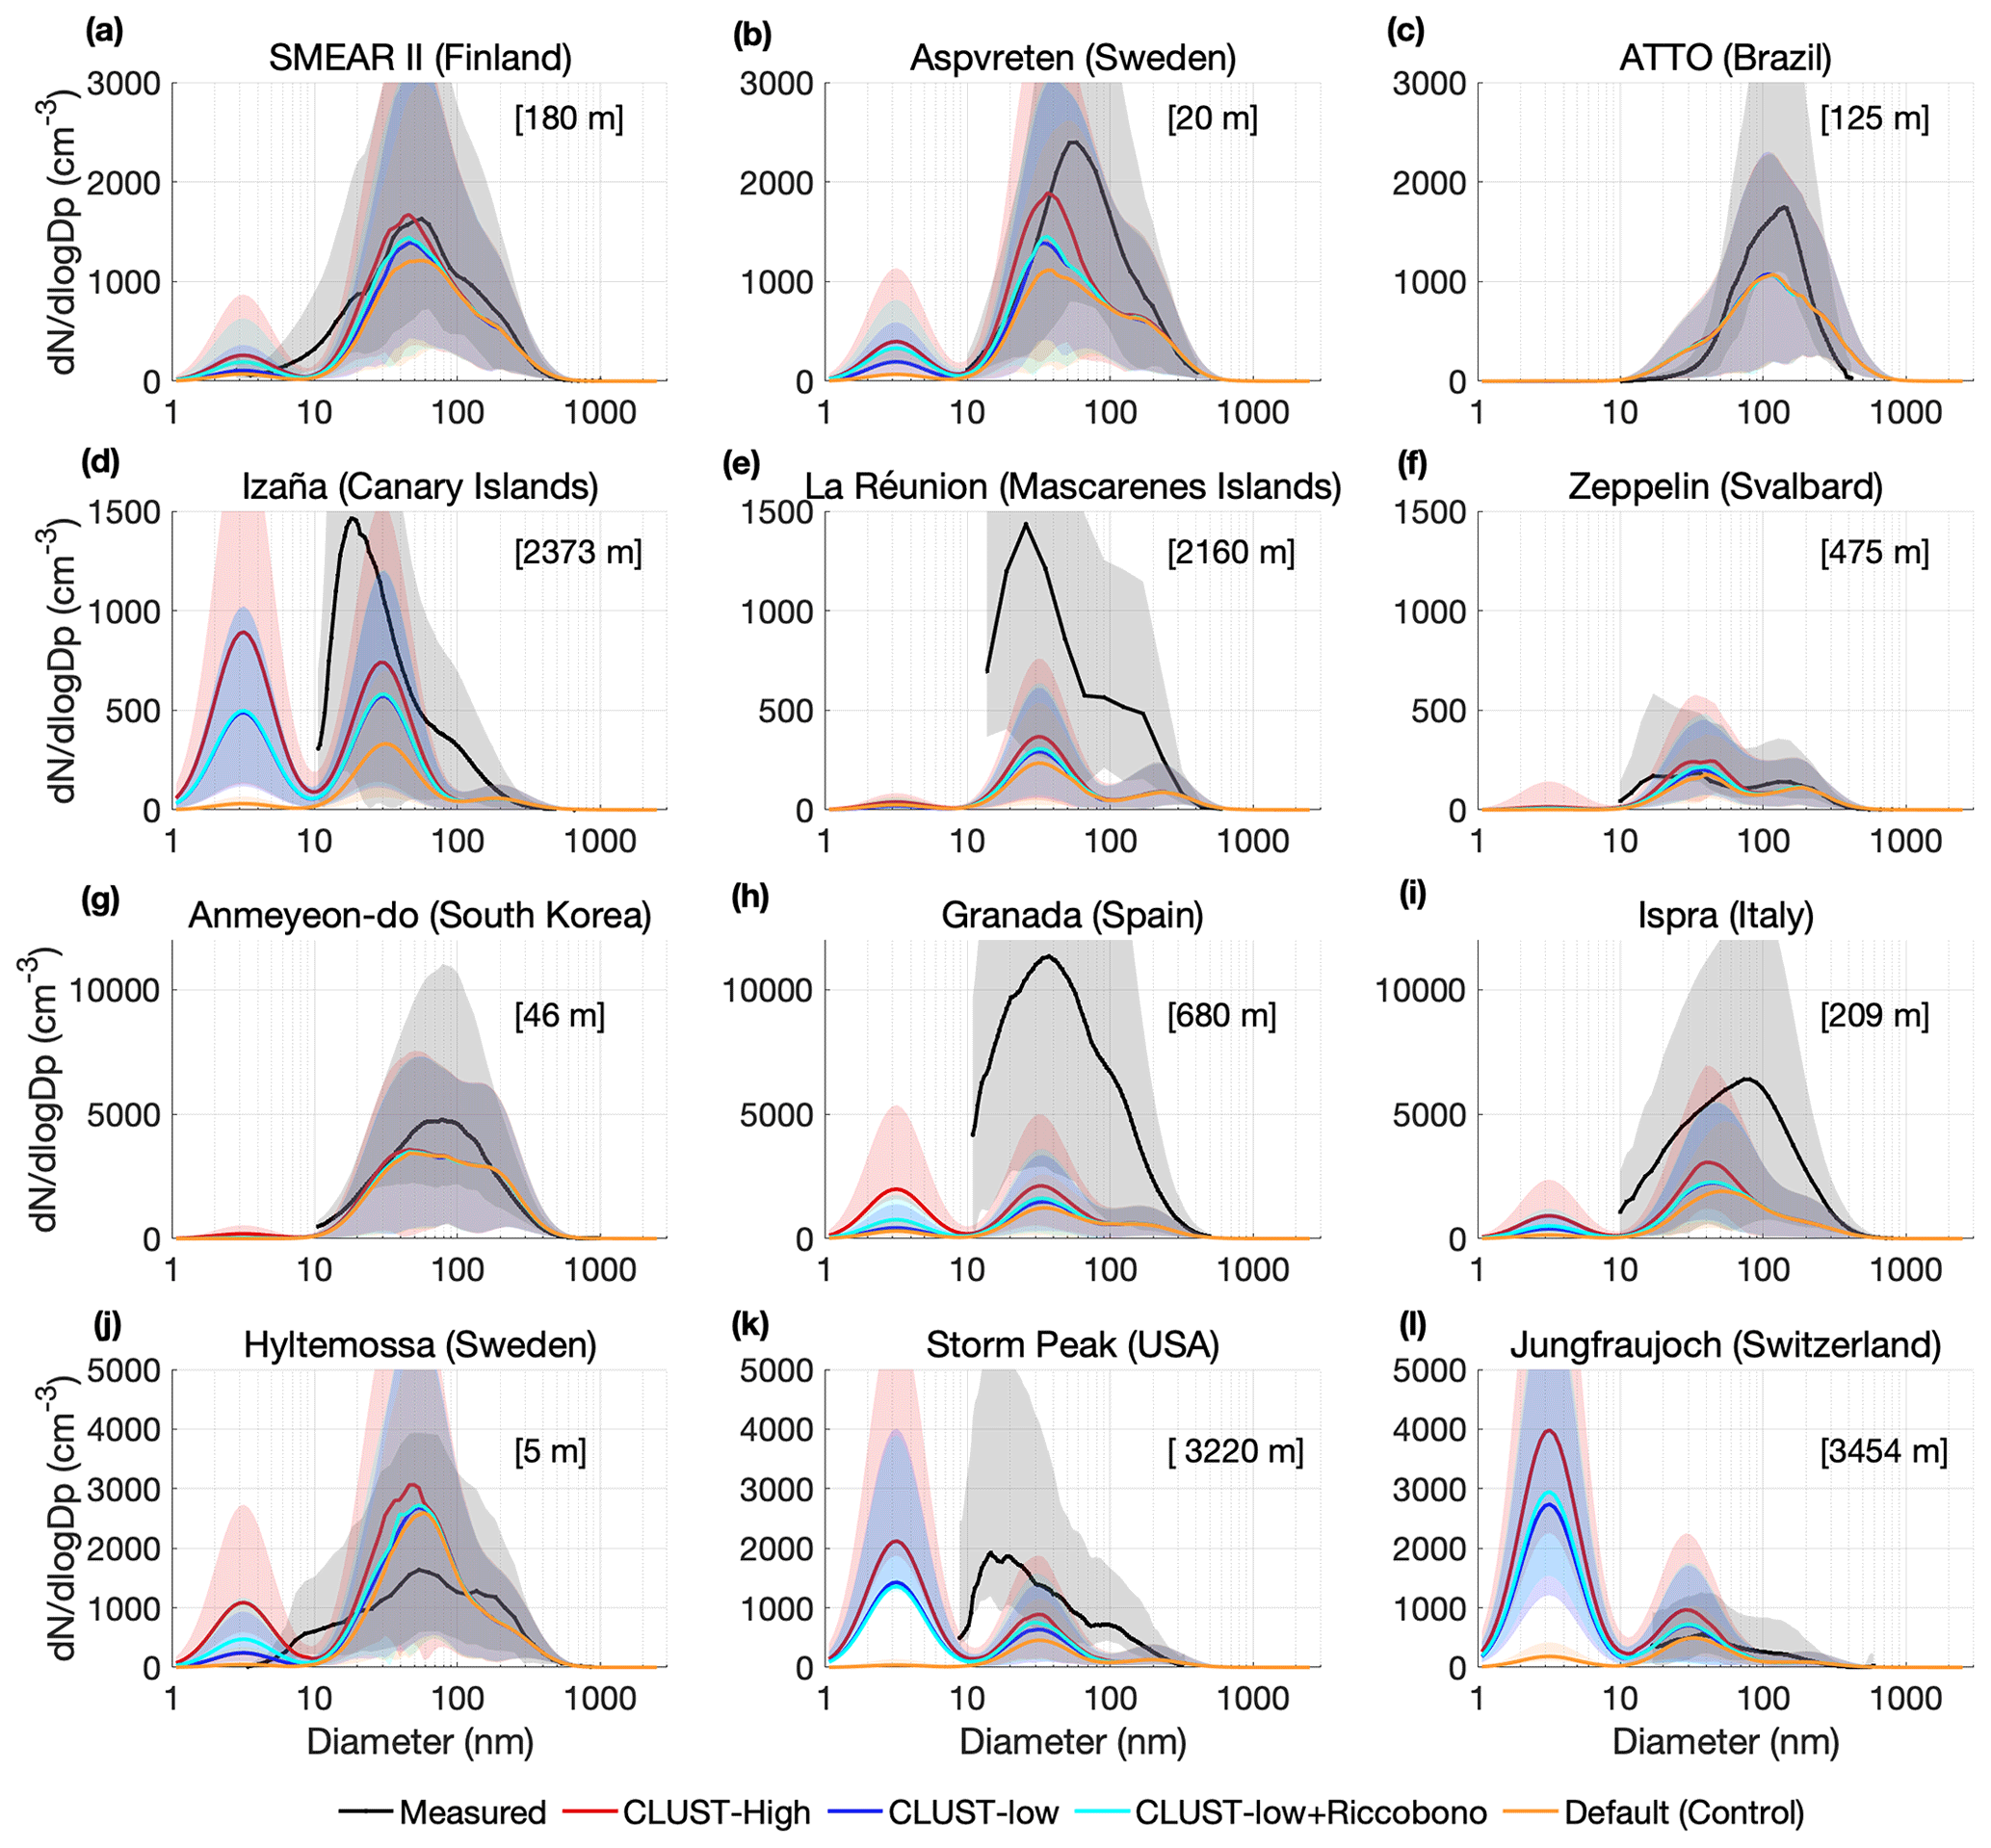
Figure 4 shows the four model setup outcomes at 12 different station measurement locations. Similar to the global mean, the CLUST-High case consistently produces the highest sub-100 nm particles at all simulated stations. For all four model setups, the accumulation mode (>100 nm) concentrations at the stations remain similar (matching Fig. 2). For 9 out of 12 stations in Fig. 4 the model underestimates the Aitken mode concentrations with exceptions for the CLUST-High case at SMEAR II, Aspvreten, Izaña, and Storm Peak. At these four stations, the CLUST-High case has good agreement with the measured concentrations in the Aitken mode. All CLUST cases have better agreement with the measurements at these four stations. The station settings at SMEAR II and Aspvreten are rural forests, while Izana and Storm Peak are high-altitude mountain settings. Two exceptions where the default schemes are close to the measured observations are found in the Arctic station on Svalbard (Fig. 4f) and the mountain station in the Swiss Alps at a 3454 m altitude (Fig. 4l). At the Amazonian ATTO station, the difference between CLUST cases and the control for the model mean aerosol concentrations is very small. Both model schemes likely produce very little NPF in this tropical region due to the absence of H2SO4.
The underestimated Aitken and accumulation modes we see across the urban stations have three potential causes: (1) the modeled primary emissions of particles may be underestimated; (2) the available condensable vapors may be underestimated, or model restrictions in aerosol growth through condensation are present, suggested by (Bergman et al., 2022); and (3) the low-resolution (2° × 3°) grids in TM5 we use for the station interpolation may differ significantly from the local station conditions, especially at urban stations. In the same way, an overestimation from extrapolating local conditions can be true for the modeled nucleation and Aitken mode aerosols at Jungfraujoch in Fig. 4l, as this grid box covers a large central European region with high H2SO4 and NH3 emissions that enable high particle formation rates in the CLUST scheme. The extreme high-altitude difference between model results for the median nucleation mode concentrations seen at Jungfraujoch and Storm Peak (Fig. 4k–l) is discussed further in Sect. 3.5.
Another limitation in this model–observation comparison is the SMPS and DMPS's cutoff diameter at ∼10 nm where the modeled M7 nucleation mode begins, preventing us from evaluating the model performance for the smaller mode concentrations. Additionally, measurement uncertainty may be higher close to this cutoff diameter. This could explain the dramatic decrease in the observed concentrations of just above 10 nm diameter concentrations at the Izaña station (Fig. 4d).
3.3 Cloud properties' changes
Figure 5 shows the difference for mean CDNC and liquid cloud droplet effective radius (reff) between the ECE3-CLUST cases and the control run. The mean CDNC increases significantly (paired t test with 95 % significance) for all three cases, and extremes are found above the mid-latitudes on the North American continent and in the Atlantic Ocean. Correlating to the most extreme regions for the particle formation in Fig. 1 and NUS (AIS) concentrations in Fig. A4 (AIS figure), the resulting increase in particle formation and subsequent AIS concentrations over the North American region could relate to a strong sensitivity for the changing cloud properties locally and downwind seen in Fig. 5. The highest extreme regions for particle formation and NUS concentrations over India and China show minor significant relative change for CDNC and cloud effective radius, and clouds show less sensitivity to sub-100 nm aerosol changes in these regions. The global CDNC concentrations increased by 12.1 % for CLUST-High, 5.9 % for CLUST-Low, and 6.7 % for CLUST-Low+Riccobono. Furthermore, the global effective liquid cloud radius decreased by −0.41 % for CLUST-High, −0.04 % for CLUST-Low, and −0.13 % for CLUST-Low+Riccobono. The cloud liquid water content (shown in Fig. A7) increased in similar regions as the CDNC and with a 4 %–8 % increase globally.
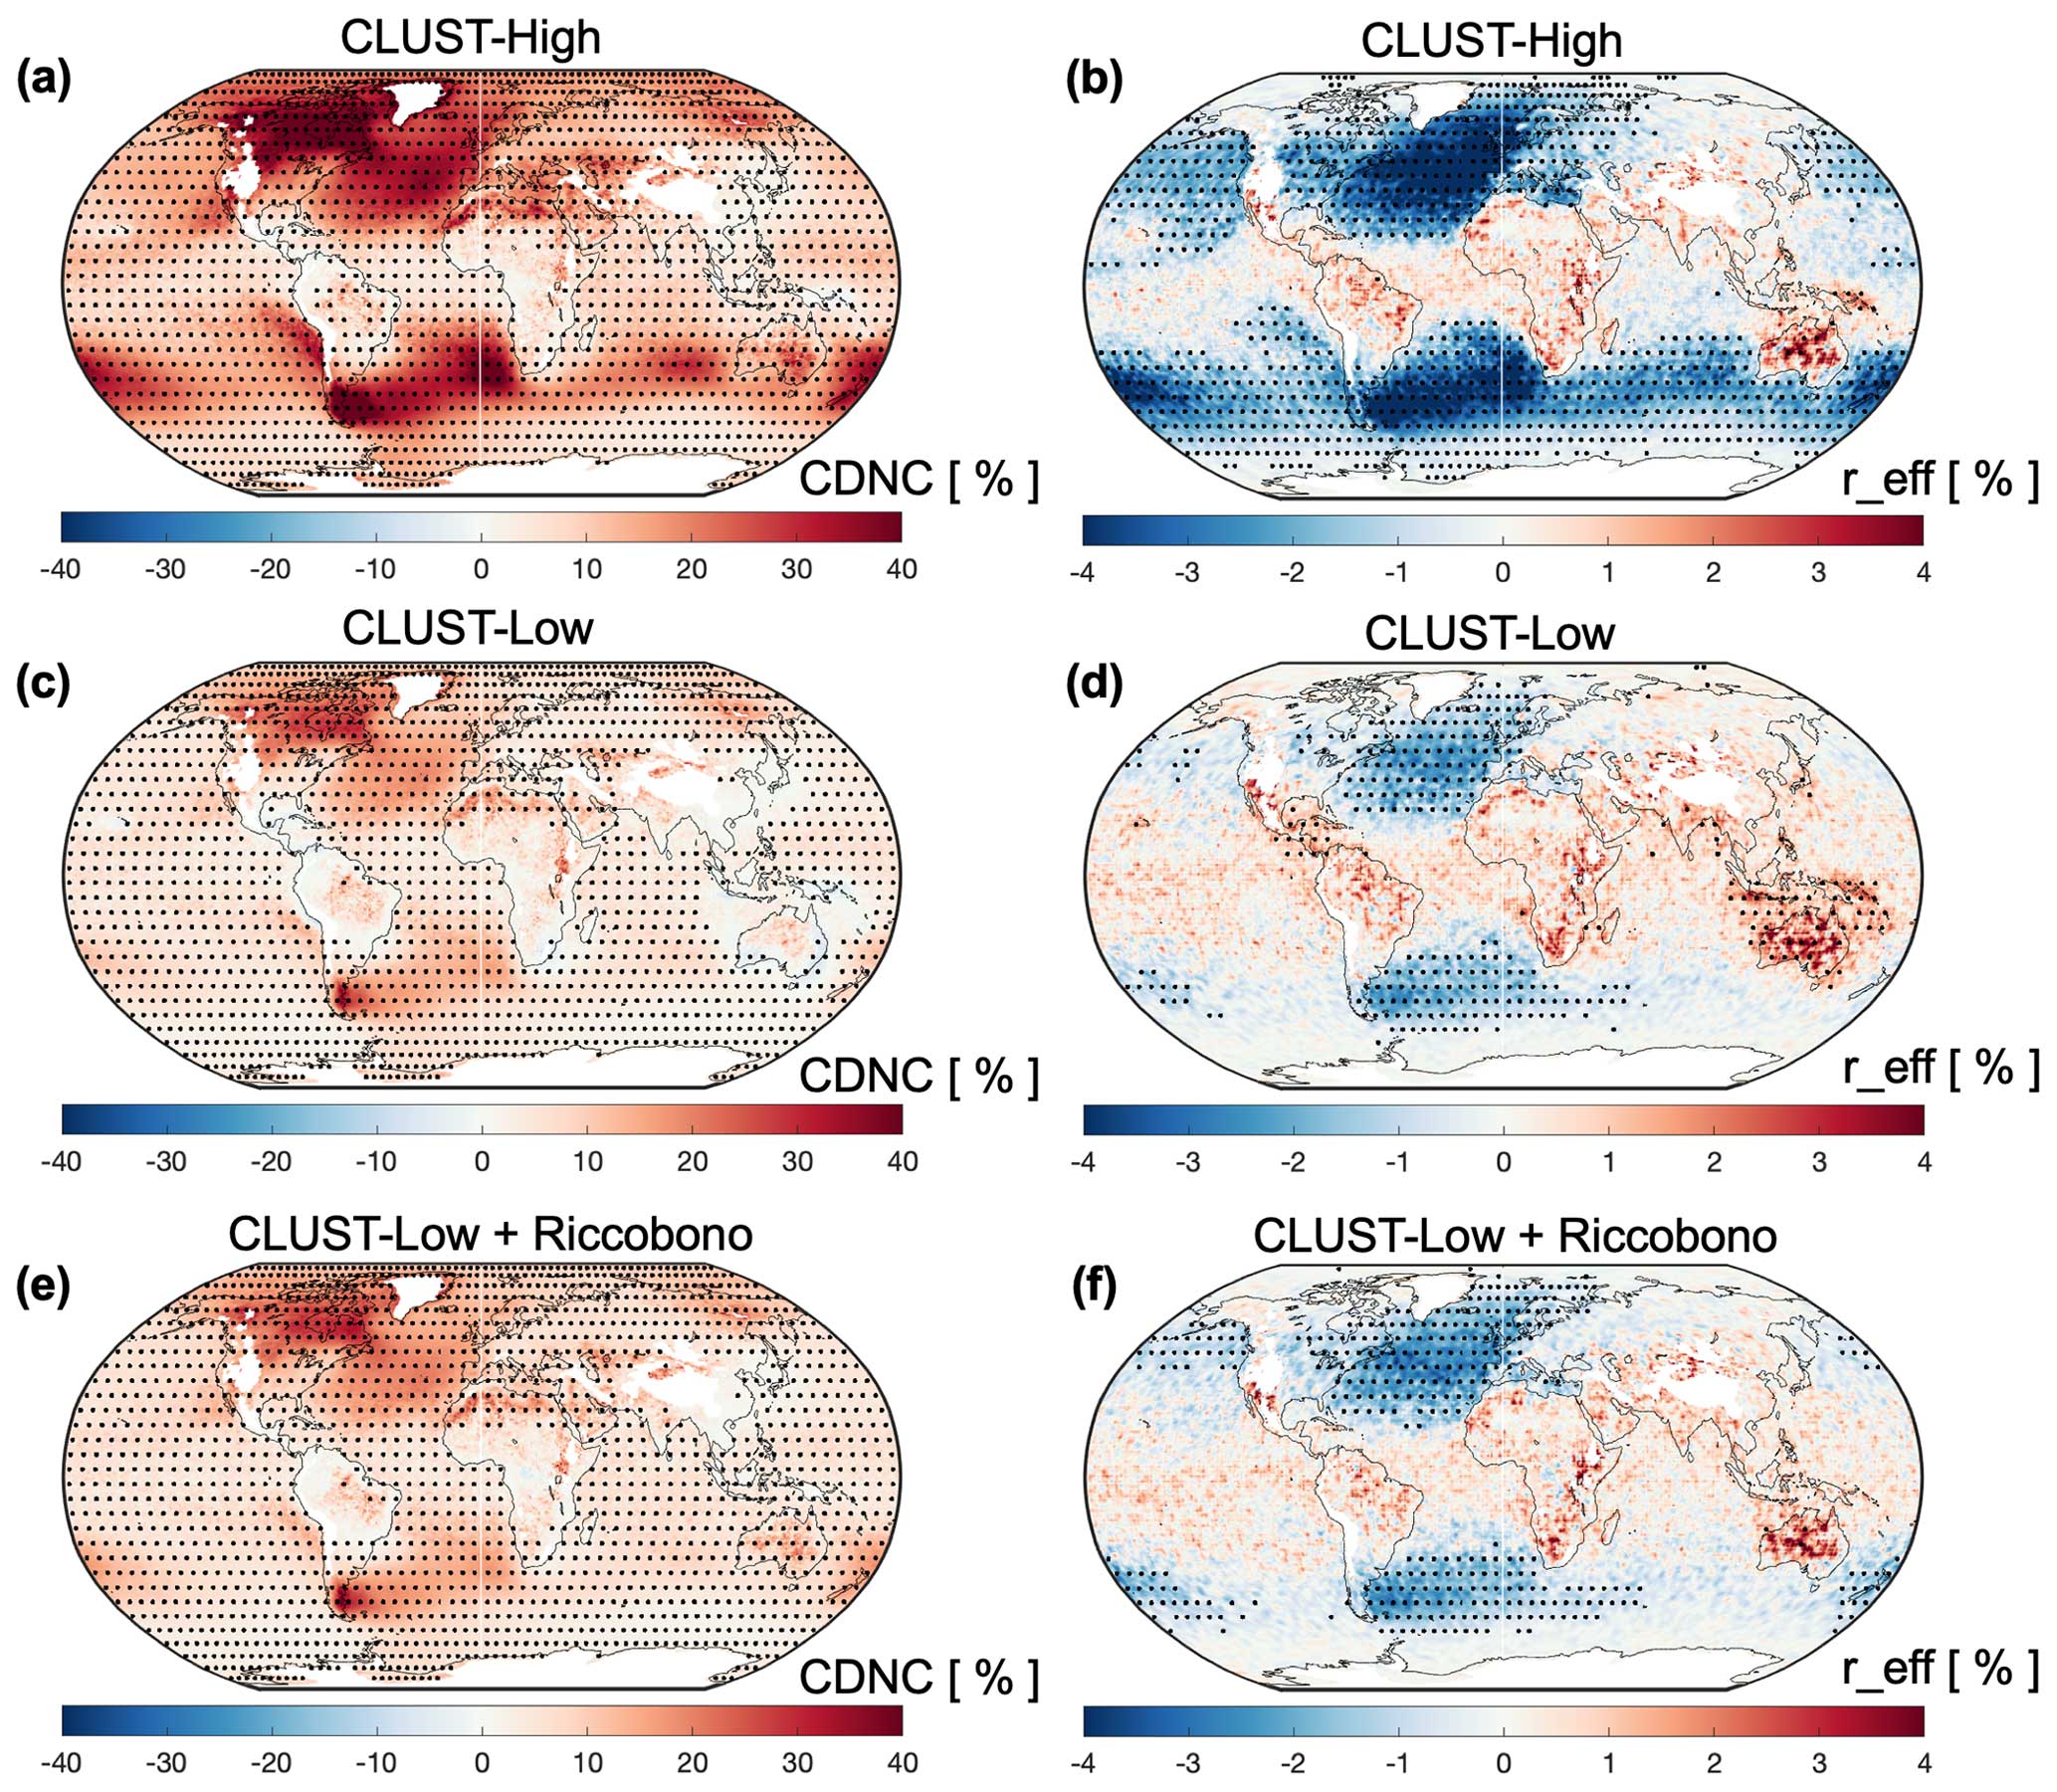
Figure 5The global near-surface (>850 hPa) mean liquid CDNC and cloud effective radius (reff) as a difference between the default control case and CLUST-High (a, b), CLUST-Low (c, d), and CLUST-Low+Riccobono (e, f). Resulting differences computed with Student's t test are shown as dotted regions with a 95 % significance.
3.4 Radiative responses
The net direct radiative effect (DRE) resulted in a small negative forcing from the elevated global particle formation with most net negative RF in CLUST-High compared to CLUST-Low and CLUST-Low+Riccobono (Fig. 6 left column). The global DRE changed by −0.010 W m−2 for CLUST-High, 0.002 W m−2 for CLUST-Low, and 0.008 W m−2 for CLUST-Low+Riccobono. The EC-Earth3 cloud radiative effects (CRE) shown in Fig. 6 (right column) are highly sensitive to changes in the sub-100 nm aerosol number concentrations (Sporre et al., 2020). All CLUST cases with the new method of modeled nucleation rates resulted in strong global negative CRE changes from the H2SO4–NH3 scheme. The global mean CRE changed by −1.03 W m−2 for CLUST-High, −0.28 W m−2 for CLUST-Low, and −0.42 W m−2 for CLUST-Low+Riccobono. The strongest common negative RF occurrences occur over the oceans, and the negative RF occurrences over the North and South Atlantic are most prominent for both the DRE and the CRE for all three CLUST simulations. This coincides with the results in Fig. 5, which shows a raised concentration of CDNC and decreased effective liquid radius over these regions. For the CLUST-High CRE case in Fig. 6b the marine stratiform cloud region exceeds negative 4 W m−2 with the highest sensitivity to CDNC changes. As expected, the resulting scale between the direct aerosol and cloud radiative effects in Fig. 6 (left and right columns) differ in magnitude (∼102) as DRE is governed mainly by aerosol scattering and absorption from the accumulation mode and coarse-mode particles. These larger >100 nm aerosols have less variation throughout the whole atmosphere with the new CLUST schemes (Fig. A6) in contrast to the sub-100 nm particle number concentrations (Fig. 3), which consequently will impact the CRE more than the DRE.
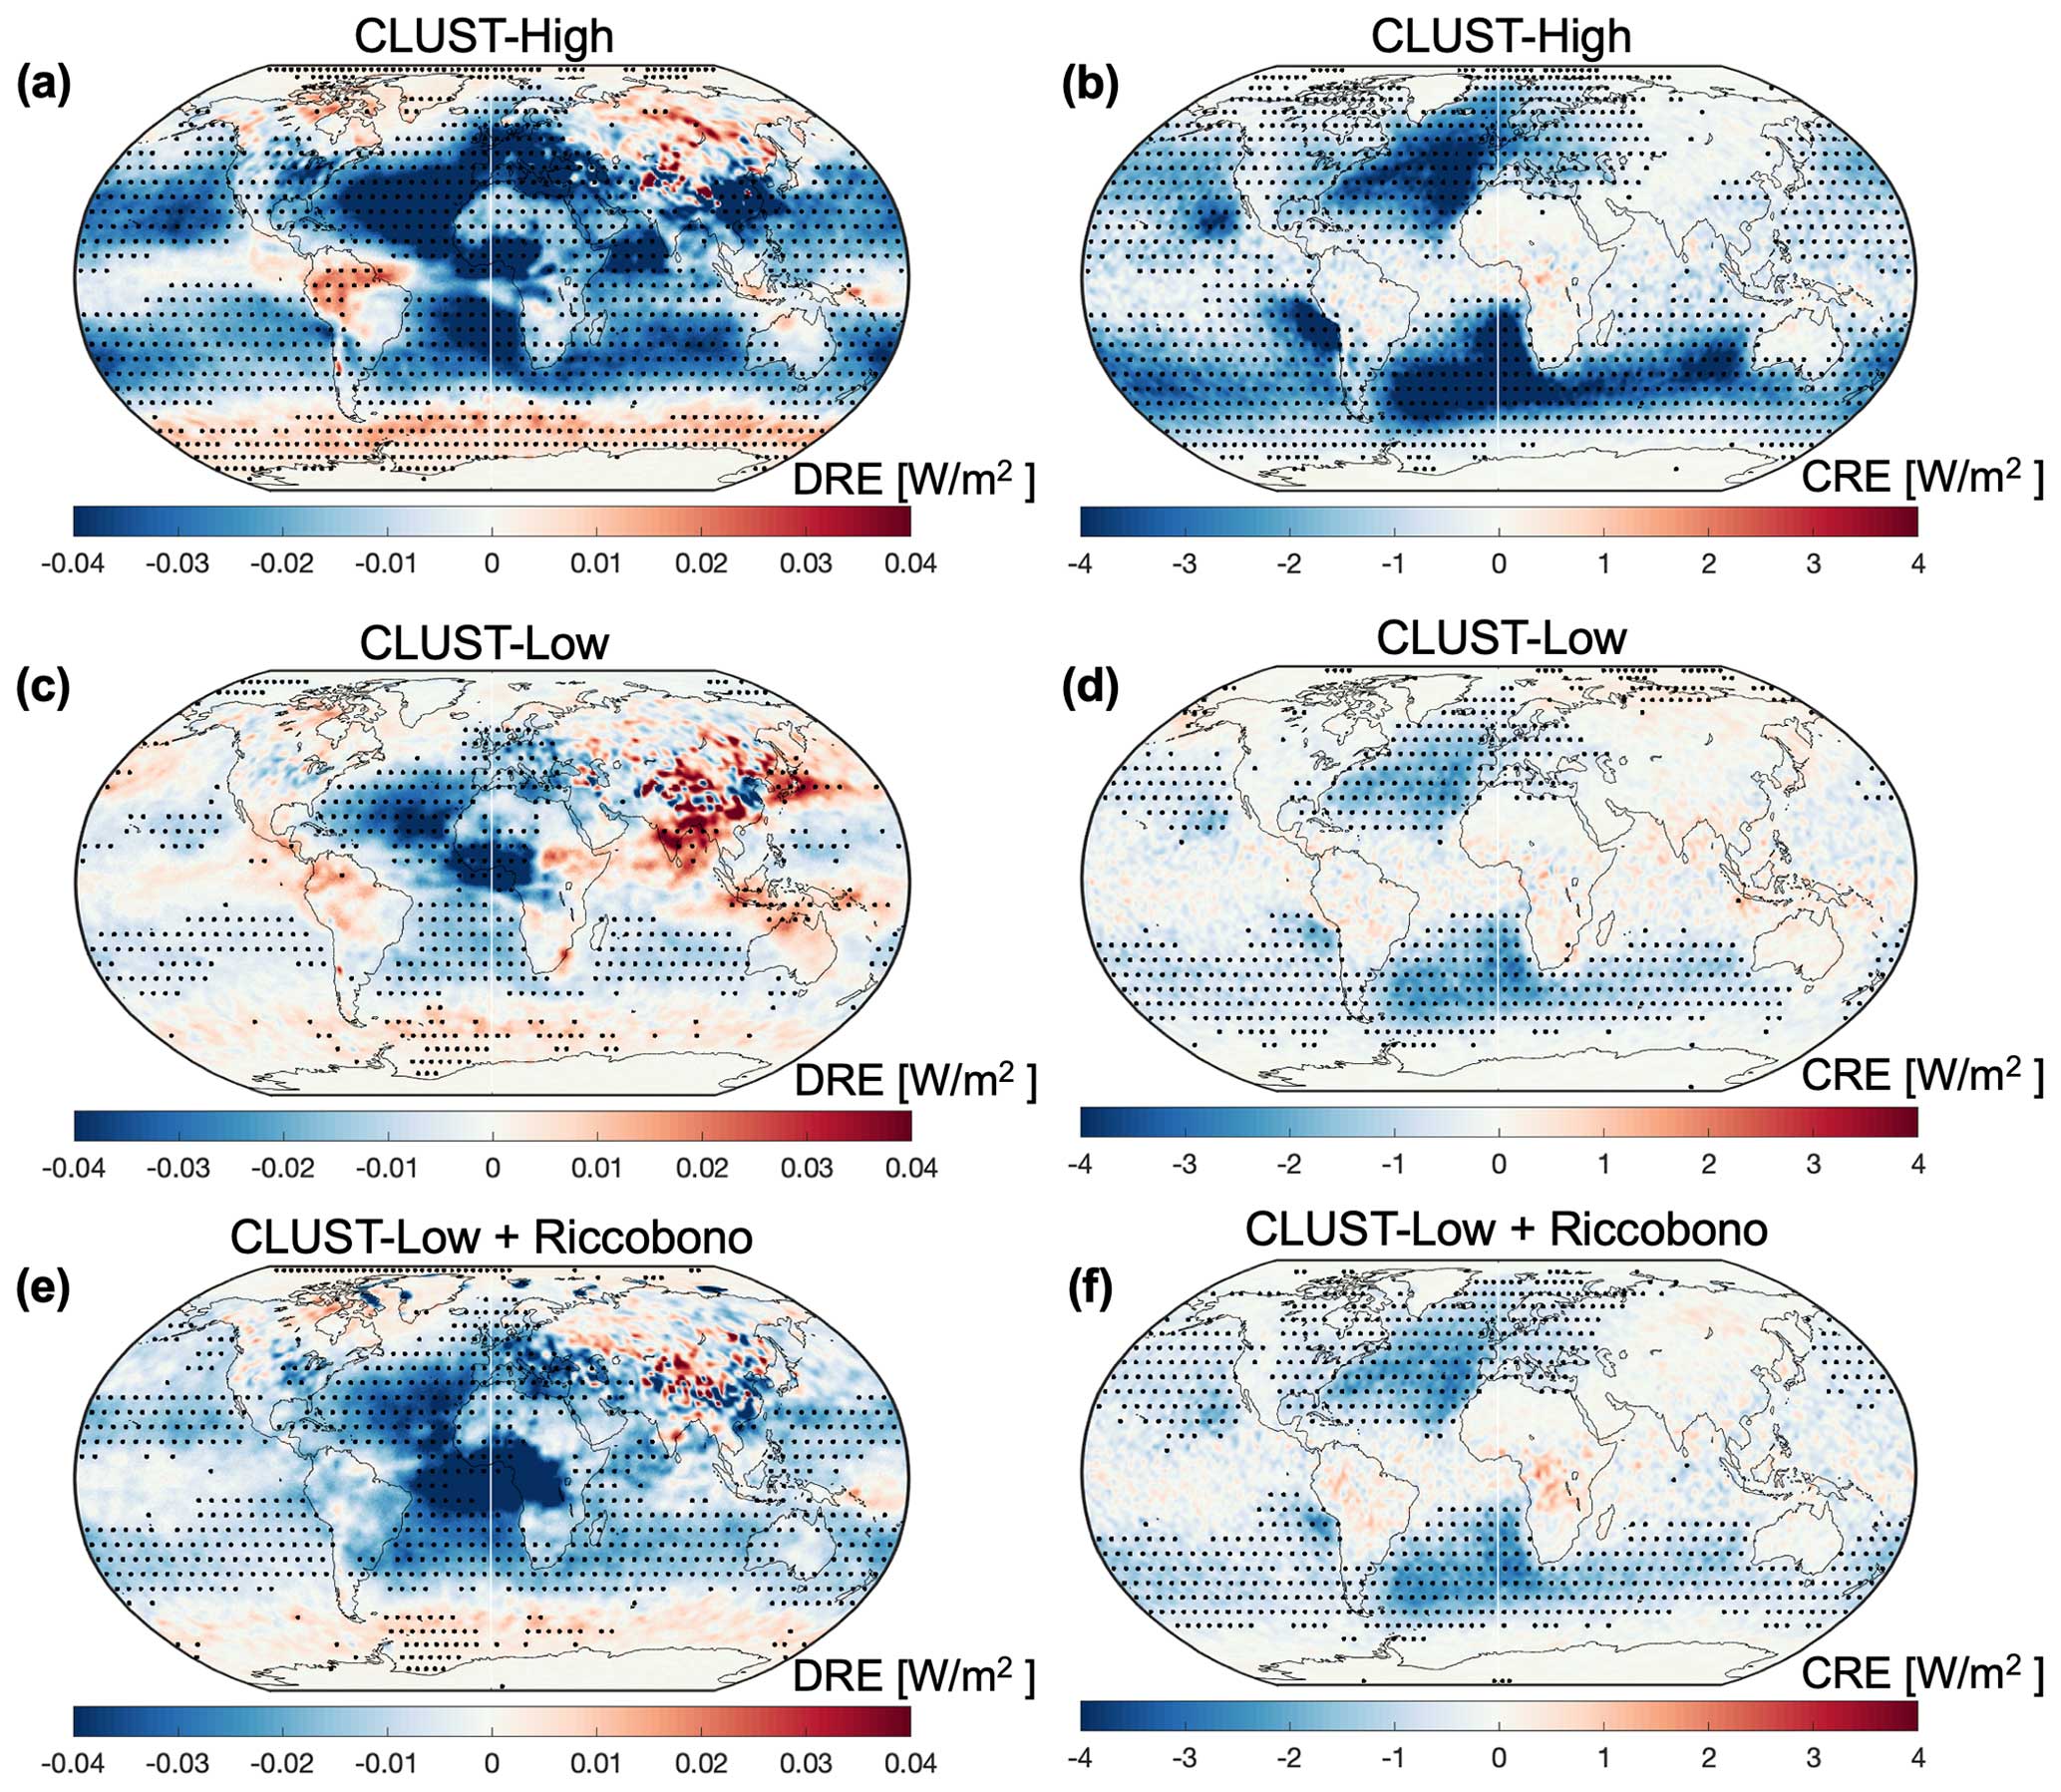
Figure 6The global mean net TOA downward radiation modeled difference for the direct aerosol effect (DRE; a, c, e) and cloud radiative effect (CRE; b, d, f).
3.5 Further discussion
The difference between the control case and the CLUST scheme model outcomes for CDNC, the effective cloud radius (Fig. 5), and the cloud radiative effects (Fig. 6) demonstrates the high cloud and climate sensitivity to the M7 particle formation rate within EC-Earth3. This outcome is similar to the findings in Sporre et al. (2020), which state that EC-Earth3’s “cleaner” atmosphere (compared to other ESMs), with fewer large particle concentrations (accumulation and coarse modes), gives greater CCN concentrations at higher sub-100 nm aerosol concentrations. The sub-100 nm aerosols in a cleaner atmosphere will not be lost by coagulation by present larger particles. This can consequently increase the total number of aerosols that can act as CCN in the EC-Earth3 model compared to other ESMs (Sporre et al., 2020). Interestingly, the CRE outcome from one case in the Sporre et al. (2020) study is similar to our results using the CLUST scheme. Their model results “no isoprene” yielded a global mean CRE increase of −0.82 W m−2 as a result of the increasing mean near-surface sub-100 nm aerosol concentrations by ∼ 15 %, and our results for CLUST-High showed a −1.03 W m−2 CRE difference from the control case after the sub-100 nm aerosol concentration increased by 27.8 %.
The combination of both modeled H2SO4–NH3 and ELVOC–H2SO4 nucleation approaches (CLUST-Low+Riccobono) is considered the most theoretically accurate NPF description as all of these species have been shown to contribute to NPF processes by mentioned chamber measurements and modeling studies (Dunne et al., 2016; Roldin et al., 2019). The condensation of ELVOCs is included in the particle growth from 1.07 to 5 nm in the KK formula for our CLUST lookup table simulations. However, the H2SO4–NH3 pathway produces negligible or zero formation rates in conditions where NH3 concentrations are very low. Therefore, the model runs without the ELVOC–H2SO4 pathway may give unrealistically low or even erroneously zero formation rates at low NH3 and high ELVOC concentrations. Including both organic and NH3 pathways for nucleation is more realistic considering the current understanding. Additionally, the CLUST lookup table limits we set for NH3, H2SO4, and the other input variables can be modified if needed, and further diagnostics on this can be made for future studies.
Our results show that the current default nucleation in EC-Earth3 has a tendency to underestimate the modeled aerosol concentrations compared with measured stations (Fig. 4). The CLUST cases show closer agreement with the measurements at stations where the model previously underestimated the aerosol concentrations. The high-altitude median nucleation mode concentrations modeled in EC-Earth3 for Jungfraujoch station (Fig. 4l) are predominantly higher for the H2SO4–NH3 CLUST scheme. This is a profoundly anthropogenically influenced grid with high concentrations of H2SO4 and NH3 rising from the surface grid beneath, and with lower temperatures aloft, this gives more particles from the CLUST lookup table.
A potential underestimation of modeled primary emissions in EC-Earth3 could contribute to the low concentrations in the model compared to observations, but evaluating primary emission inventories is outside the scope of this study. Further evaluating the conditions set in the M7 model module regarding aerosol growth and the available condensable vapors is a point of interest for our future ECE model development. Introducing ammonium nitrate as an available condensable vapor to the Aitken and nucleation modes (which now only exists for the accumulation mode in EC-Earth3) could increase the growth and survivability of smaller particles.
A new approach for new particle formation rates has been implemented in the chemistry module TM5-MP of EC-Earth3 using a lookup table approach and molecular cluster formation modeling (CLUST). This introduces a detailed H2SO4–NH3 nucleation which can be added to the existing ELVOC–H2SO4 scheme based on Riccobono et al. (2014). The H2SO4–NH3 nucleation is a unique implementation for large ESMs, but it is supported by theory, chamber experiments, and regional model studies. Three 5-year simulations using the CLUST lookup table were compared with a control case with relative and absolute differences for radiative forcing, cloud properties, and aerosol concentrations.
This study showed that the updates in the nucleation rate scheme in the M7 aerosol module (TM5-MP) in EC-Earth3 gave significant differences in the results for the sub-100 nm aerosol concentrations and the model radiative effects. The introduction of NH3–H2SO4 nucleation in EC-Earth3 had the highest net impact on the free-troposphere particle formation rates and the sub-100 nm aerosol concentrations. The global average (total atmosphere) sub-100 nm aerosol increased by 27.8 % for CLUST-High, 11.7 % for CLUST-Low, and 12.6 % for CLUST-Low+Riccobono. Consequently, the resulting CRE for all CLUST cases gave an increased negative net TOA downward radiation with −1.03 W m−2 for CLUST-High, −0.28 W m−2 for CLUST-Low, and −0.42 W m−2 for CLUST-Low+Riccobono. Comparatively, the modeled >100 nm aerosol concentrations and the resulting DRE had minor changes from the implemented nucleation scheme. Annual medians of measured station DMPS/SMPS observations at nine measurement sites were compared against the four model results at various locations. The model performed well in reproducing the Aitken mode number concentration at most of the station locations. At three locations the model overpredicts the Aitken mode; here the default control case gives a closer representation of the observed concentration. At the other nine (underpredicted) locations, CLUST-High has the best Aitken mode representation, and the other two CLUST cases have a better representation compared to the control case. The CLUST-High and CLUST-Low schemes were qualitatively consistent at all locations and for the global mean, which gives confidence that the modeled upper and lower limits of H2SO4–NH3 nucleation follow the general trend.
Table A1The station descriptions for all the observed measurements used in this study (Tørseth et al., 2012; Franco et al., 2022).
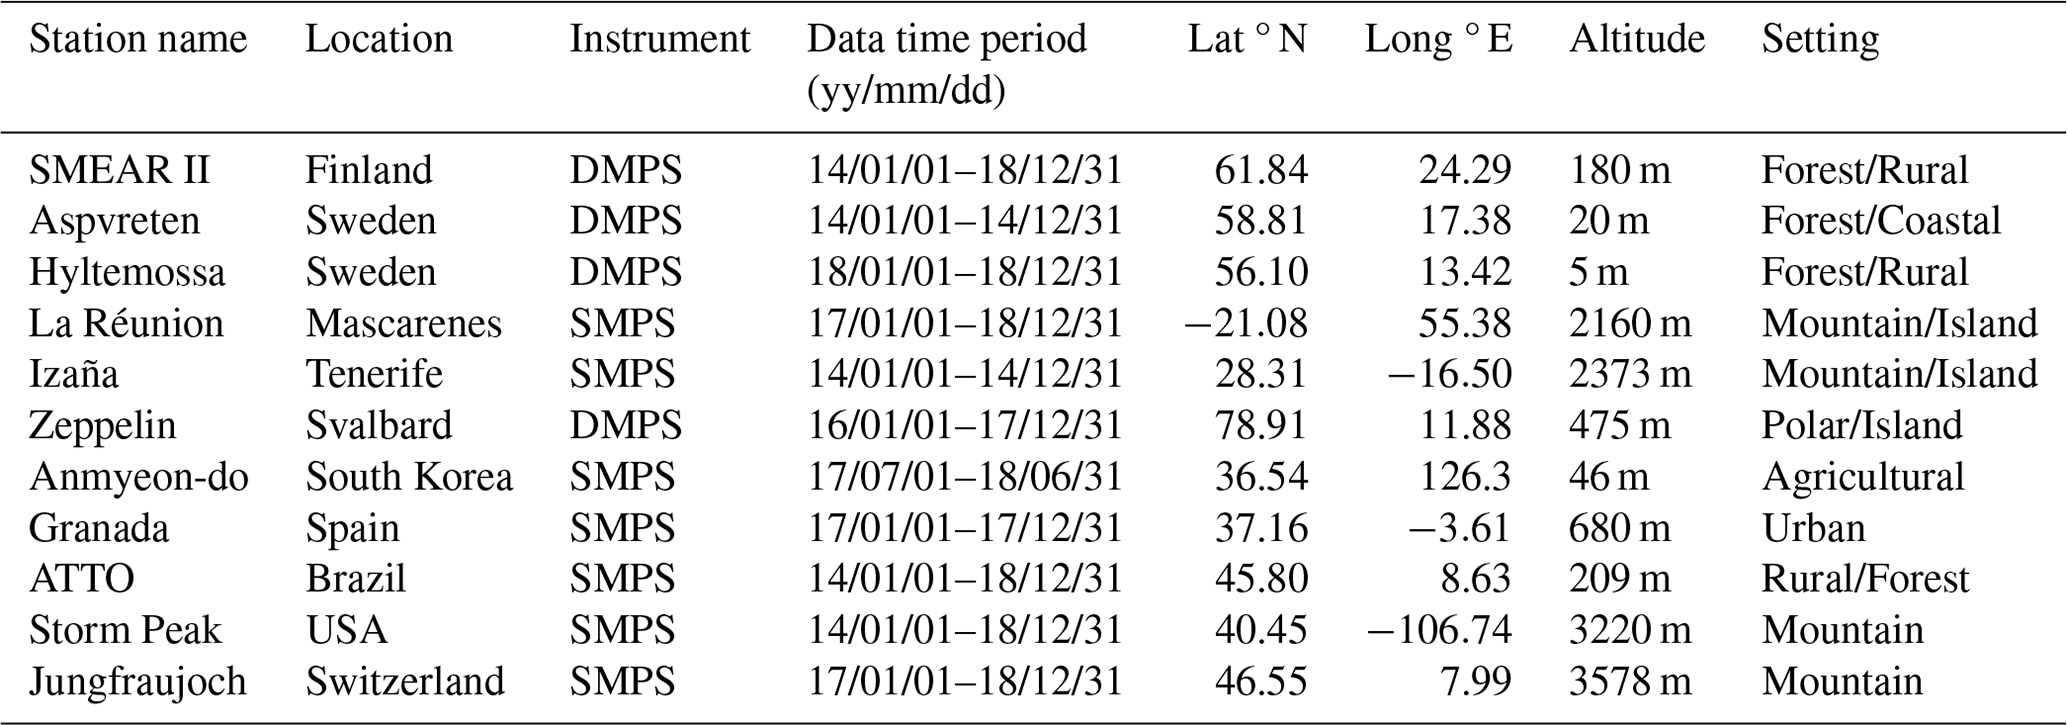
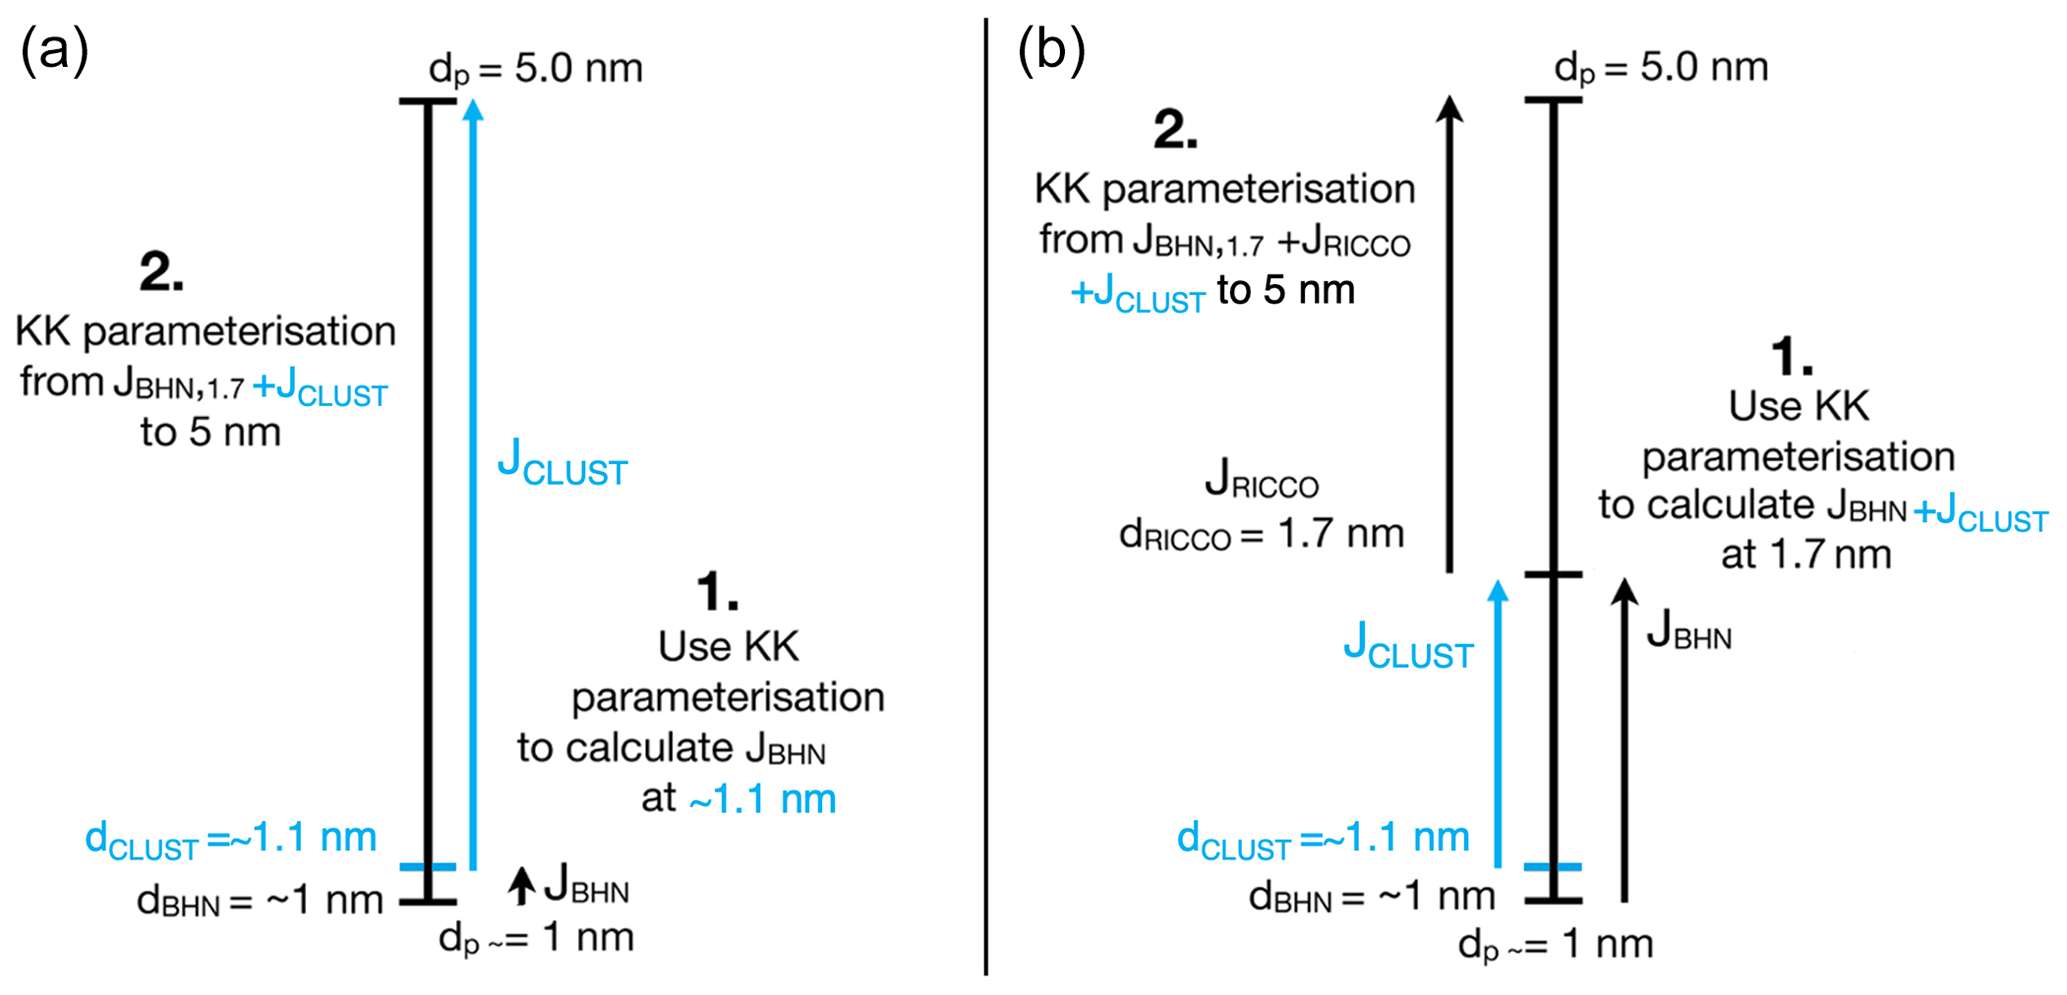
Figure A1Schematic presentation of the parameterized growth of nucleated particles to the size of 5 nm. Panel (a) shows the approach for the CLUST-Low and CLUST-High simulations, and panel (b) depicts the scaling within CLUST-Low+Riccobono simulations. For the default control setup, subtract the cyan colors from (b).

Figure A2The global mean vertical concentration for modeled gas-phase ELVOCs, NH3, and H2SO4. There is negligible model difference for ELVOC as the concentration is steady state, and NH3 is not consumed in the NPF function.
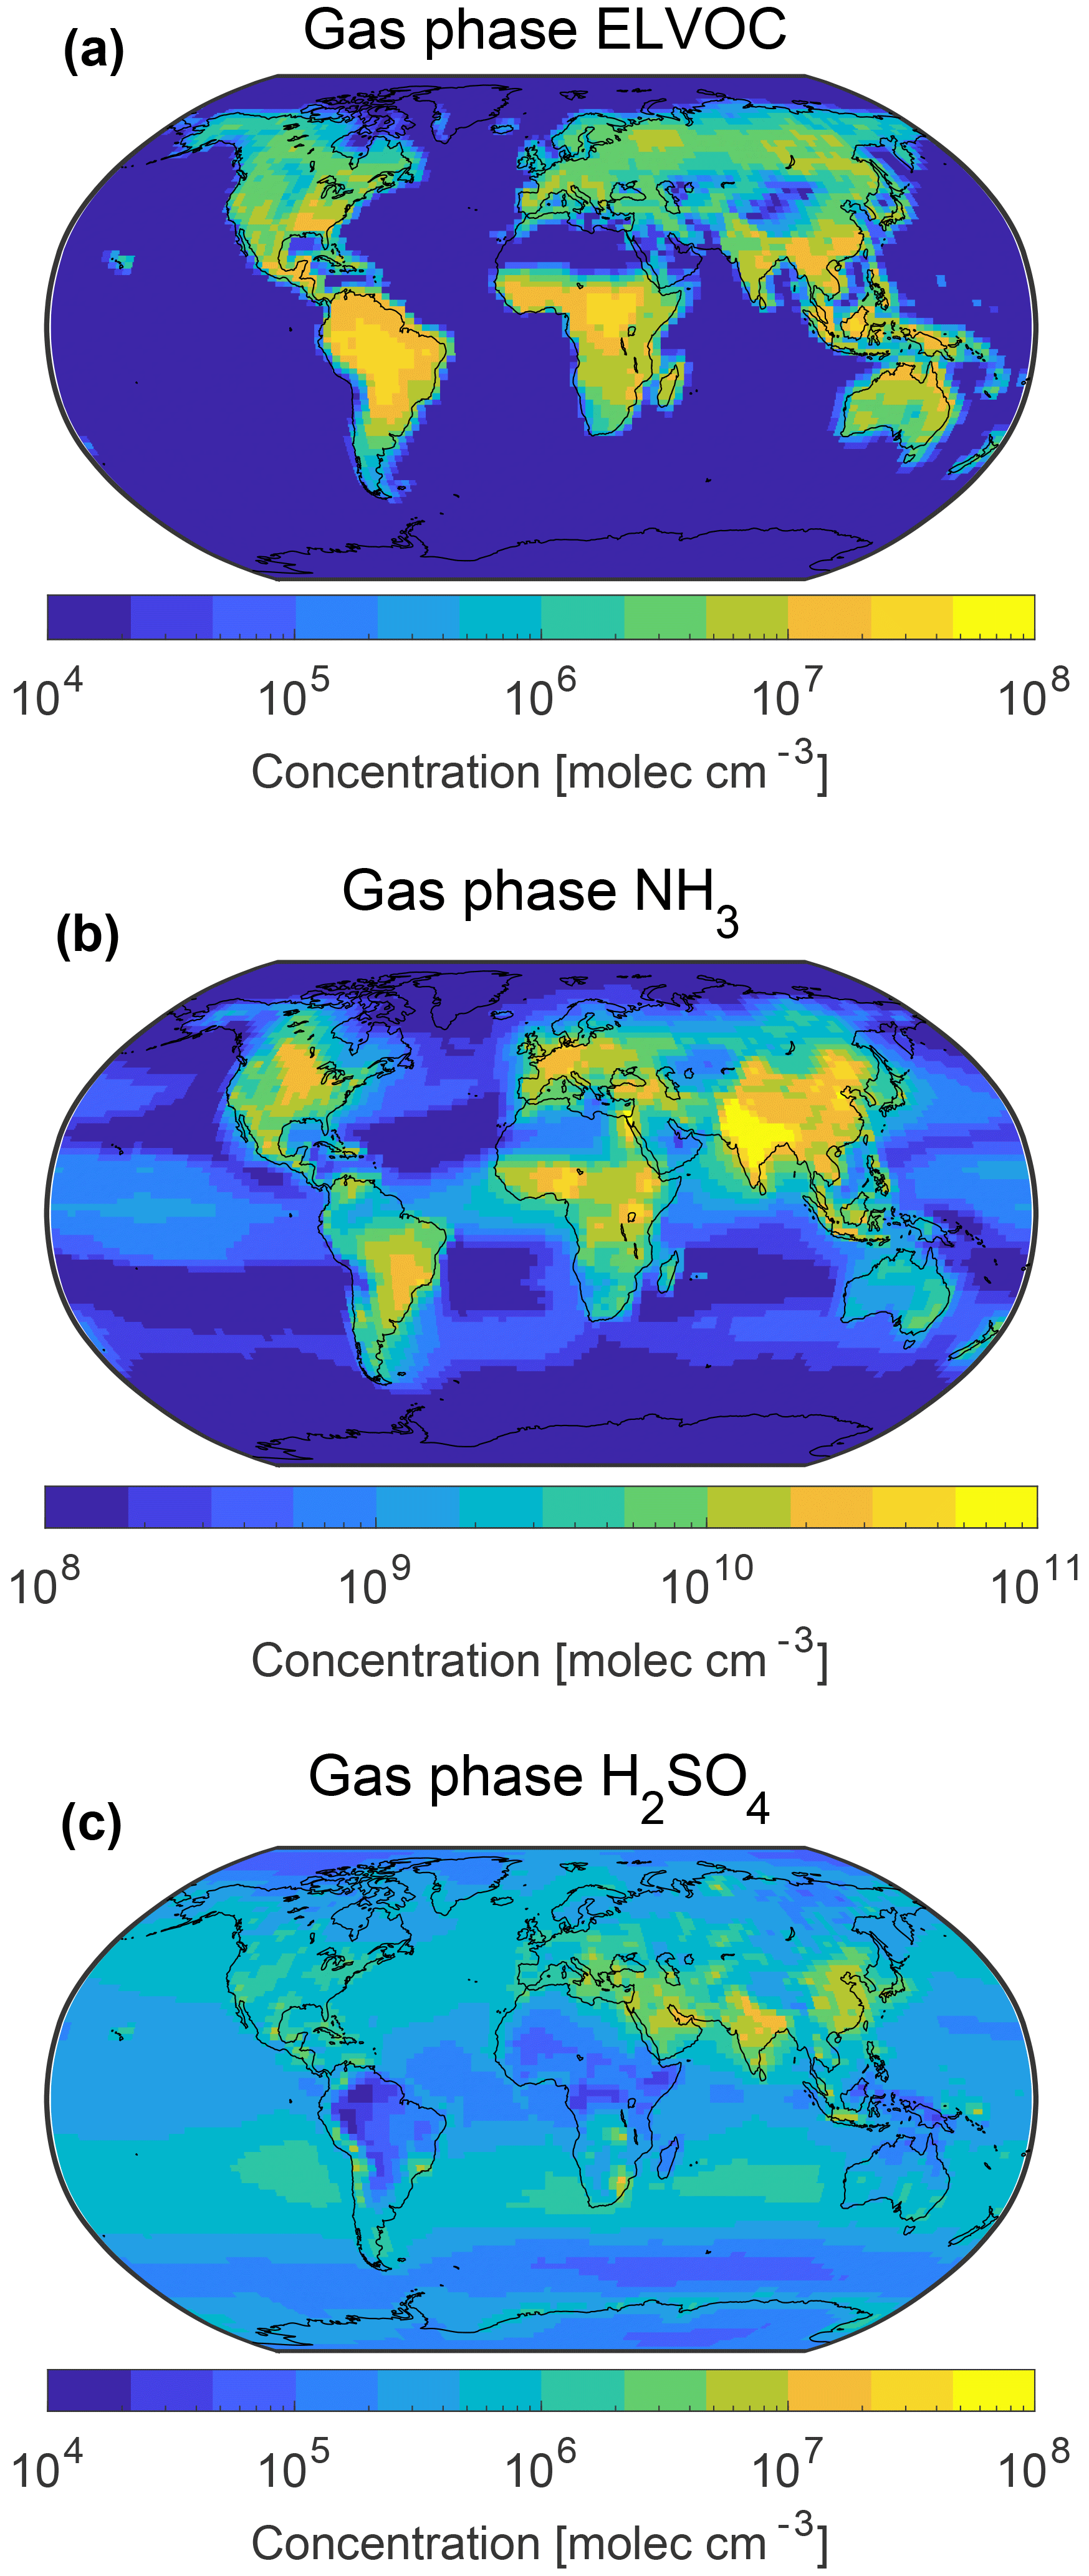
Figure A3The mean near-surface gas-phase concentrations of (a) ELVOC, (b) NH3, and (c) H2SO4 for the EC-Earth3 control simulation.
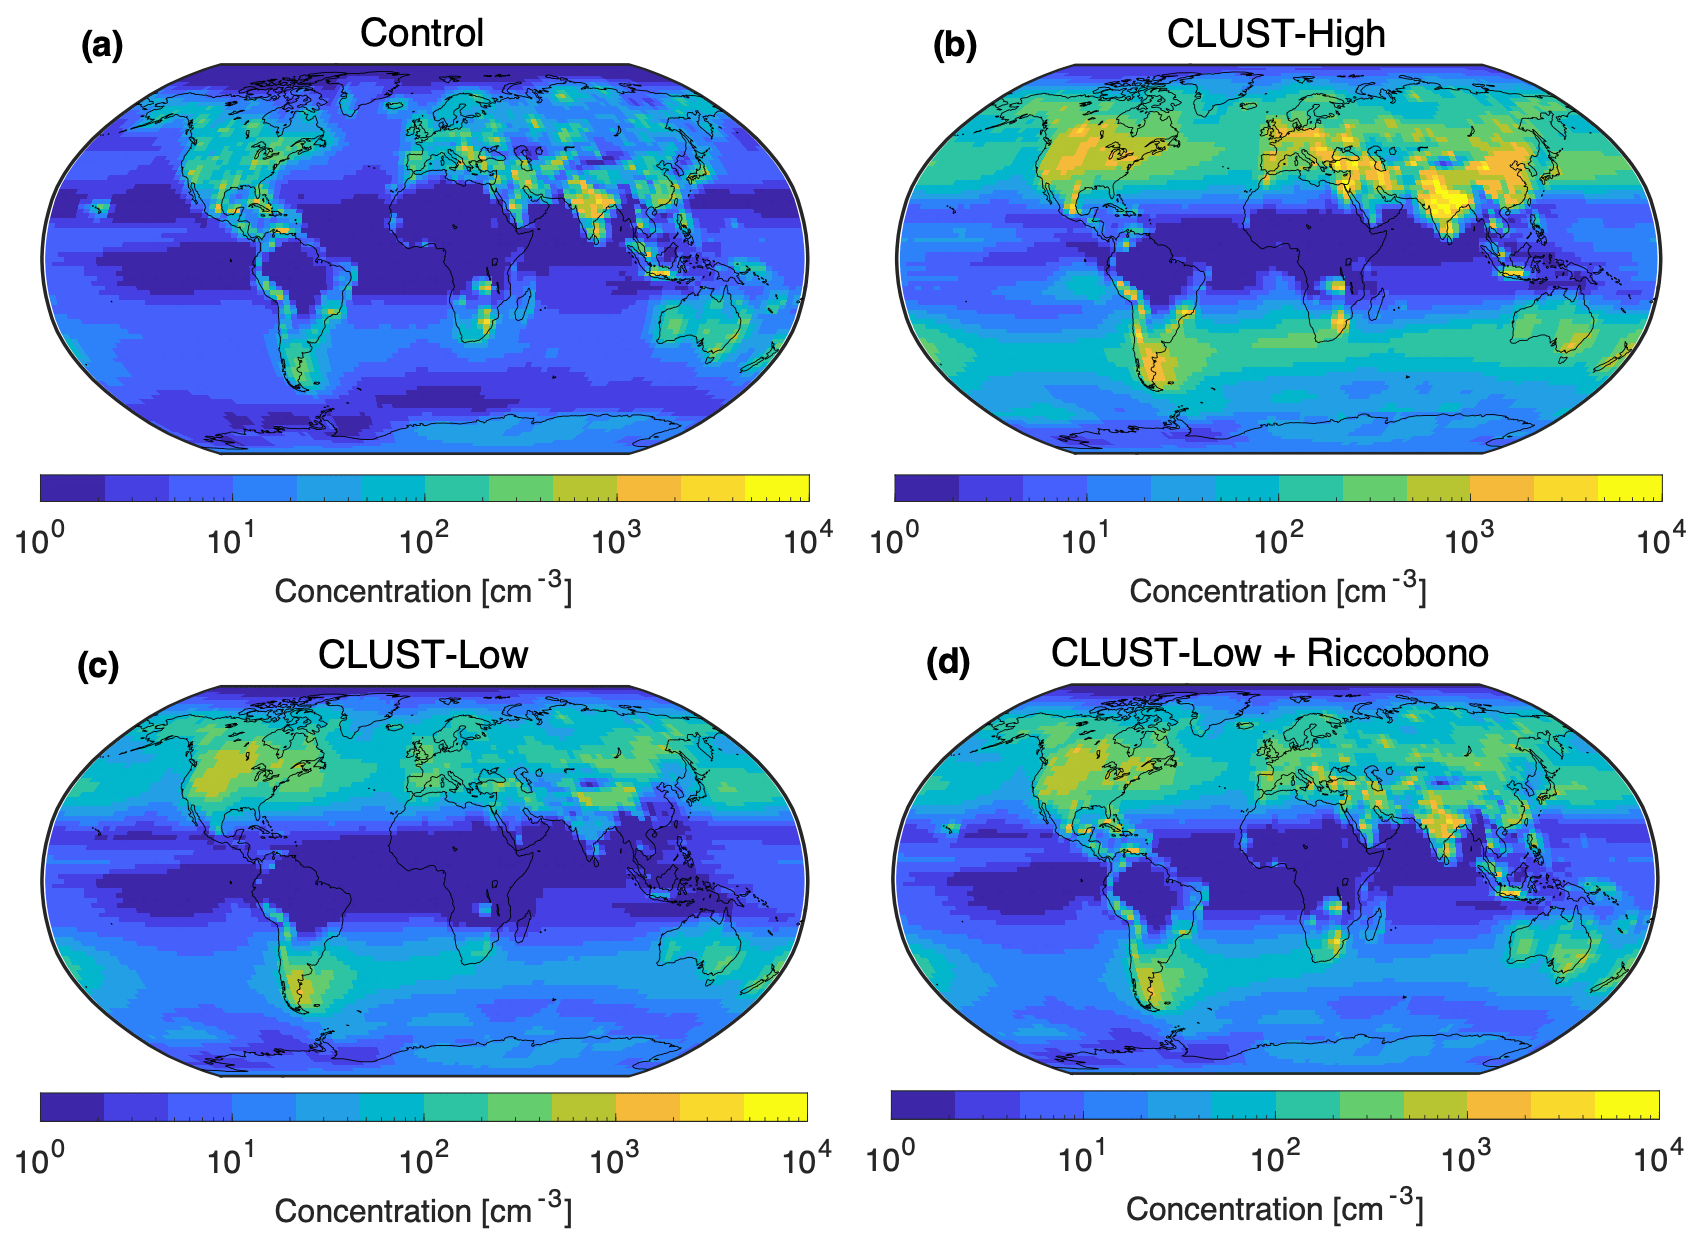
Figure A4The mean near-surface aerosol nucleation mode (NUS) concentrations for the four simulations.
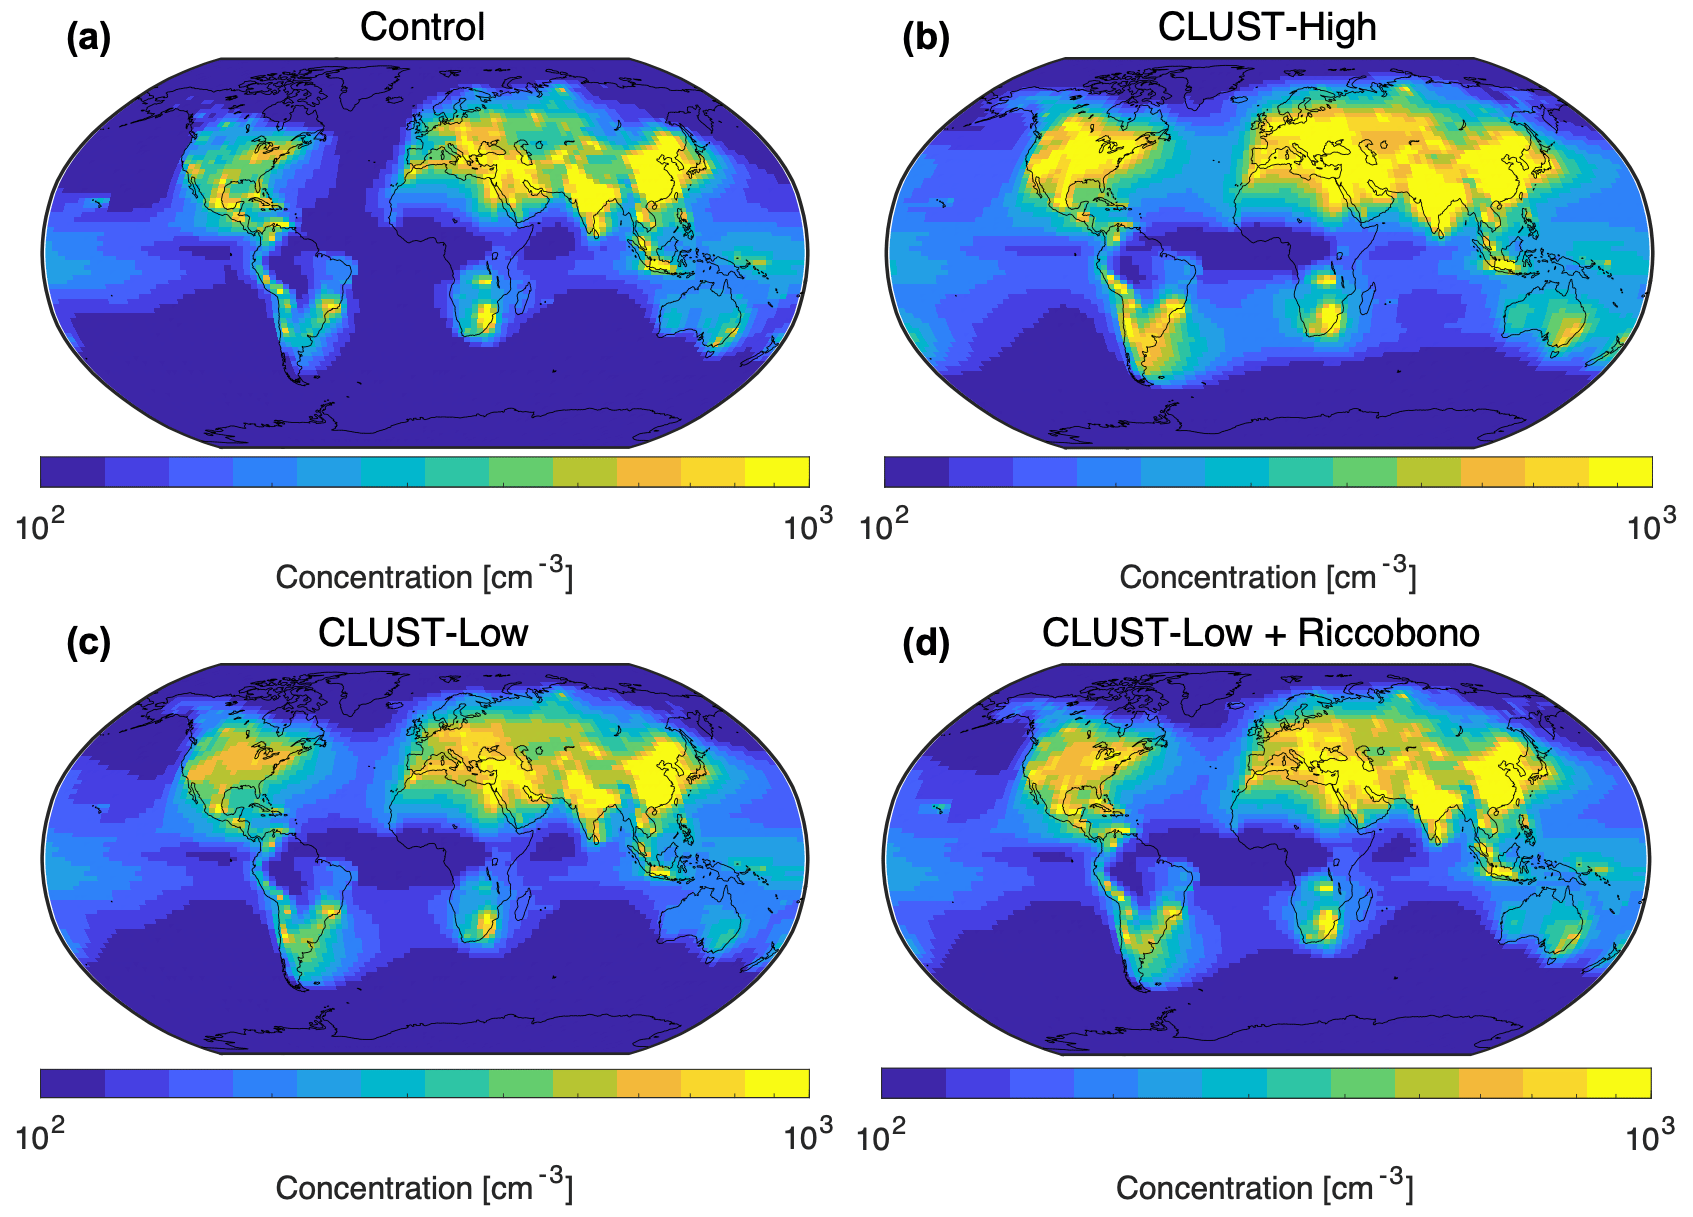
Figure A5The mean near-surface aerosol Aitken mode (AIS) concentrations for the four simulations.
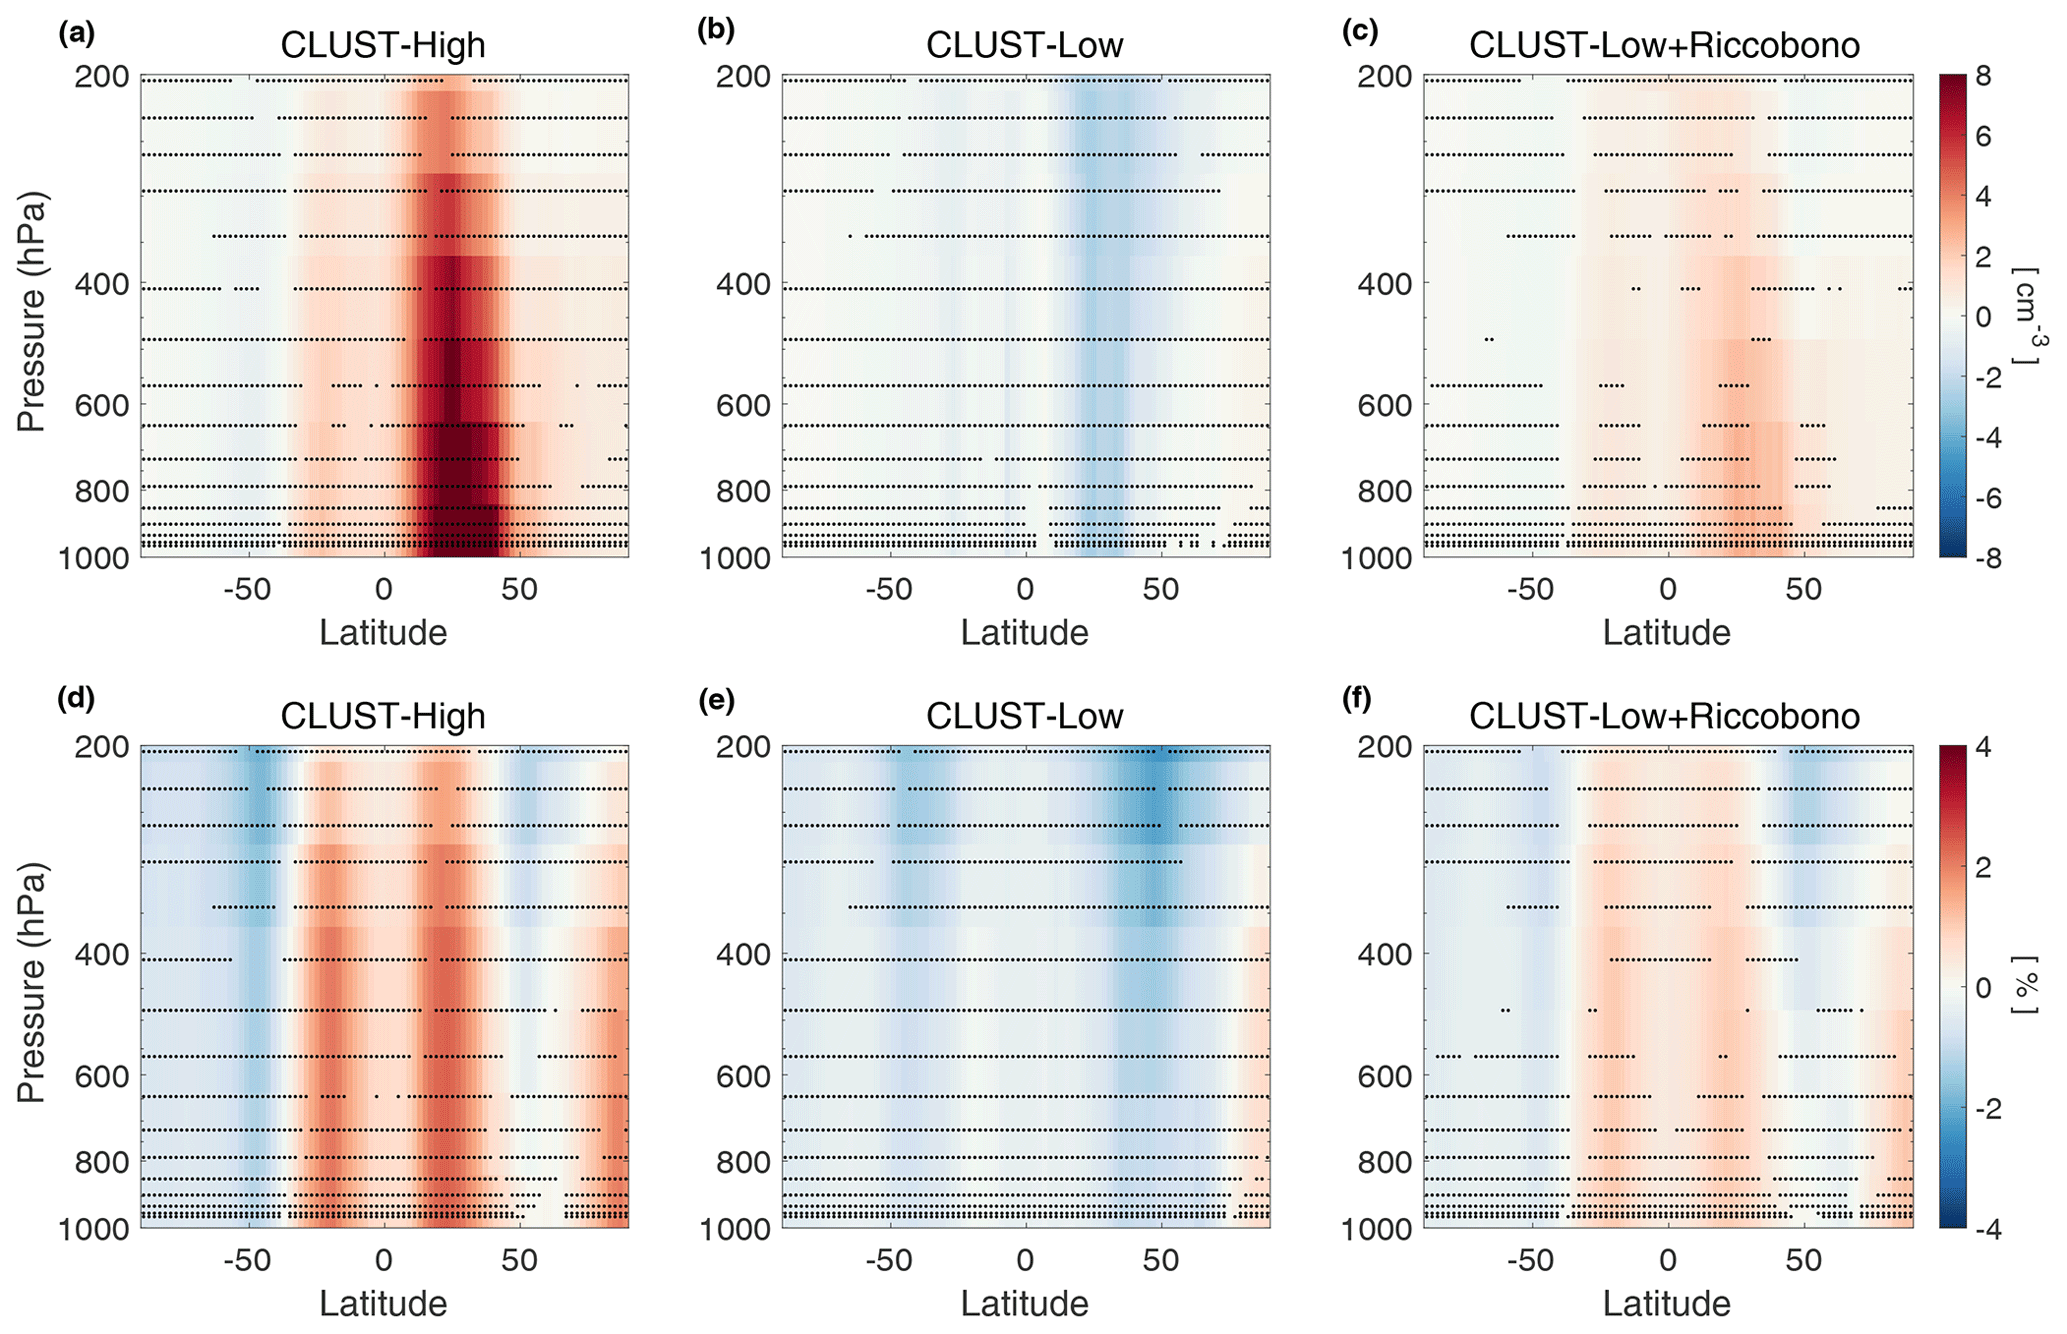
Figure A6The zonal mean difference in the total aerosol number concentration of the soluble and insoluble accumulation and coarse modes (ACS, ACI, COS, and COI), with the absolute difference (a, b, c) and the relative difference (d, e, f), showing t-test significance (95 %) as dots.
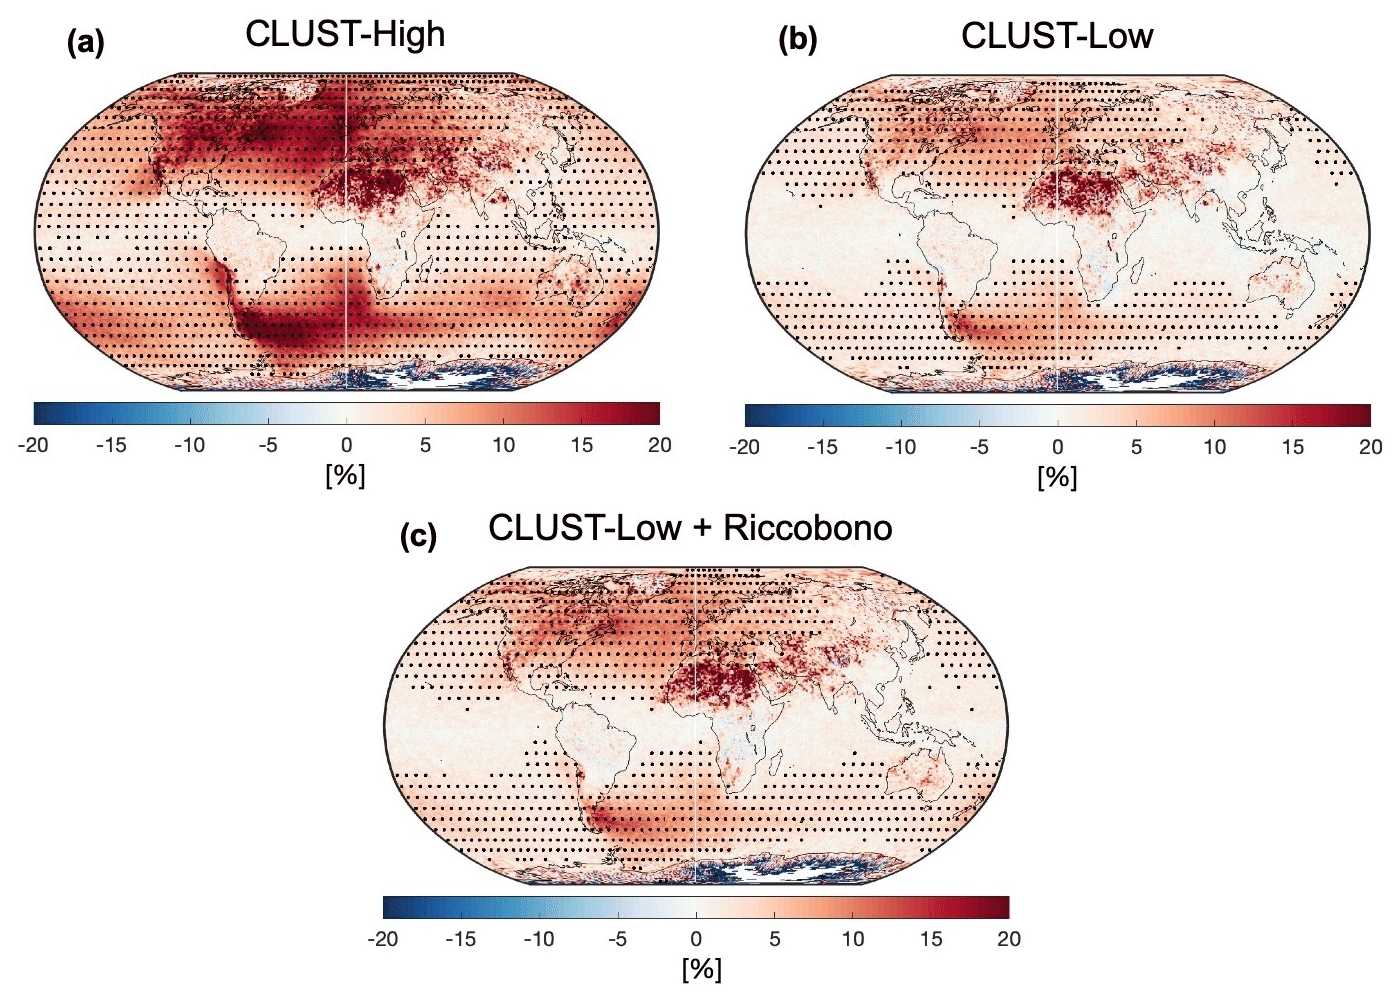
Figure A7The annual mean difference from the control case of the total column of cloud liquid water (kg m−2), shown as the relative difference, with t-test significance (95 %) shown as dots.
The model code and descriptions for the adjusted EC-Earth3.3.4 TM5-MP version 1.2 with the implemented CLUST lookup table can be found at https://doi.org/10.5281/zenodo.10517639 (Svenhag, 2024a). The model output data sets are available at https://doi.org/10.5281/zenodo.10468610 (Svenhag, 2024b), with post-process scripts located at https://doi.org/10.5281/zenodo.10512456 (Svenhag, 2024c). Codes for the J-GAIN v1.0 generator and the interpolator used for the CLUST lookup table in the experiments can be found at https://doi.org/10.5281/zenodo.8220223 (Yazgi and Olenius, 2023a). Resources for the IPR lookup table can be found at https://doi.org/10.5281/zenodo.3483797 (Yu, 2019). The DMPS and SMPS measurements from the stations can be downloaded at https://ebas-data.nilu.no/Default.aspx (last access: 14 October 2023) and https://doi/org/10.17617/3.90 (Tørseth et al., 2012; Franco et al., 2022).
CS, MKS, TO, and PR designed the research idea, and CS performed the simulations. TO and DY developed the CLUST model, and CS performed the EC-Earth3 implementations. TO contributed to writing the CLUST model description. MKS, PR, TO, and SMB contributed to ideas in the discussion. LPN provided access to the EC-Earth3 model code and initial data sets.
The contact author has declared that none of the authors has any competing interests.
Publisher’s note: Copernicus Publications remains neutral with regard to jurisdictional claims made in the text, published maps, institutional affiliations, or any other geographical representation in this paper. While Copernicus Publications makes every effort to include appropriate place names, the final responsibility lies with the authors.
The computations and data handling were enabled by resources provided by the National Academic Infrastructure for Supercomputing in Sweden (NAISS) and the Swedish National Infrastructure for Computing (SNIC) at Tetralith, partially funded by the Swedish Research Council through grant agreement nos. 2022-06725 and 2018-05973. The authors thank the Centre for Scientific and Technical Computing at Lund University (LUNARC), partially funded by the Swedish Research Council through grant agreement nos. 2022-06725 and 2018-05973. The authors thank Markku Kulmala and Pasi Aalto for DMPS measurements obtained at SMEARII, Hans Areskoug for DMPS measurements obtained at Aspvreten station, and Adam Kristensson for DMPS measurements obtained at Hyltemossa station. Additional thanks go to David Picard, Jean-Marc Metzger, and Karine Sellegri for SMPS measurements from La Réunion station and Juan Andrés Casquero Vera for SMPS measurements from Granada station. The authors also thank Markus Fiebig and Chris Lunder for DMPS measurements at Zeppelin station, Jean Putaud and Sebastiao Martins Dos Santos for measurements at Ispra station, and Nicolas Bukowiecki and Urs Baltensperger for measurements at Zeppelin station. The authors appreciate the dedication, commitment, and efforts of Randolph Borys, Gannet Hallar, Ian McCubbin, Dan Gilchrist, and Peter Atkins towards the long-term measurements of aerosols at Storm Peak Laboratory (SPL). We appreciate the data management support (including QA/QC) of Chris Rapp and Maria Garcia. Instrumentation at SPL used in this analysis was purchased via grants AGS-0079486 and AGS-1040085 from the US National Science Foundation. The authors thank the National Institute of Meteorological Sciences (NIMS) funded by Developing Technology for Asian Dust and Haze Monitoring and Prediction (KMA2018-00521) for SMPS measurements at Anmyeon-do. We acknowledge the use of particle size distribution data measured at the Izaña Observatory and kindly provided by the Meteorological State Agency of Spain within the framework of the GAW-WMO and ACTRIS programs; the work of the technical staff and scientists in guaranteeing the quality of the data is recognized. The authors give great thanks to Roland Schrödner, Twan van Noije, Philippe le Seger, Klaus Wyser, and the EC-Earth Atmospheric Composition Working Group for their assistance. Additional appreciation and thanks go to the ModEling the Regional and Global Earth System (MERGE) community and board.
This project was funded by the Swedish Research Council for Sustainable Development, Formas (project no. 2018-01745-COBACCA, grant no. 2018-01745). This research has also been supported by Formas grant 2019-01433, the Swedish Research Council (Vetenskapsrådet, grant nos. 2019-05006 and 2019-04853), the EU Horizon Europe project AVENGERS (grant no. 101081322), the Crafoord Foundation (grant no. 20210969), the EU Horizon project PAREMPI (grant no. 101096133), the European Union’s Horizon 2020 research and innovation program (project FORCeS under grant agreement no. 821205), the European Research Council (consolidator grant INTERGRATE no. 865799), and the Knut and Alice Wallenberg Foundation (Wallenberg Academy Fellowship project AtmoRemove, grant no. 2015.0162).
The publication of this article was funded by the Swedish Research Council, Forte, Formas, and Vinnova.
This paper was edited by Holger Tost and reviewed by two anonymous referees.
Aan de Brugh, J. M. J., Schaap, M., Vignati, E., Dentener, F., Kahnert, M., Sofiev, M., Huijnen, V., and Krol, M. C.: The European aerosol budget in 2006, Atmos. Chem. Phys., 11, 1117–1139, https://doi.org/10.5194/acp-11-1117-2011, 2011. a
Abdul-Razzak, H. and Ghan, S. J.: A parameterization of aerosol activation: 2. multiple aerosol types, J. Geophys. Res.-Atmos., 105, 6837–6844, https://doi.org/10.1029/1999jd901161, 2000. a
Albrecht, B. A.: Aerosols, cloud microphysics, and fractional cloudiness, Science, 245, 1227–1230, https://doi.org/10.1126/science.245.4923.1227, 1989. a
Atkinson, R., Baulch, D. L., Cox, R. A., Crowley, J. N., Hampson, R. F., Hynes, R. G., Jenkin, M. E., Rossi, M. J., Troe, J., and IUPAC Subcommittee: Evaluated kinetic and photochemical data for atmospheric chemistry: Volume II – gas phase reactions of organic species, Atmos. Chem. Phys., 6, 3625–4055, https://doi.org/10.5194/acp-6-3625-2006, 2006. a
Balsamo, G., Beljaars, A., Scipal, K., Viterbo, P., van den Hurk, B., Hirschi, M., and Betts, A. K.: A revised hydrology for the ECMWF model: Verification from field site to terrestrial water storage and impact in the Integrated Forecast System, J. Hydrometeorol., 10, 623–643, https://doi.org/10.1175/2008jhm1068.1, 2009. a
Bergman, T., Makkonen, R., Schrödner, R., Swietlicki, E., Phillips, V. T. J., Le Sager, P., and van Noije, T.: Description and evaluation of a secondary organic aerosol and new particle formation scheme within TM5-MP v1.2, Geosci. Model Dev., 15, 683–713, https://doi.org/10.5194/gmd-15-683-2022, 2022. a, b, c
Besel, V., Kubečka, J., Kurtén, T., and Vehkamäki, H.: Impact of quantum chemistry parameter choices and cluster distribution model settings on modeled atmospheric particle formation rates, J. Phys. Chem. A, 124, 5931–5943, https://doi.org/10.1021/acs.jpca.0c03984, 2020. a, b, c
Canadell, J., Monteiro, P., Costa, M., Cotrim da Cunha, L., Cox, P., Eliseev, A., Henson, S., Ishii, M., Jaccard, S., Koven, C., Lohila, A., Patra, P., Piao, S., Rogelj, J., Syampungani, S., Zaehle, S., and Zickfeld, K.: Global Carbon and other Biogeochemical Cycles and Feedbacks, Cambridge University Press, Cambridge, United Kingdom and New York, NY, USA, 673–816, https://doi.org/10.1017/9781009157896.007, 2021. a, b
Carlsson, P. T., Celik, S., Becker, D., Olenius, T., Elm, J., and Zeuch, T.: Neutral sulfuric acid–water clustering rates: Bridging the gap between molecular simulation and experiment, J. Phys. Chem. Lett., 11, 4239–4244, https://doi.org/10.1021/acs.jpclett.0c01045, 2020. a
Craig, A., Valcke, S., and Coquart, L.: Development and performance of a new version of the OASIS coupler, OASIS3-MCT_3.0, Geosci. Model Dev., 10, 3297–3308, https://doi.org/10.5194/gmd-10-3297-2017, 2017. a
Dunne, E. M., Gordon, H., Kürten, A., Almeida, J., Duplissy, J., Williamson, C., Ortega, I. K., Pringle, K. J., Adamov, A., Baltensperger, U., Barmet, P., Benduhn, F., Bianchi, F., Breitenlechner, M., Clarke, A., Curtius, J., Dommen, J., Donahue, N. M., Ehrhart, S., Flagan, R. C., Franchin, A., Guida, R., Hakala, J., Hansel, A., Heinritzi, M., Jokinen, T., Kangasluoma, J., Kirkby, J., Kulmala, M., Kupc, A., Lawler, M. J., Lehtipalo, K., Makhmutov, V., Mann, G., Mathot, S., Merikanto, J., Miettinen, P., Nenes, A., Onnela, A., Rap, A., Reddington, C. L. S., Riccobono, F., Richards, N. A. D., Rissanen, M. P., Rondo, L., Sarnela, N., Schobesberger, S., Sengupta, K., Simon, M., Sipilä, M., Smith, J. N., Stozkhov, Y., Tomé, A., Tröstl, J., Wagner, P. E., Wimmer, D., Winkler, P. M., Worsnop, D. R., and Carslaw, K. S.: Global atmospheric particle formation from CERN CLOUD measurements, Science, 354, 1119–1124, https://doi.org/10.1126/science.aaf2649, 2016. a, b, c, d
Ehn, M., Thornton, J., Kleist, E., Sipilä, M., Junninen, H., Pullinen, I., Springer, M., Rubach, F., Tillmann, R., Lee, B., Lopez-Hilfiker, F., Andrés, S., Acir, I.-H., Rissanen, M., Jokinen, T., Schobesberger, S., Kangasluoma, J., Kontkanen, J., Nieminen, T., and Mentel, T.: A large source of low-volatility secondary organic aerosol, Nature, 506, 476–479, https://doi.org/10.1038/nature13032, 2014. a
Elm, J., Kubečka, J., Besel, V., Jääskeläinen, M. J., Halonen, R., Kurtén, T., and Vehkamäki, H.: Modeling the formation and growth of atmospheric molecular clusters: A Review, J. Aerosol Sci., 149, 105621, https://doi.org/10.1016/j.jaerosci.2020.105621, 2020. a
Feng, L., Smith, S. J., Braun, C., Crippa, M., Gidden, M. J., Hoesly, R., Klimont, Z., van Marle, M., van den Berg, M., and van der Werf, G. R.: The generation of gridded emissions data for CMIP6, Geosci. Model Dev., 13, 461–482, https://doi.org/10.5194/gmd-13-461-2020, 2020. a
Forster, P., Storelvmo, T., Armour, K., Collins, W., Dufresne, J.-L., Frame, D., Lunt, D., Mauritsen, T., Palmer, M., Watanabe, M., Wild, M., and Zhang, H.: The Earth’s Energy Budget, Climate Feedbacks, and Climate Sensitivity, Cambridge University Press, Cambridge, United Kingdom and New York, NY, USA, 923–1054, https://doi.org/10.1017/9781009157896.009, 2021. a
Franco, M. A., Kremper, L. A., Ditas, F., Pöhlker, C., Artaxo, P., and Walter, D.: SMPS dataset at ATTO, Edmond [data set], https://doi.org/10.17617/3.90, 2022. a, b, c
Ghan, S. J.: Technical Note: Estimating aerosol effects on cloud radiative forcing, Atmos. Chem. Phys., 13, 9971–9974, https://doi.org/10.5194/acp-13-9971-2013, 2013. a
Gordon, H., Kirkby, J., Baltensperger, U., Bianchi, F., Breitenlechner, M., Curtius, J., Dias, A., Dommen, J., Donahue, N. M., Dunne, E. M., Duplissy, J., Ehrhart, S., Flagan, R. C., Frege, C., Fuchs, C., Hansel, A., Hoyle, C. R., Kulmala, M., Kürten, A., Lehtipalo, K., Makhmutov, V., Molteni, U., Rissanen, M. P., Stozkhov, Y., Tröstl, J., Tsagkogeorgas, G., Wagner, R., Williamson, C., Wimmer, D., Winkler, P. M., Yan, C., and Carslaw, K. S.: Causes and importance of new particle formation in the present-day and preindustrial atmospheres, J. Geophys. Res.-Atmos., 122, 8739–8760, https://doi.org/10.1002/2017JD026844, 2017. a
Guenther, A. B., Jiang, X., Heald, C. L., Sakulyanontvittaya, T., Duhl, T., Emmons, L. K., and Wang, X.: The Model of Emissions of Gases and Aerosols from Nature version 2.1 (MEGAN2.1): an extended and updated framework for modeling biogenic emissions, Geosci. Model Dev., 5, 1471–1492, https://doi.org/10.5194/gmd-5-1471-2012, 2012. a
Hogan, R. J. and Bozzo, A.: A Flexible and Efficient Radiation Scheme for the ECMWF Model, J. Adv. Model. Earth Sy., 10, 1990–2008, https://doi.org/10.1029/2018MS001364, 2018. a
Jokinen, T., Berndt, T., Makkonen, R., Kerminen, V.-M., Junninen, H., Paasonen, P., Stratmann, F., Herrmann, H., Guenther, A. B., Worsnop, D. R., Kulmala, M., Ehn, M., and Sipilä, M.: Production of extremely low volatile organic compounds from biogenic emissions: Measured yields and atmospheric implications, P. Natl. Acad. Sci. USA, 112, 7123–7128, https://doi.org/10.1073/pnas.1423977112, 2015. a
Kerminen, V.-M. and Kulmala, M.: Analytical formulae connecting the “real” and the “apparent” nucleation rate and the nuclei number concentration for atmospheric nucleation events, J. Aerosol Sci., 33, 609–622, https://doi.org/10.1016/s0021-8502(01)00194-x, 2002. a, b
Kirkby, J., Curtius, J., Almeida, J., Dunne, E. M., Duplissy, J., Ehrhart, S., Franchin, A., Gagné, S., Ickes, L., Kürten, A., Kupc, A., Metzger, A., Riccobono, F., Rondo, L., Schobesberger, S., Tsagkogeorgas, G., Wimmer, D., Amorim, A., Bianchi, F., Breitenlechner, M., David, A., Dommen, J., Downard, A. J., Ehn, M., Flagan, R. C., Haider, S., Hansel, A., Hauser, D., Jud, W., Junninen, H., Kreissl, F., Kvashin, A. N., Laaksonen, A., Lehtipalo, K., Lima, J., Lovejoy, E. R., Makhmutov, V., Mathot, S., Mikkilä, J., Minginette, P., Mogo, S., Nieminen, T. A., Onnela, A., Pereira, P. J., Petäjä, T., Schnitzhofer, R., Seinfeld, J. H., Sipilä, M., Stozhkov, Y. I., Stratmann, F., Tomé, A., Vanhanen, J., Viisanen, Y., Vrtala, A. E., Wagner, P. E., Walther, H., Weingartner, E., Wex, H., Winkler, P. M., Carslaw, K. S., Worsnop, D. R., Baltensperger, U., and Kulmala, M.: Role of sulphuric acid, ammonia and galactic cosmic rays in atmospheric aerosol nucleation, Nature, 476, 429–433, https://doi.org/10.1038/nature10343, 2011. a
Krol, M., Houweling, S., Bregman, B., van den Broek, M., Segers, A., van Velthoven, P., Peters, W., Dentener, F., and Bergamaschi, P.: The two-way nested global chemistry-transport zoom model TM5: algorithm and applications, Atmos. Chem. Phys., 5, 417–432, https://doi.org/10.5194/acp-5-417-2005, 2005. a
Kulmala, M., Vehkamäki, H., Petaja, T., Dal Maso, M., Lauri, A., Kerminen, V.-M., Birmili, W., and McMurry, P.: Formation and growth rates of ultrafine atmospheric particles: A review of observations, J. Aerosol Sci., 35, 143–176, https://doi.org/10.1016/j.jaerosci.2003.10.003, 2004. a
Kulmala, M., Kontkanen, J., Junninen, H., Lehtipalo, K., Manninen, H. E., Nieminen, T., Petäjä, T., Sipilä, M., Schobesberger, S., Rantala, P., Franchin, A., Jokinen, T., Järvinen, E., Äijälä, M., Kangasluoma, J., Hakala, J., Aalto, P. P., Paasonen, P., Mikkilä, J., Vanhanen, J., Aalto, J., Hakola, H., Makkonen, U., Ruuskanen, T., Mauldin, R. L., Duplissy, J., Vehkamäki, H., Bäck, J., Kortelainen, A., Riipinen, I., Kurtén, T., Johnston, M. V., Smith, J. N., Ehn, M., Mentel, T. F., Lehtinen, K. E. J., Laaksonen, A., Kerminen, V.-M., and Worsnop, D. R.: Direct Observations of Atmospheric Aerosol Nucleation, Science, 339, 943–946, https://doi.org/10.1126/science.1227385, 2013. a
Kürten, A., Bianchi, F., Almeida, J., Kupiainen-Määttä, O., Dunne, E., Duplissy, J., Williamson, C., Barmet, P., Breitenlechner, M., Dommen, J., Donahue, N., Flagan, R., Franchin, A., Gordon, H., Hakala, J., Hansel, A., Heinritzi, M., Ickes, L., Jokinen, T., Kangasluoma, J., Kim, J., Kirkby, J., Kupc, A., Lehtipalo, K., Leiminger, M., Makhmutov, V., Onnela, A., Ortega, I., Petäjä, T., Praplan, A., Riccobono, F., Rissanen, M., Rondo, L., Schnitzhofer, R., Schobesberger, S., Smith, J., Steiner, G., Stozhkov, Y., Tomé, A., Tröstl, J., Tsagkogeorgas, G., Wagner, P., Wimmer, D., Ye, P., Baltensperger, U., Carslaw, K., Kulmala, M., and Curtius, J.: Experimental particle formation rates spanning tropospheric sulfuric acid and ammonia abundances, ion production rates, and temperatures, J. Geophys. Res., 121, 12377–12400, https://doi.org/10.1002/2015JD023908, 2016. a, b
Lamarque, J.-F., Bond, T. C., Eyring, V., Granier, C., Heil, A., Klimont, Z., Lee, D., Liousse, C., Mieville, A., Owen, B., Schultz, M. G., Shindell, D., Smith, S. J., Stehfest, E., Van Aardenne, J., Cooper, O. R., Kainuma, M., Mahowald, N., McConnell, J. R., Naik, V., Riahi, K., and van Vuuren, D. P.: Historical (1850–2000) gridded anthropogenic and biomass burning emissions of reactive gases and aerosols: methodology and application, Atmos. Chem. Phys., 10, 7017–7039, https://doi.org/10.5194/acp-10-7017-2010, 2010. a
Mann, G. W., Carslaw, K. S., Ridley, D. A., Spracklen, D. V., Pringle, K. J., Merikanto, J., Korhonen, H., Schwarz, J. P., Lee, L. A., Manktelow, P. T., Woodhouse, M. T., Schmidt, A., Breider, T. J., Emmerson, K. M., Reddington, C. L., Chipperfield, M. P., and Pickering, S. J.: Intercomparison of modal and sectional aerosol microphysics representations within the same 3-D global chemical transport model, Atmos. Chem. Phys., 12, 4449–4476, https://doi.org/10.5194/acp-12-4449-2012, 2012. a
Martin, G. M., Johnson, D. W., and Spice, A.: The measurement and parameterization of effective radius of droplets in warm stratocumulus clouds, Journal of the Atmospheric Sciences, 51, 1823–1842, https://doi.org/10.1175/1520-0469(1994)051<1823:TMAPOE>2.0.CO;2, 1994. a
Merikanto, J., Spracklen, D. V., Mann, G. W., Pickering, S. J., and Carslaw, K. S.: Impact of nucleation on global CCN, Atmos. Chem. Phys., 9, 8601–8616, https://doi.org/10.5194/acp-9-8601-2009, 2009. a
Metzger, A., Verheggen, B., Dommen, J., Duplissy, J., Prevot, A. S. H., Weingartner, E., Riipinen, I., Kulmala, M., Spracklen, D. V., Carslaw, K. S., and Baltensperger, U.: Evidence for the role of organics in aerosol particle formation under atmospheric conditions, P. Natl. Acad. Sci. USA, 107, 6646–6651, https://doi.org/10.1073/pnas.0911330107, 2010. a
Olenius, T.: Atmospheric Cluster Dynamics Code Github Repository, GitHub [code], https://github.com/tolenius/ACDC (last access: 26 September 2022), 2021. a
Olenius, T., Kupiainen-Määttä, O., Ortega, I. K., Kurtén, T., and Vehkamäki, H.: Free energy barrier in the growth of sulfuric acid–ammonia and sulfuric acid–dimethylamine clusters, J. Chem. Phys., 139, 084312, https://doi.org/10.1063/1.4819024, 2013. a, b, c, d
Öström, E., Putian, Z., Schurgers, G., Mishurov, M., Kivekäs, N., Lihavainen, H., Ehn, M., Rissanen, M. P., Kurtén, T., Boy, M., Swietlicki, E., and Roldin, P.: Modeling the role of highly oxidized multifunctional organic molecules for the growth of new particles over the boreal forest region, Atmos. Chem. Phys., 17, 8887–8901, https://doi.org/10.5194/acp-17-8887-2017, 2017. a
Paasonen, P., Nieminen, T., Asmi, E., Manninen, H. E., Petäjä, T., Plass-Dülmer, C., Flentje, H., Birmili, W., Wiedensohler, A., Hõrrak, U., Metzger, A., Hamed, A., Laaksonen, A., Facchini, M. C., Kerminen, V.-M., and Kulmala, M.: On the roles of sulphuric acid and low-volatility organic vapours in the initial steps of atmospheric new particle formation, Atmos. Chem. Phys., 10, 11223–11242, https://doi.org/10.5194/acp-10-11223-2010, 2010. a
Riccobono, F., Schobesberger, S., Scott, C. E., Dommen, J., Ortega, I. K., Rondo, L., Almeida, J., Amorim, A., Bianchi, F., Breitenlechner,M., David, A., Downard, A., Dunne, E. M., Duplissy, J., Ehrhart, S., Flagan, R. C., Franchin, A., Hansel, A., Junninen, H., Kajos, M., Keskinen, H., Kupc, A., Kürten, A., Kvashin, A. N., Laaksonen, A., Lehtipalo, K., Makhmutov, V., Mathot, S., Nieminen, T., Onnela, A., Petäjä, T., Praplan, A. P., Santos, F. D., Schallhart, S., Seinfeld, J. H., Sipilä, M., Spracklen, D. V., Stozhkov, Y., Stratmann, F., Tomé, A., Tsagkogeorgas, G., Vaattovaara, P., Viisanen, Y., Vrtala, A., Wagner, P. E., Weingartner, E., Wex, H., Wimmer, D., Carslaw, K. S., Curtius, J., Donahue, N. M., Kirkby, J., Kulmala, M., Worsnop, D. R., and Baltensperger, U.: Oxidation Products of Biogenic Emissions Contribute to Nucleation of Atmospheric Particles, Science, 344, 717–721, https://doi.org/10.1126/science.1243527, 2014. a, b, c, d, e, f, g
Roldin, P., Ehn, M., Kurtén, T., Olenius, T., Rissanen, M., Sarnela, N., Elm, J., Rantala, P., Hao, L., Hyttinen, N., Heikkinen, L., Worsnop, D., Pichelstorfer, L., Xavier, C., Clusius, P., Öström, E., Petäjä, T., Kulmala, M., Vehkamäki, H., and Boy, M.: The role of highly oxygenated organic molecules in the Boreal aerosol-cloud-climate system, Nat. Commun., 10, 4370, https://doi.org/10.1038/s41467-019-12338-8, 2019. a, b, c, d
Shrivastava, M., Cappa, C. D., Fan, J., Goldstein, A. H., Guenther, A. B., Jimenez, J. L., Kuang, C., Laskin, A., Martin, S. T., Ng, N. L., Petaja, T., Pierce, J. R., Rasch, P. J., Roldin, P., Seinfeld, J. H., Shilling, J., Smith, J. N., Thornton, J. A., Volkamer, R., Wang, J., Worsnop, D. R., Zaveri, R. A., Zelenyuk, A., and Zhang, Q.: Recent advances in understanding secondary organic aerosol: Implications for global climate forcing, Rev. Geophys., 55, 509–559, https://doi.org/10.1002/2016RG000540, 2017. a, b
Sindelarova, K., Granier, C., Bouarar, I., Guenther, A., Tilmes, S., Stavrakou, T., Müller, J.-F., Kuhn, U., Stefani, P., and Knorr, W.: Global data set of biogenic VOC emissions calculated by the MEGAN model over the last 30 years, Atmos. Chem. Phys., 14, 9317–9341, https://doi.org/10.5194/acp-14-9317-2014, 2014. a
Sporre, M. K., Blichner, S. M., Schrödner, R., Karset, I. H. H., Berntsen, T. K., van Noije, T., Bergman, T., O'Donnell, D., and Makkonen, R.: Large difference in aerosol radiative effects from BVOC-SOA treatment in three Earth system models, Atmos. Chem. Phys., 20, 8953–8973, https://doi.org/10.5194/acp-20-8953-2020, 2020. a, b, c, d, e
Svenhag, C.: TM5-MP model version 1.2 code used in cb05_CLUST NPF project, Zenodo [code], https://doi.org/10.5281/zenodo.10517639, 2024a. a
Svenhag, C.: Data for: Implementing detailed nucleation predictions in the Earth system model EC- Earth3.3.4: sulfuric acid-ammonia nucleation, Zenodo [data set], https://doi.org/10.5281/zenodo.10468610, 2024b. a
Svenhag, C.: Post-process handling scripts for publication: “Implementing detailed nucleation predictions in the Earth system model EC-Earth3.3.4: sulfuric acid-ammonia nucleation”, Zenodo [code and data set], https://doi.org/10.5281/zenodo.10512456, 2024c. a
Tørseth, K., Aas, W., Breivik, K., Fjæraa, A. M., Fiebig, M., Hjellbrekke, A. G., Lund Myhre, C., Solberg, S., and Yttri, K. E.: Introduction to the European Monitoring and Evaluation Programme (EMEP) and observed atmospheric composition change during 1972–2009, Atmos. Chem. Phys., 12, 5447–5481, https://doi.org/10.5194/acp-12-5447-2012, 2012. a, b, c
Tröstl, J., Chuang, W., Gordon, H., Heinritzi, M., Yan, C., Molteni, U., Ahlm, L., Frege, C., Bianchi, F., Wagner, R., Simon, M., Lehtipalo, K., Williamson, C., Craven, J., Duplissy, J., Adamov, A., Almeida, J., Bernhammer, A.-K., Breitenlechner, M., and Baltensperger, U.: The role of low-volatility organic compounds in initial particle growth in the atmosphere, Nature, 533, 527–531, https://doi.org/10.1038/nature18271, 2016. a
Tsigaridis, K., Daskalakis, N., Kanakidou, M., Adams, P. J., Artaxo, P., Bahadur, R., Balkanski, Y., Bauer, S. E., Bellouin, N., Benedetti, A., Bergman, T., Berntsen, T. K., Beukes, J. P., Bian, H., Carslaw, K. S., Chin, M., Curci, G., Diehl, T., Easter, R. C., Ghan, S. J., Gong, S. L., Hodzic, A., Hoyle, C. R., Iversen, T., Jathar, S., Jimenez, J. L., Kaiser, J. W., Kirkevåg, A., Koch, D., Kokkola, H., Lee, Y. H., Lin, G., Liu, X., Luo, G., Ma, X., Mann, G. W., Mihalopoulos, N., Morcrette, J.-J., Müller, J.-F., Myhre, G., Myriokefalitakis, S., Ng, N. L., O'Donnell, D., Penner, J. E., Pozzoli, L., Pringle, K. J., Russell, L. M., Schulz, M., Sciare, J., Seland, Ø., Shindell, D. T., Sillman, S., Skeie, R. B., Spracklen, D., Stavrakou, T., Steenrod, S. D., Takemura, T., Tiitta, P., Tilmes, S., Tost, H., van Noije, T., van Zyl, P. G., von Salzen, K., Yu, F., Wang, Z., Wang, Z., Zaveri, R. A., Zhang, H., Zhang, K., Zhang, Q., and Zhang, X.: The AeroCom evaluation and intercomparison of organic aerosol in global models, Atmos. Chem. Phys., 14, 10845–10895, https://doi.org/10.5194/acp-14-10845-2014, 2014. a
Twomey, S.: Pollution and the planetary albedo, Atmospheric Environment (1967), 8, 1251–1256, https://doi.org/10.1016/0004-6981(74)90004-3, 1974. a
Usoskin, I. and Kovaltsov, G.: Cosmic ray induced ionization in the atmosphere: full modeling and practical applications, J. Geophys. Res.-Atmos., 111, 21206, https://doi.org/10.1029/2006JD007150, 2006. a
van Noije, T., Bergman, T., Le Sager, P., O'Donnell, D., Makkonen, R., Gonçalves-Ageitos, M., Döscher, R., Fladrich, U., von Hardenberg, J., Keskinen, J.-P., Korhonen, H., Laakso, A., Myriokefalitakis, S., Ollinaho, P., Pérez García-Pando, C., Reerink, T., Schrödner, R., Wyser, K., and Yang, S.: EC-Earth3-AerChem: a global climate model with interactive aerosols and atmospheric chemistry participating in CMIP6 , Geosci. Model Dev., 14, 5637–5668, https://doi.org/10.5194/gmd-14-5637-2021, 2021. a, b, c, d, e, f
van Noije, T. P. C., Le Sager, P., Segers, A. J., van Velthoven, P. F. J., Krol, M. C., Hazeleger, W., Williams, A. G., and Chambers, S. D.: Simulation of tropospheric chemistry and aerosols with the climate model EC-Earth, Geosci. Model Dev., 7, 2435–2475, https://doi.org/10.5194/gmd-7-2435-2014, 2014. a, b, c
Vehkamäki, H.: An improved parameterization for sulfuric acid–water nucleation rates for tropospheric and stratospheric conditions, J. Geophys. Res., 107, 4622, https://doi.org/10.1029/2002jd002184, 2002. a, b
Vignati, E., Wilson, J., and Stier, P.: M7: An efficient size-resolved aerosol microphysics module for large-scale aerosol transport models, J. Geophys. Res.-Atmos., 109, D22202, https://doi.org/10.1029/2003jd004485, 2004. a, b
Williams, J. E., Boersma, K. F., Le Sager, P., and Verstraeten, W. W.: The high-resolution version of TM5-MP for optimized satellite retrievals: description and validation, Geosci. Model Dev., 10, 721–750, https://doi.org/10.5194/gmd-10-721-2017, 2017. a
Wollesen de Jonge, R., Elm, J., Rosati, B., Christiansen, S., Hyttinen, N., Lüdemann, D., Bilde, M., and Roldin, P.: Secondary aerosol formation from dimethyl sulfide – improved mechanistic understanding based on smog chamber experiments and modelling, Atmos. Chem. Phys., 21, 9955–9976, https://doi.org/10.5194/acp-21-9955-2021, 2021. a
Wyser, K., van Noije, T., Yang, S., von Hardenberg, J., O'Donnell, D., and Döscher, R.: On the increased climate sensitivity in the EC-Earth model from CMIP5 to CMIP6, Geosci. Model Dev., 13, 3465–3474, https://doi.org/10.5194/gmd-13-3465-2020, 2020. a
Yazgi, D. and Olenius, T.: J-gain: Generator and interpolator for look-up tables of aerosol particle formation rates, GitHub [code], https://github.com/tolenius/J-GAIN (last access: 26 September 2022), 2021. a
Yazgi, D. and Olenius, T.: J-GAIN V1.1.0, Zenodo [data set], https://doi.org/10.5281/zenodo.8220223, 2023a. a
Yazgi, D. and Olenius, T.: J-GAIN v1.1: a flexible tool to incorporate aerosol formation rates obtained by molecular models into large-scale models, Geosci. Model Dev., 16, 5237–5249, https://doi.org/10.5194/gmd-16-5237-2023, 2023bb. a, b, c
Yu, F.: Lookup tables for H2SO4-H2O binary and H2SO4-H2O-NH3 ternary homogeneous and ion-mediated nucleation, Zenodo [code], https://doi.org/10.5281/zenodo.3483797, 2019. a
Yu, F., Nadykto, A. B., Luo, G., and Herb, J.: H2SO4–H2O binary and H2SO4–H2O–NH3 ternary homogeneous and ion-mediated nucleation: lookup tables version 1.0 for 3-D modeling application, Geosci. Model Dev., 13, 2663–2670, https://doi.org/10.5194/gmd-13-2663-2020, 2020. a, b