the Creative Commons Attribution 4.0 License.
the Creative Commons Attribution 4.0 License.
 | 13 May 2024
Investigating the impact of coupling HARMONIE-WINS50 (cy43) meteorology to LOTOS-EUROS (v2.2.002) on a simulation of NO2 concentrations over the Netherlands
Andrés Yarce Botero
Michiel van Weele
Arjo Segers
Pier Siebesma
Henk Eskes
Meteorological fields calculated by numerical weather prediction (NWP) models drive offline chemical transport models (CTMs) to solve the transport, chemical reactions, and atmospheric interaction over the geographical domain of interest. HARMONIE (HIRLAM ALADIN Research on Mesoscale Operational NWP in Euromed) is a state-of-the-art non-hydrostatic NWP community model used at several European weather agencies to forecast weather at the local and/or regional scale. In this work, the HARMONIE WINS50 (cycle 43 cy43) reanalysis dataset at a resolution of 0.025° × 0.025° covering an area surrounding the North Sea for the years 2019–2021 was coupled offline to the LOTOS-EUROS (LOng-Term Ozone Simulation-EURopean Operational Smog model, v2.2.002) CTM. The impact of using either meteorological fields from HARMONIE or from ECMWF on LOTOS-EUROS simulations of NO2 has been evaluated against ground-level observations and TROPOMI tropospheric NO2 vertical columns. Furthermore, the difference between crucial meteorological input parameters such as the boundary layer height and the vertical diffusion coefficient between the hydrostatic ECMWF and non-hydrostatic HARMONIE data has been studied, and the vertical profiles of temperature, humidity, and wind are evaluated against meteorological observations at Cabauw in The Netherlands. The results of these first evaluations of the LOTOS-EUROS model performance in both configurations are used to investigate current uncertainties in air quality forecasting in relation to driving meteorological parameters and to assess the potential for improvements in forecasting pollution episodes at high resolutions based on the HARMONIE NWP model.
- Article
(14072 KB) - Full-text XML
-
Supplement
(21178 KB) - BibTeX
- EndNote


Numerical weather prediction (NWP) models provide the meteorological data required by chemical transport models (CTMs) to resolve the emission, transportation, chemical reactions, and other atmospheric interactions of pollutants throughout the spatiotemporal field of interest (Chang, 1980; El-Harbawi, 2013; Khan and Hassan, 2020). In this way, forecasts and (re-)analyses provided by NWP can be used for air quality forecasting, climate modelling, and environmental studies. The more precise the meteorological input data represents the atmospheric dynamics, the better the CTM represents pollutant transport, mixing, and the subsequent impact on surface air quality. Meteorological parameters related to transport and mixing have a direct impact on the surface air quality simulated by a CTM. A NWP model with a higher spatial resolution and better capabilities for resolving boundary layer turbulence dynamics and convective processes would provide a CTM with more accurate input parameters to predict the transport of pollutants, especially in the lowest kilometre(s) of the troposphere (Pielke and Uliasz, 1998).
However, it is important to note that the spatial resolution of the NWP model is not the only factor. Other factors may include the model's ability to accurately represent small-scale phenomena, turbulence dynamics, and convective processes (non-hydrostatic) compared to models that replace the vertical momentum equation by hydrostatic equilibrium (Saito et al., 2007). In addition, the quality of (operational) meteorological input is constantly improved through the data assimilation applied in NWP (Marseille and Stoffelen, 2017; Bengtsson et al., 2017; Lorenc and Jardak, 2018), which can reduce model uncertainty. Overall, it is important to carefully consider the uncertainty of the meteorological driving parameters in a CTM, as these parameters can significantly affect the accuracy and reliability of the air quality predictions.
HARMONIE (HIRLAM ALADIN Research on Mesoscale Operational NWP in Euromed) pertains to a script system and model configuration in meteorological modelling (Bengtsson et al., 2017; van Stratum et al., 2022). It is named for the scripting system utilized for data assimilation, observation handling, and operational processes in the Applications of Research to Operations at Mesoscale (AROME) model within the countries utilizing the High-Resolution Limited Area Model (HIRLAM). Additionally, “HARMONIE” denotes a particular setup of the AROME model. This updated configuration includes physical parameterizations specifically adapted for European conditions, particularly at northern latitudes. The operational high-resolution NWP model that is used in The Netherlands is generated with the HARMONIE model configuration (Haakenstad et al., 2021). The dataset that is used in this work is denoted as WINS50, which is a homogeneous HARMONIE reanalysis focusing on the North Sea region, developed by a consortium of Whiffle, TU Delft, and KNMI. The dataset covers the years 2019 to 2021 and has been created using HARMONIE cycle 43. It was evaluated for 1 year by (van Stratum et al., 2022) to show how and to what extent current wind farm structures in the North Sea can affect meteorology at local to regional scales (Verzijlbergh, 2021; Kalverla et al., 2019; Baas et al., 2022).
LOTOS-EUROS (LOng-Term Ozone Simulation-EURopean Operational Smog model) is a CTM that simulates the formation and transport of pollutants and trace gases in the atmosphere (Manders et al., 2017). The processes in the model include emission, advective transport, turbulent mixing, chemical reactions, wet and dry deposition, and sedimentation. It is a CTM that is one of the members of the Copernicus Atmosphere Monitoring Service (CAMS) regional ensemble of CTMs that is used to produce operational air quality forecasts over Europe and also at a higher spatial resolution over the Netherlands. In most applications, the model is driven by meteorological input from the European Centre for Medium-Range Weather Forecasts (ECMWF), but in this study, it has also been coupled with the HARMONIE NWP to provide a more comprehensive understanding of the formation and transport of air pollutants in the BeNeLux countries and North Sea region. In earlier studies, other meteorological drivers have been offline coupled to the LOTOS-EUROS model in one-way direction, including Weather Research and Forecasting (WRF) (Escudero et al., 2019) and COSMO (Thürkow et al., 2021). A two-way coupling was implemented between the RACMO climate model and the CTM to provide information on the impact of meteorological conditions on air pollutants and vice versa for the impact of trace gases and aerosol on weather and climate via the radiation budget (Manders-Groot et al., 2011).
In a previous study (Ding, 2013), the impact of using HARMONIE (cy36) as meteorological driver for LOTOS-EUROS (v1.8) was compared with using the standard ECMWF meteorology as driver. That study found large differences in the meteorological variables obtained from the two drivers, especially at the coast, over forest regions, and in urban areas. However, the surface temperature, relative humidity, and wind patterns were found to be very similar between the models. Since this previous study, various updates and improvements have been made to both the HARMONIE NWP model and the LOTOS-EUROS CTM, which have reached cycle 43 and version v2.2.002, respectively. Therefore, conducting a reassessment of their coupled performance is valuable.
Section 2 of this paper introduces the methodology used in the study. It includes a description of the two meteorological input fields in the configurations made for the coupling with the state-of-the-art version of LOTOS-EUROS used in this study. The coupling procedure between the meteorological driver and the CTM is explained in this section, along with the list of variables taken into account and any necessary calculations or assumptions for their correct ingestion into the CTM. Section 3 presents the results of the model simulations and their evaluation against ground-based observations and satellite-observed trace gas plumes. The comparison with observations is important to provide an independent assessment of the differences between the model simulations. The paper's final section, Sect. 4, discusses our results and provides the conclusions on the coupling of HARMONIE WINS50 NWP to LOTOS-EUROS to the extent that these can be drawn from this study. Additionally, the potential improvement in high-resolution air quality forecasts that are driven offline by non-hydrostatic meteorological data is assessed.
2.1 LOTOS-EUROS driven by ECMWF meteorology
LOTOS-EUROS is a large-scale three-dimensional CTM that simulates air pollution in the lower troposphere by solving a differential equation involving different operators, such as the transport operator, the chemical reaction operator, and the emissions or deposition operator. These operators are executed sequentially on a 3D set of grid cells covering the troposphere over the domain of interest. The horizontal advection is driven by horizontal winds (U, V) that are part of the meteorological input. When driven by ECMWF meteorology, the model calculates the vertical wind component (W) through the convergence and divergence of the horizontal winds. Turbulence-driven vertical diffusion is modelled with a separate operator. The chemistry operator simulates the chemical production and loss terms from the different chemical reactions in the atmosphere. A carbon bond mechanism with 81 reactions (Schaap et al., 2008) is used to describe the gas-phase chemistry, and interaction with aerosols follows the ISORROPIA parameterization (Fountoukis and Nenes, 2007). The dry-deposition operator is parameterized following the resistance approach (Wichink Kruit et al., 2012). The wet-deposition operator includes the below-cloud scavenging for gases (Schaap et al., 2004).
Table 1Overview of the meteorological input data of the IFS (Integrated Forecasting System) provided by the ECMWF and the HARMONIE WINS50 meteorological variables used for the coupling to LOTOS-EUROS. The variables are divided into (1) static surface fields, (2) surface and other dynamic two-dimensional variables, and (3) three-dimensional variables. HARMONIE variables with an asterisk (∗) were converted from instantaneous to accumulated.
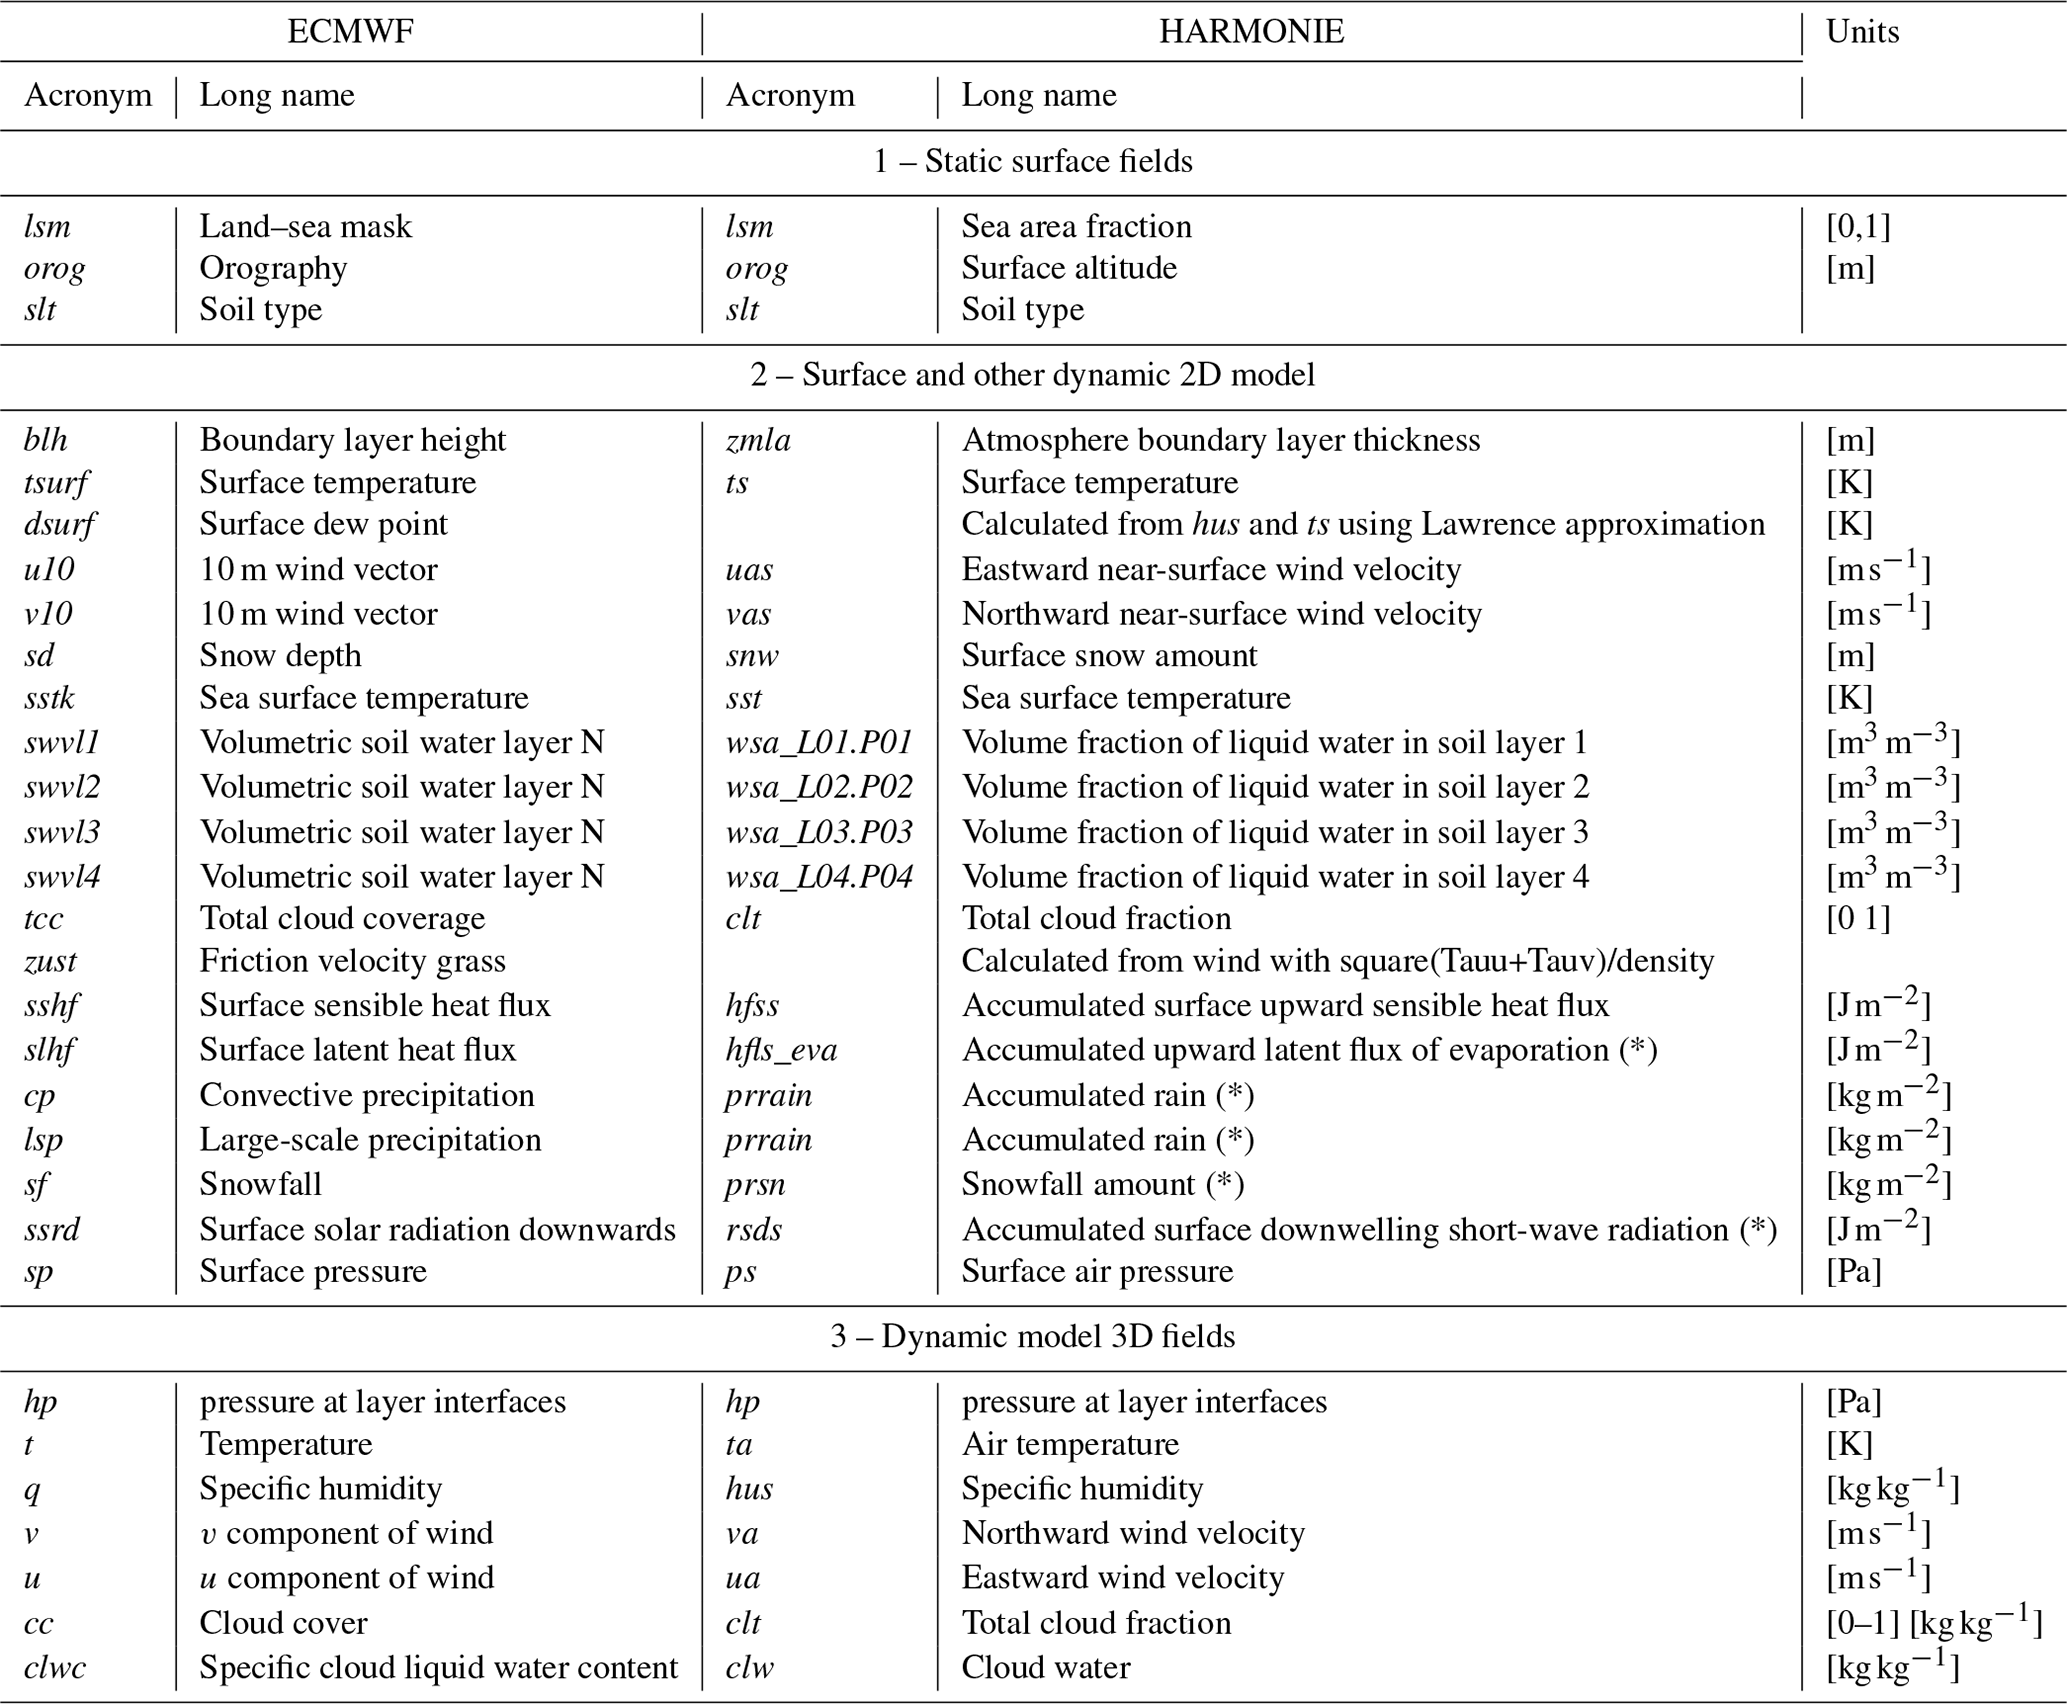
LOTOS-EUROS receives the ECMWF Integrated Forecasting System (IFS) meteorological fields on a regular longitude–latitude grid, which is then interpolated to the target grid that is either regular longitude–latitude too or uses a different projection. The vertical layers of the model are defined as a coarsening of the ECMWF hybrid sigma-pressure layers. The meteorological fields received from the ECMWF data include 3D fields of pressure, wind vectors, temperature, and humidity, as well as 2D fields of mixing layer height, precipitation rates, cloud cover, and other boundary layer and surface variables. A full overview of the meteorological fields is listed in Table 1 and described in the following section. A simulation with LOTOS-EUROS driven by ECMWF meteorology has been performed to serve as a reference for other simulations, and this will be referred to as “EC_LE”.
2.2 LOTOS-EUROS driven by HARMONIE meteorology
The HARMONIE (HIRLAM ALADIN Research on Mesoscale Operational NWP in Euromed) model is a non-hydrostatic convection-permitting numerical weather prediction model (Engdahl et al., 2020; Clark et al., 2016). In a non-hydrostatic model, the vertical momentum equation is solved directly instead of applying the hydrostatic approximation, which frequently fails during extreme weather events (Gibbon and Holm, 2011). HARMONIE incorporates various dedicated sub-models to describe atmospheric processes. One of these models is SURFEX, which simulates processes such as temperature and water balance, radiation balance, and heat transport at the surface and in the soil (Viana Jiménez and Díez Muyo, 2019). The model accounts for various types of land surfaces and processes at and below the surface to describe the interaction between the atmosphere and the surface.
Similar to the ECMWF model, the HARMONIE model uses terrain-following hybrid sigma-pressure layers that are defined by surface pressure and hybrid level coefficients provided in the data files. Although the HARMONIE model could provide non-hydrostatic vertical advective fluxes, it was decided for this study to perform a coupling with HARMONIE based on the same approach as used for ECMWF variables (see also the discussion in Sect. 4).
The particular HARMONIE simulation for this study comes from the “WINS50” project. TU Delft, Whiffle, and KNMI have formulated the WINS50 project in the framework of the TKI Wind op Zee R&D 2019 (http://www.wins50.nl, last access: 1 July 2023). The WINS50 model was run for 2019–2021 to produce winds undisturbed by wake effects (extension of the Dutch Offshore Wind Atlas, DOWA) and disturbed winds (wake-DOWA). Kalverla et al. (2019) compared the simulations of the HARMONIE model over the North Sea with other models and with observations from a mast.
2.2.1 Coupling choices
To ensure successful coupling of the HARMONIE/LOTOS-EUROS system, a systematic approach was taken comparing the available ECMWF and HARMONIE fields. This involved classifying the variables into three categories: static, surface, and 3D fields as shown in Table 1. The table was created to compare the variables' acronyms, units, and availability between the two systems. A simulation with LOTOS-EUROS driven by HARMONIE meteorology has been performed and this will be referred to as “HA_LE”. LOTOS-EUROS ingested the variables selected from HARMONIE that correspond to equivalent ECMWF variables based on the coupling choices specified in the next section. Second, decisions are taken about whether direct or indirect mapping should be done and what to do with missing variables. Third, the labelling and timestamp frequency and time bounds were corrected and the direct paths to find the data and meteorological files were generated for the LOTOS-EUROS files. Mapping half-level altitudes with half-level pressures with coefficient calculations was done using specific routines that additionally flip the order of some of the required variables. Additionally, determining and converting variables needed in either accumulated or instantaneous format was another task. The coupling strategy for HARMONIE data in this study was defined with goal to emulate the coupling with ECMWF data, thus so far without using variables that are only available from HARMONIE. This thorough approach ensured that the (HA_LE) system is technically coupled, allowing for the generation of accurate and comprehensive CTM fields driven by this new source of meteorological information. Surface dew point and friction velocity for grass were not available in the HARMONIE data. For the surface dew point the approximation in Lawrence (2005) was used. The friction velocity for grass was calculated by dividing the surface stress by air density and taking its square root.
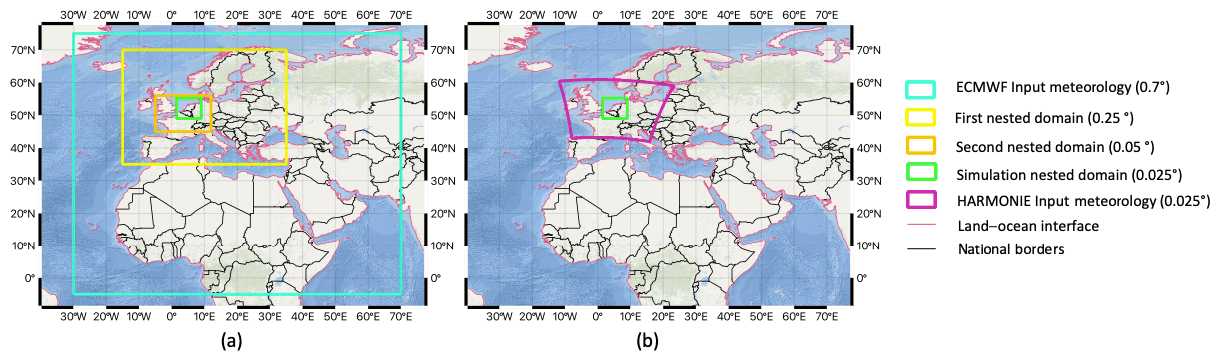
Figure 1Simulation domains used for the LOTOS-EUROS simulations using ECMWF (a) or HARMONIE (b) meteorology. Both configurations use boundary conditions from CAMS. (map from the Natural Earth collection: https://www.naturalearthdata.com/, last access: 1 July 2023).
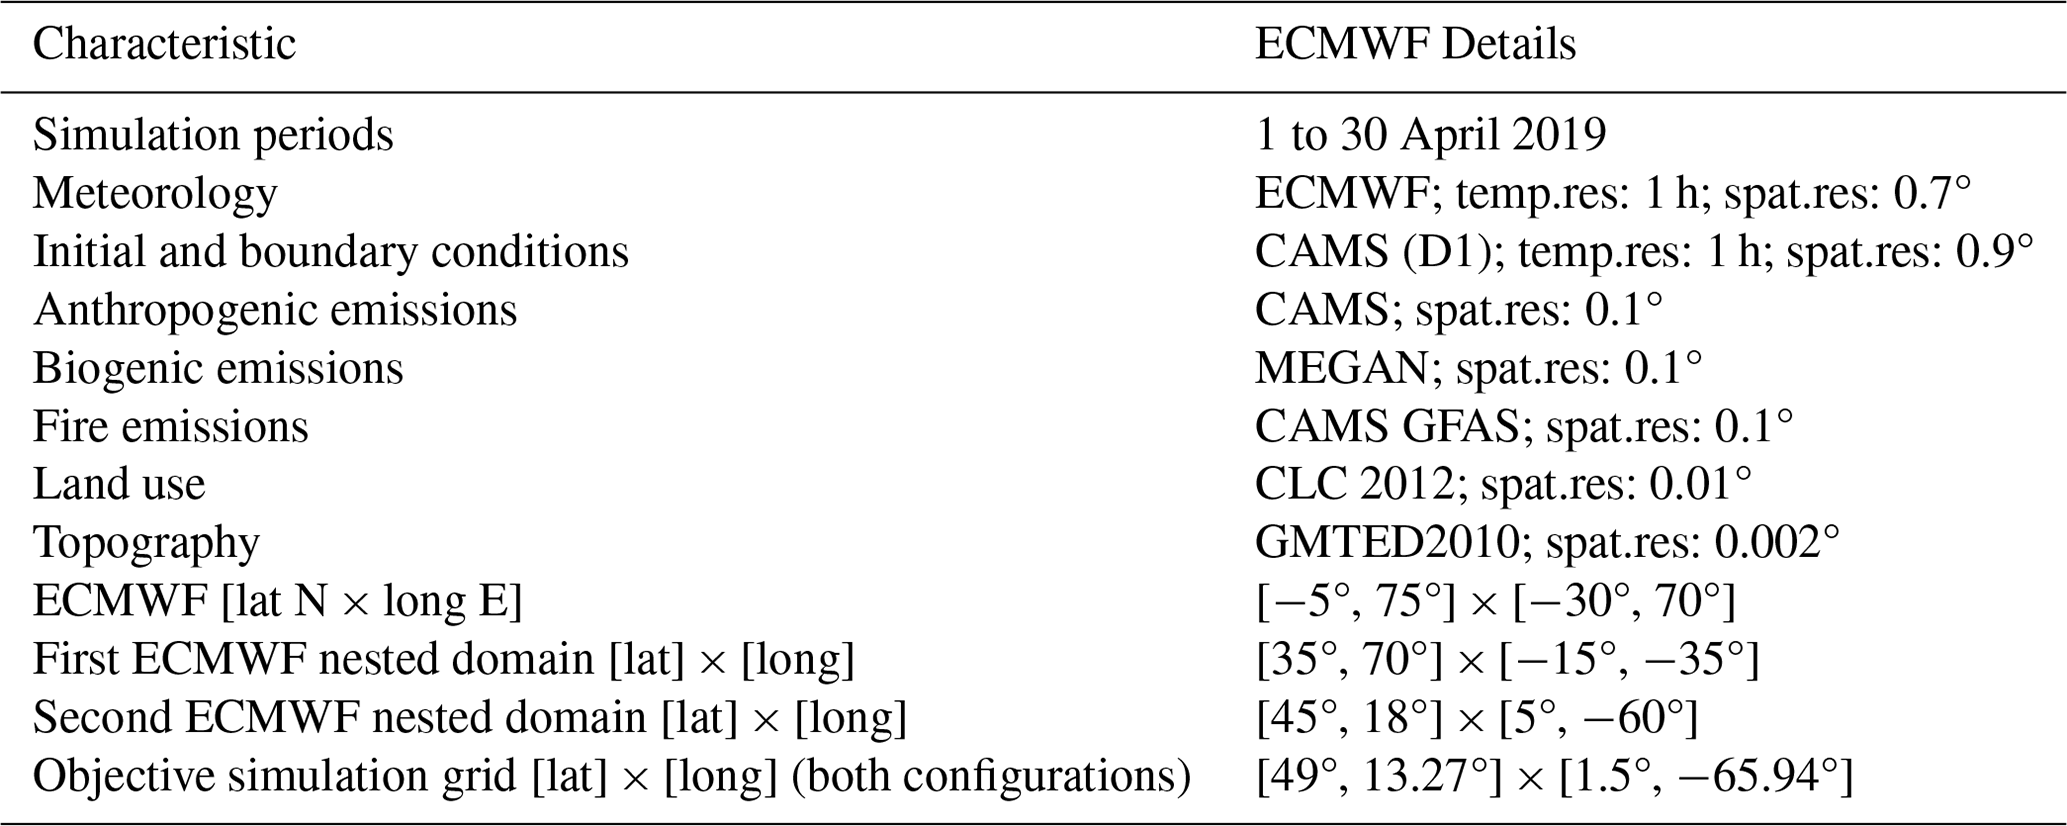
Table 2LOTOS-EUROS configuration settings for the simulations in this work with HARMONIE meteorology input. Coordinates of the domain are presented in the following format: [lat N, long E].

Table 3LOTOS-EUROS configuration settings for the simulations in this work with the ECMWF meteorology input. Coordinates of the domain are presented in the following format: [lat N, long E].
Tables 2 and 3 show the LOTOS-EUROS configuration settings for the simulations performed in this study. The simulations differ from each other in the meteorological driver. The rest of the parameters were not touched to attribute the discrepancies only to the change in meteorology. The table lists the different parameters used in the two LOTOS-EUROS configurations, including the meteorological data source, the chemical boundary conditions, emissions, land use, horizontal resolution for the objective domain and for the nested domains, and the time step used for the simulations.
2.2.2 Computational aspects
Figure 1 shows the spatial configurations of the LOTOS-EUROS CTM used with a specific meteorology drivers. The configuration for using ECMWF meteorology in Fig. 1a has three nested domains, which is common practice for more precise modelling of atmospheric conditions in areas with coarse meteorological information. The configuration for the HARMONIE meteorology in Fig. 1b only uses one domain;. In this case there is no nesting needed because the input resolution of the meteorology already has the intended resolution for the CTM. The green box is the actual domain for the “final” simulations, which is the same for both configurations.
The objective of the simulations is to obtain CTM simulations at 0.025° over The Netherlands and the North Sea. For this, the HARMONIE/LOTOS-EUROS coupling uses only one nested simulation, while the ECMWF/LOTOS-EUROS coupling uses three nested simulations. The single nested configuration provides significant computational benefits. The computational resources required for the single-level approach are a factor of 4 lower than the costs of the three-level nesting approach, while maintaining comparable accuracy in the results. This was achieved because the resolution of HARMONIE input meteorology was comparable in terms of the spatial resolution of the simulation domain objective and could be used directly at the target grid. The reduction in the number of nested domains led to a substantial reduction in the computational resources required for the simulation, enabling us to tackle larger and more complex problems with the same resources. Overall, the results of our study highlight the significant benefits of using a nested domain simulation with fewer levels of nesting and demonstrate its potential as a powerful tool for numerical simulations.
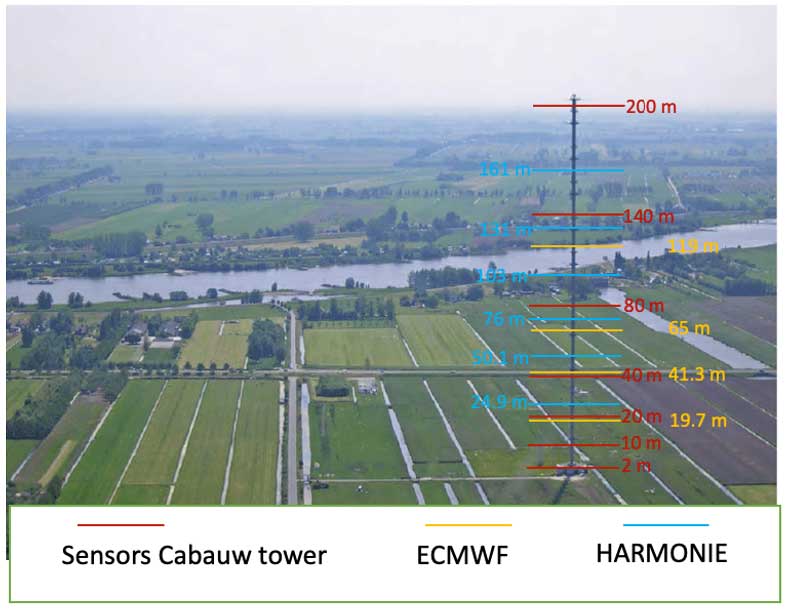
Figure 2Image of the Cabauw tower (lat 51.96°, long 4.89°) with the locations of the meteorological sensors in red and the interfaces between the ECMWF and HARMONIE model layers in yellow and blue, respectively. Aerial photo image modified from (Apituley et al., 2008).
2.3 Observations
During April 2019, we observed two distinct weather patterns that changed the atmospheric conditions within the month and could be attributed to variations in wind speed and direction. Evidence for the change in meteorological conditions is provided by the directionality of plumes captured by satellite instruments, as illustrated in the subsequent Figs. A1 and A2 in Appendix A. We compared the model simulations with ground-based observations derived from the air quality network during these periods in April 2019.
2.3.1 Cabauw meteorology observations
Meteorological observations from the Cabauw site have been used to validate the meteorological datasets used in this study. The 213 m tall KNMI mast in Cabauw (Fig. 2) generates continuous and stable meteorological observations at a location with homogeneous characteristics in a central part of The Netherlands. This site is located on flat terrain with an elevation of 0 m above sea level and has been used to validate models, satellite instruments, and other meteorological sensors (Bosveld et al., 2020). The surrounding area is mainly used for agriculture purposes. Although the Cabauw tower is located in a rural area, small towns and villages are nearby. For this study observations were downloaded from KNMI for the period April–August 2019. The data comes in 10 min sampling intervals and contains air temperature, dew point temperature, specific humidity, wind speed, and wind direction.
2.3.2 Surface concentration pollutant information
Surface observations NO2 have been used to validate the LOTOS-EUROS simulations. The NO2 data were downloaded for the ground stations at different places in the Netherlands from http://www.luchtmeetnet.nl (last access: 1 July 2023). Different locations in the country were chosen to compare the two NO2 LOTOS-EUROS systems with the different meteorological datasets in a representative way. This data is provided by Rijksinstituut voor Volksgezondheid en Milieu (RIVM). The RIVM is accredited for air quality measurements of SO2, NO, NO2, O3, PM2.5, and PM10 by the Dutch Raad voor Accreditatie (RvA) according to NEN-EN-ISO/IEC 17025:2018.
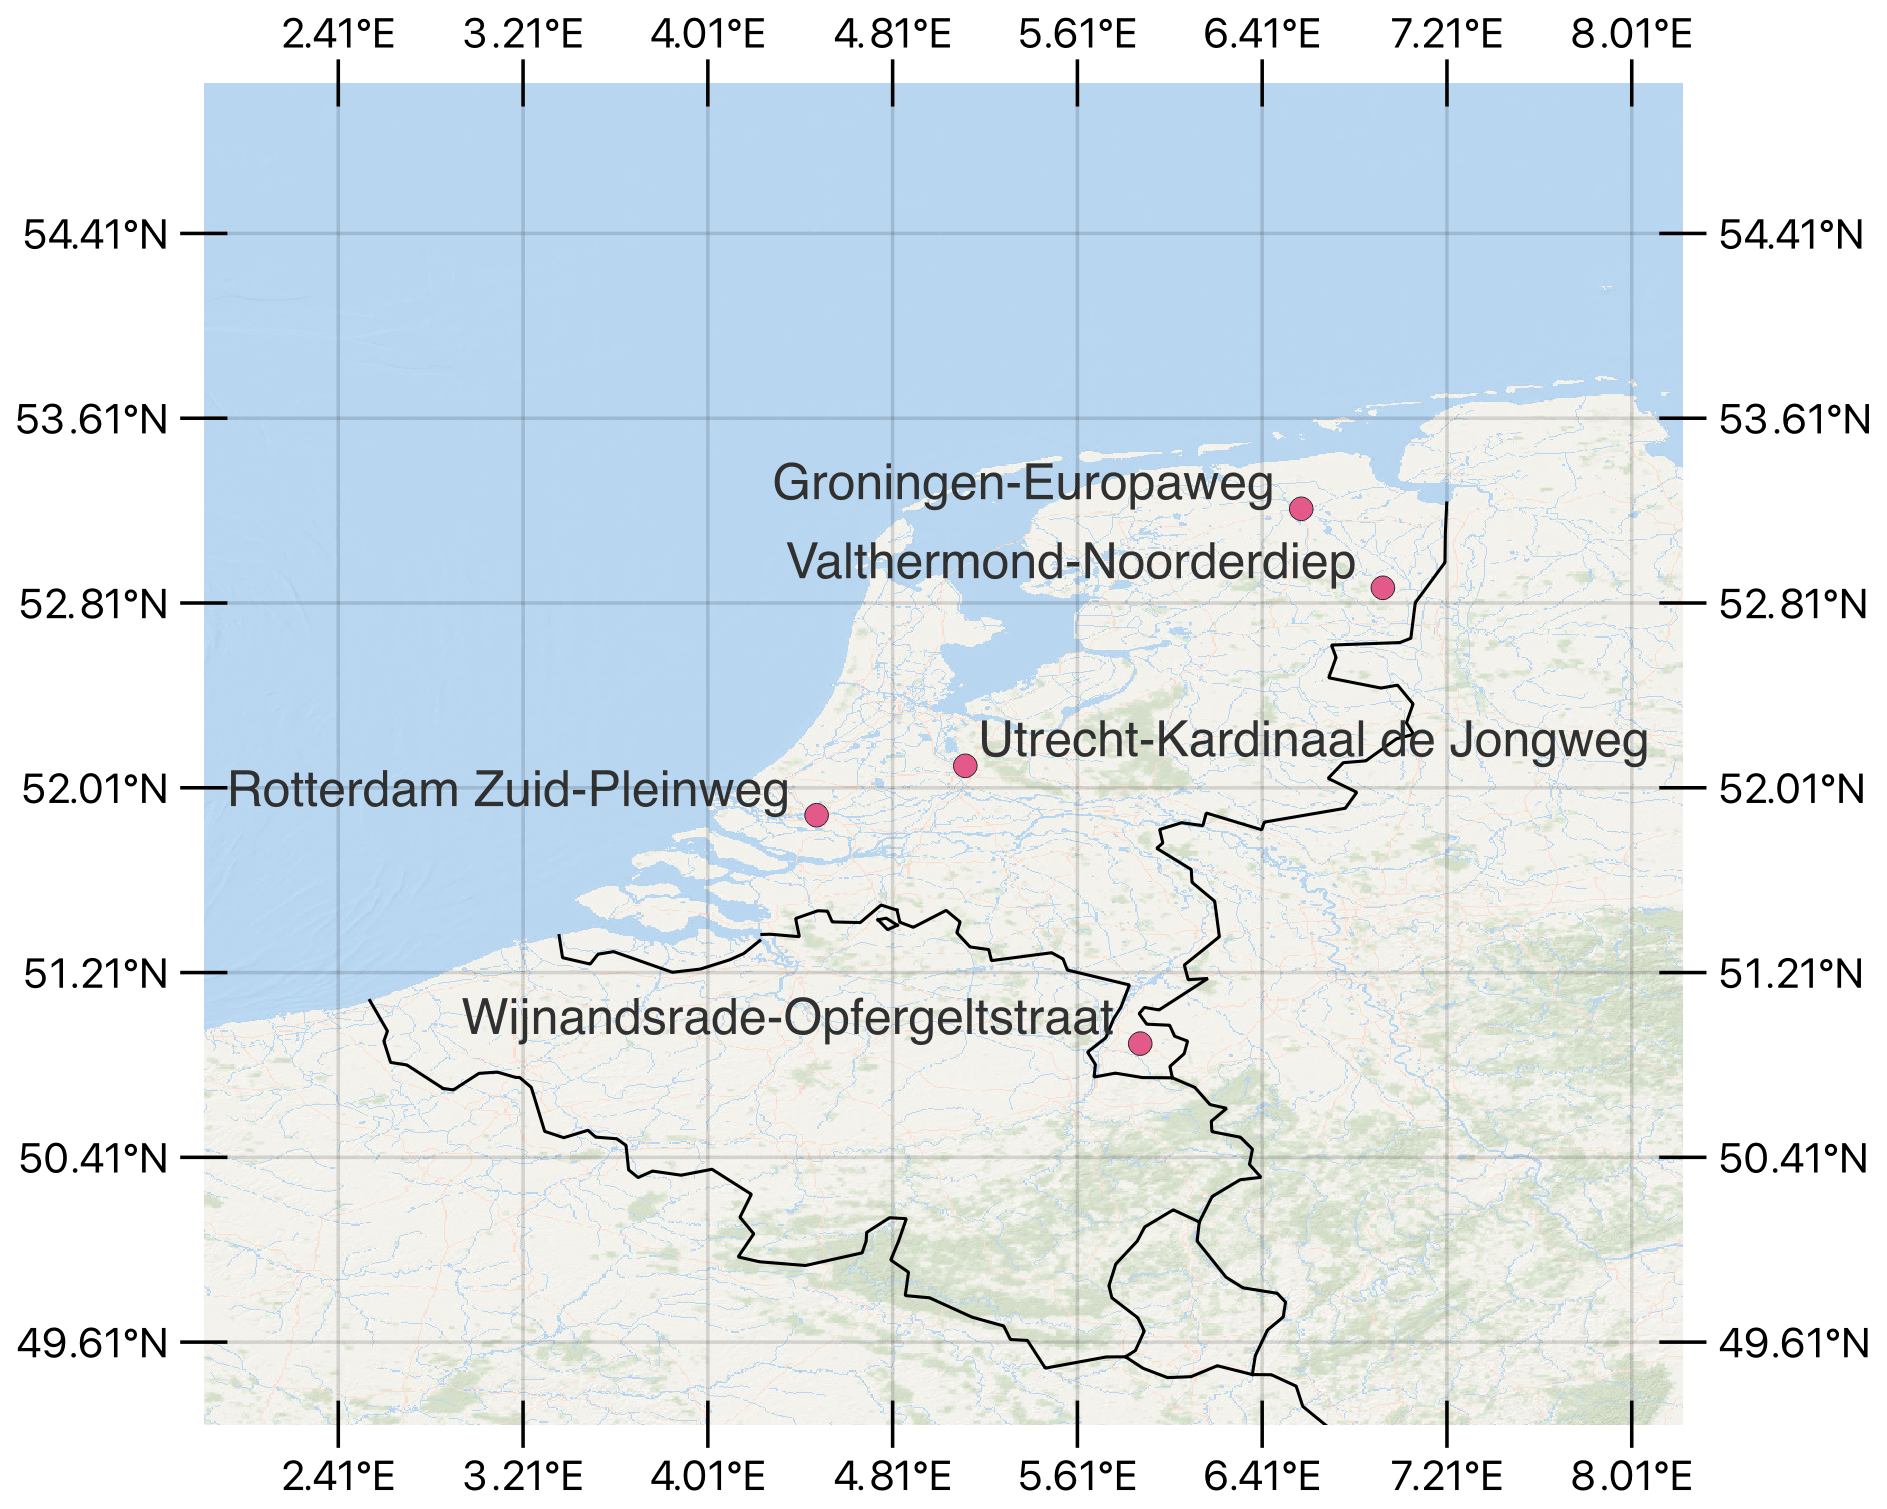
Figure 3Map of the Netherlands with the air quality locations of the selected points used to compare the simulations. The base map is from the Natural Earth collection (https://www.naturalearthdata.com/ (last access: 15 June 2023).
2.3.3 TROPOMI
The TROPOspheric Monitoring Instrument (TROPOMI) is the satellite instrument on board the Copernicus Sentinel-5 Precursor (S5p) satellite. S5P is a low Earth polar orbit satellite. The polar orbit and wide coverage of the scanner provide almost daily global coverage, with a spatial pixel resolution of 5.5 km × 3.5 km. The TROPOMI instrument is a spectrometer sensing ultraviolet (UV), visible (VIS), near-infrared (NIR), and short-wavelength-infrared (SWIR) wavelengths to monitor ozone (O3), methane (CH4), formaldehyde (CH2), aerosol, carbon monoxide (CO), nitrogen dioxide (NO2), and sulfur dioxide (SO2). The NO2 retrievals used in this study are retrieved from a wavelength range of 405–465 nm (spectral band 4). The Royal Netherlands Meteorological Institute (KNMI) created the TROPOMI NO2 retrieval method based on the DOMINO NO2 retrieval algorithm employed on the Ozone Monitoring Instrument (OMI) precursor instrument (Boersma et al., 2011). In this work, the NO2 retrievals from TROPOMI were used to select a simulation period with well-defined characteristics of the tropospheric NO2 concentrations and to see if the different model simulations are able to represent this.
3.1 Meteorology fields evaluation
Figure 2 provides an illustration of the Cabauw tower, with the positions of the sensors and the interfaces between ECMWF and HARMONIE model layers to illustrate the height of the varying model levels for comparison. This information is essential for validating the models' height levels and identifying potential sources of discrepancies between the model outputs and the observations in the vertical domain.
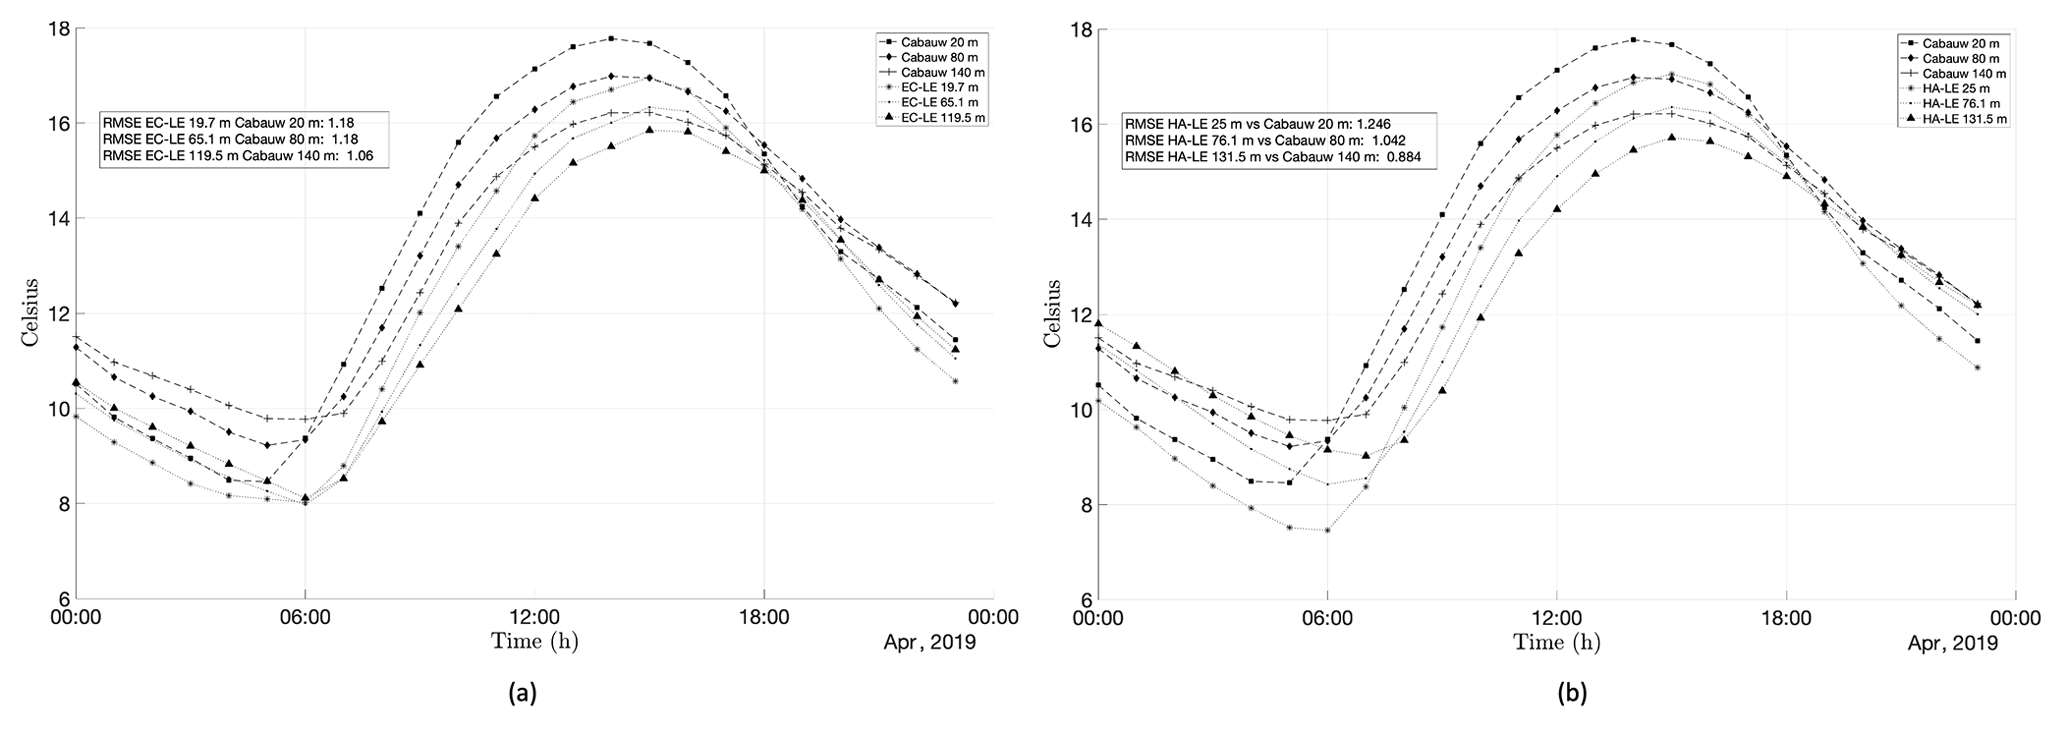
Figure 4The daily temperature cycle from ECMWF (a) and HARMONIE (b) meteorological data and the Cabauw observations at different LOTOS-EUROS simulation levels. The RMSE for different levels is shown for the two input meteorological datasets in comparison to the temperature from the sensors in the tower.
A comparison between the observed and simulated temperatures at different levels is shown in Fig. 4. Figure 4a displays the time series of temperature from the ECMWF meteorology compared with observations at Cabauw at different levels. The comparison shows that there are some differences between the two datasets at certain levels, particularly during nighttime. The daily cycle is in phase, but there are minor differences in magnitude.
Figure 4 shows the daily cycle for three levels of the two meteorology input datasets as provided to LOTOS-EUROS compared to observations at the Cabauw tower. The values show minor differences, which allows for technical trust in the model configurations. For the height of 140 m from the Cabauw tower, the HARMONIE meteorology shows a slightly lower RMSE, showing a slightly better agreement with the observations.
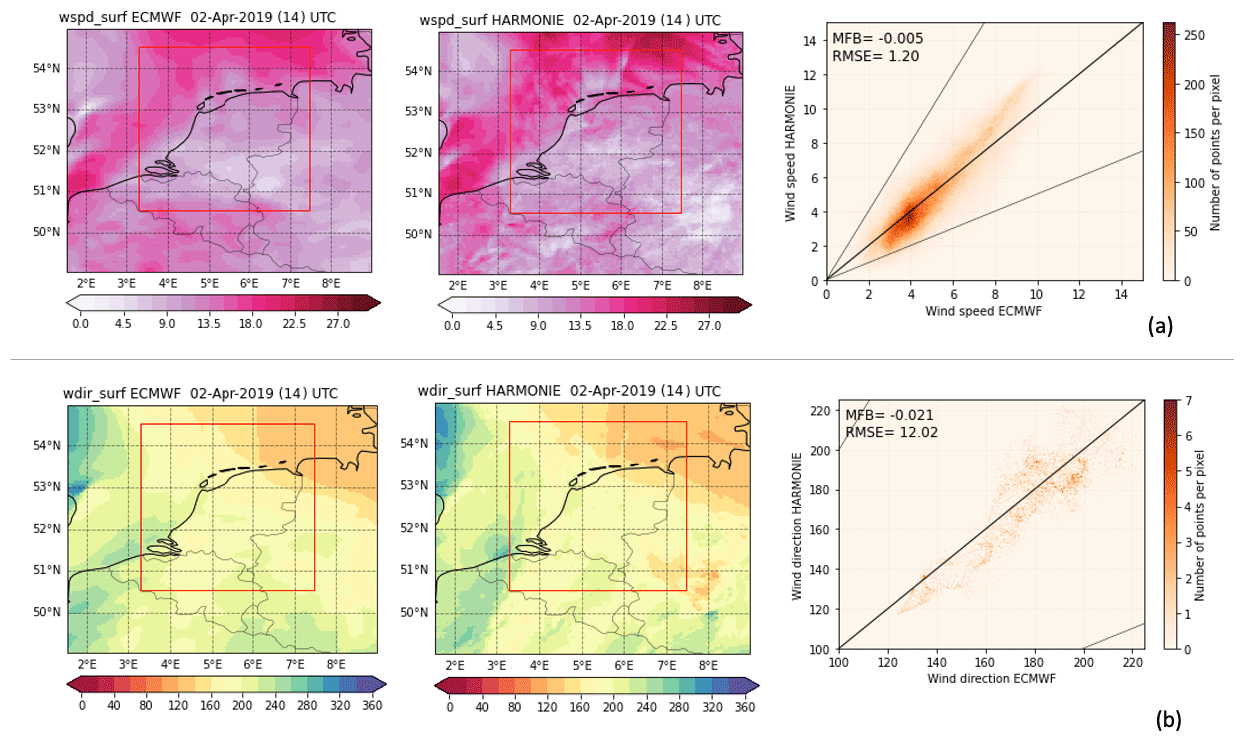
Figure 5Instantaneous simulated value of surface wind speed [m s−1] (wspd_surf) and direction [°] (wdir_surf) from ECMWF or HARMONIE meteorological fields interpolated to the LOTOS-EUROS grid. The scatter density plots on the right compare the values enclosed by the red square. The base maps are from http://www.gadm.org/ (last access: 15 June 2023).
Figure 5 shows a comparison of the wind speed and wind direction at the resolution of LOTOS-EUROS for the two meteorological input datasets. For the chosen time, the fields are very similar, although there are some differences in the details. Although small, such differences may contribute to differences in air quality at specific locations, and variations in wind (direction) could be important when comparing model simulations with air quality observations from measurement sites. An extensive validation of the meteorological variables of the HARMONIE model against Cabauw vertical profile observations can be found in (Knoop et al., 2020).
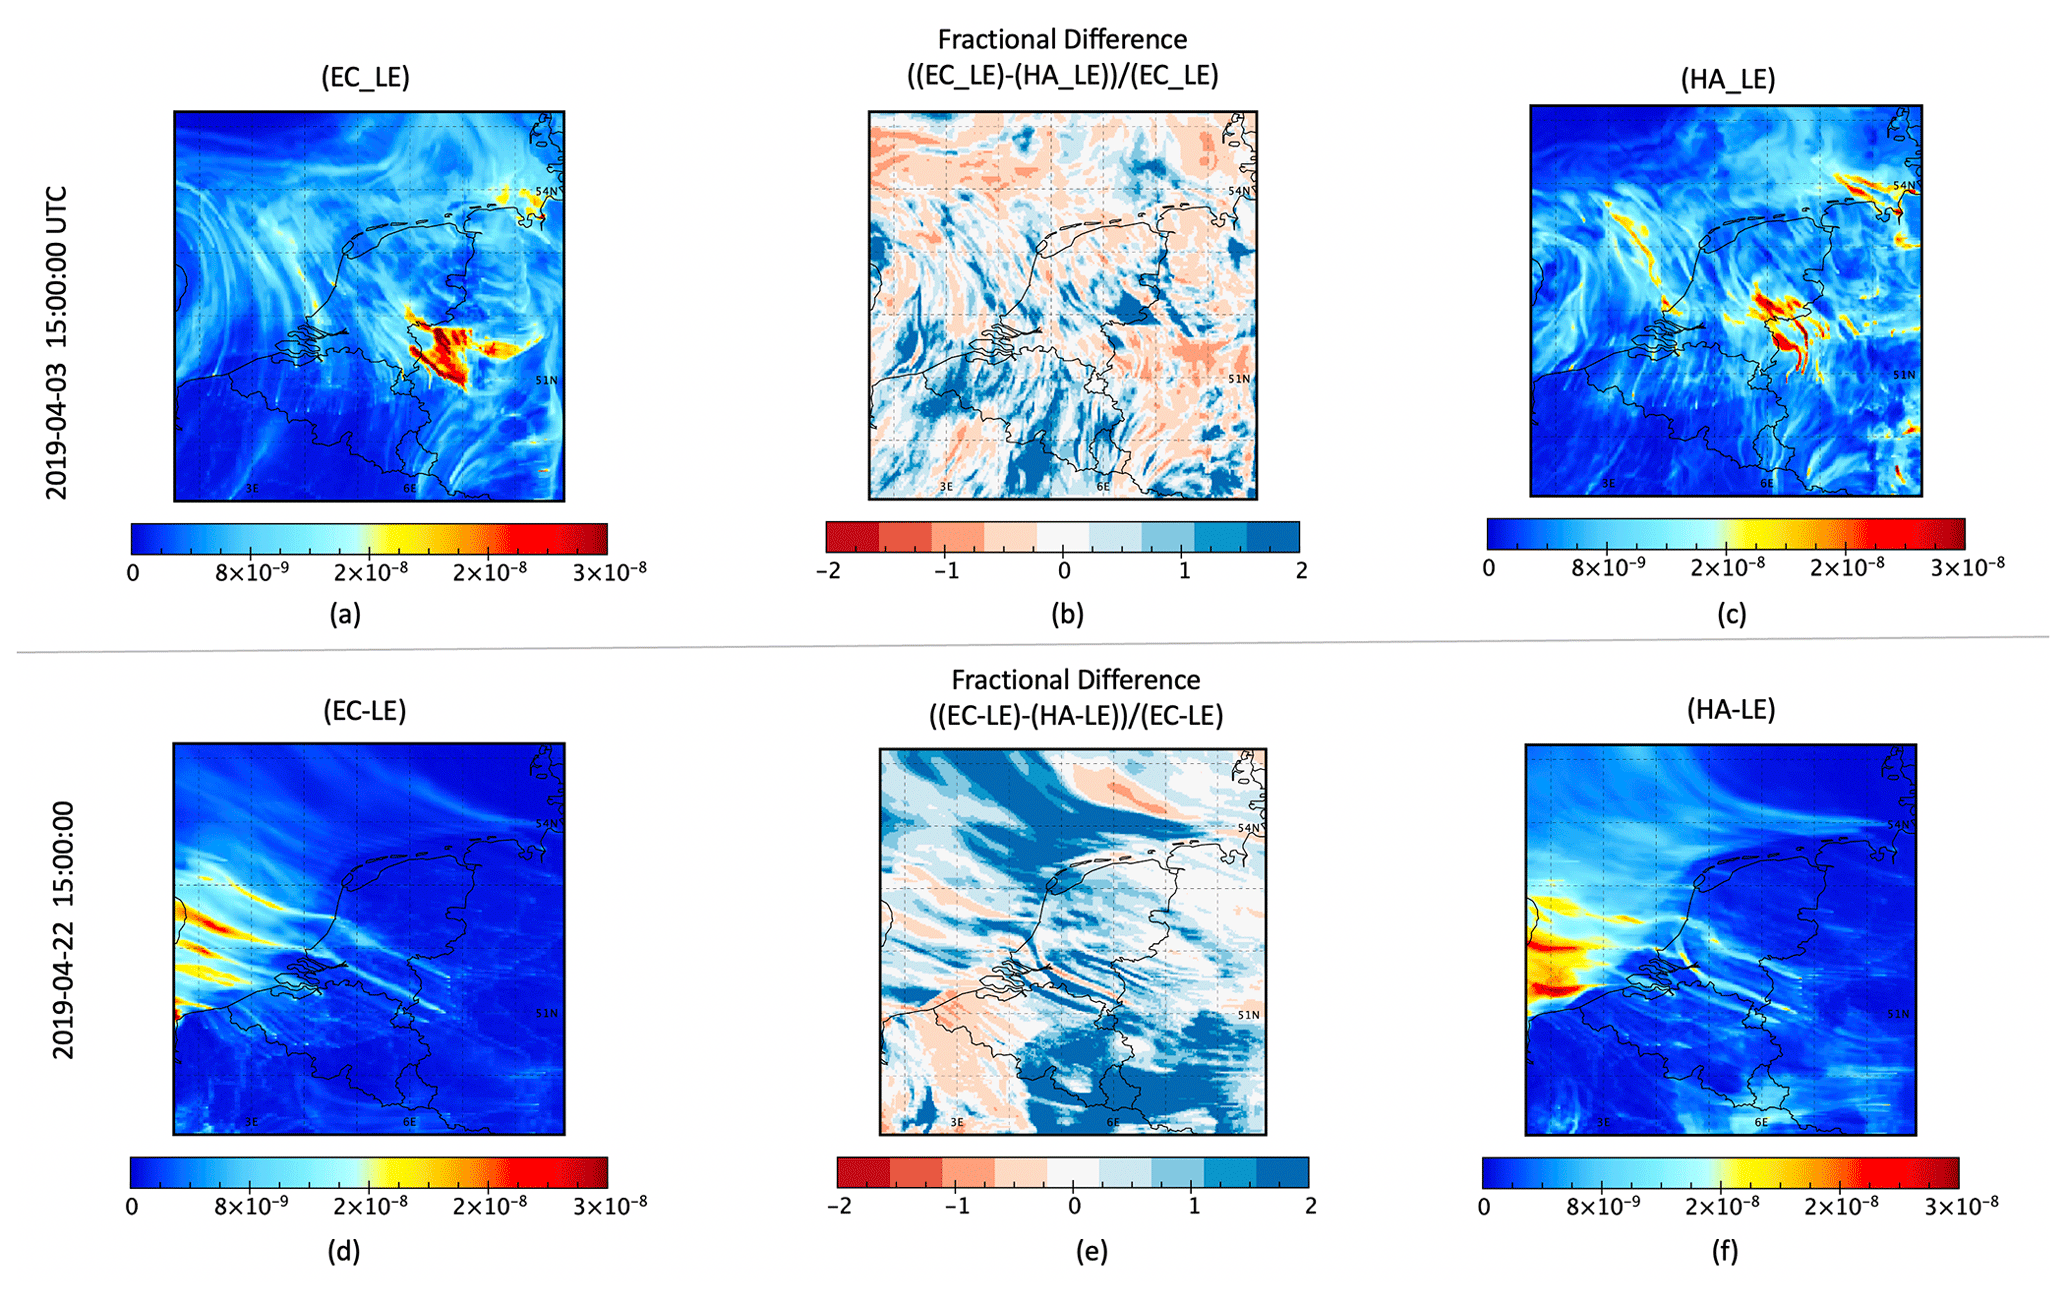
Figure 6Maps of the volume mixing ratio of surface NO2 [mol mol−1] for 3 April 2019 (a–c) and 12 April 2019 (d–f) at 15:00 UTC from EC_LE (a, d) or HA_LE (c, f) configurations. The middle panels (b, e) show the fractional difference. The base maps are from http://www.gadm.org/ (last access: 15 June 2023).
3.2 Comparison of concentration fields
Figure 6 compares the simulated surface concentrations of NO2 for the EC_LE (Fig. 6a and d) and HA_LE (Fig. 6c and f) model configurations at two different moments: 3 April, a day without a dominant wind direction (upper panels), and 12 April, a day with a clear westward-directed wind field. To gain further insight into the differences between the two configurations, the fractional difference ((EC_LE)-(HA_LE))/(EC_LE) is shown in Fig. 6b and e. These fractional differences clearly show that the (HA_LE) model configuration produces similar but different NO2 concentrations compared to the (EC_LE) configuration at the chosen time. This reveals a difference in wind direction in the meteorological drivers, that could impact the simulated time series at any location. This suggests that wind direction can play a crucial role in the transport and diffusion of NO2 in the atmosphere and could affect the simulated concentrations.
The experiment demonstrates that air mass characterization, e.g. informed by NO2 concentration plume structures, may reveal significant discrepancies between HA_LE and EC_LE simulations. Evidence is provided by the statistical metrics, quantifying areas of over- and under-estimation. Clearly, small-scale wind direction changes have an impact on NO2 pollutant transport and contribute to variations in pollutant concentrations across different regions. Accurate meteorological inputs are invaluable for LOTOS-EUROS simulations, particularly for the understanding of time series of NO2 at the stations of the ground network in the Netherlands.
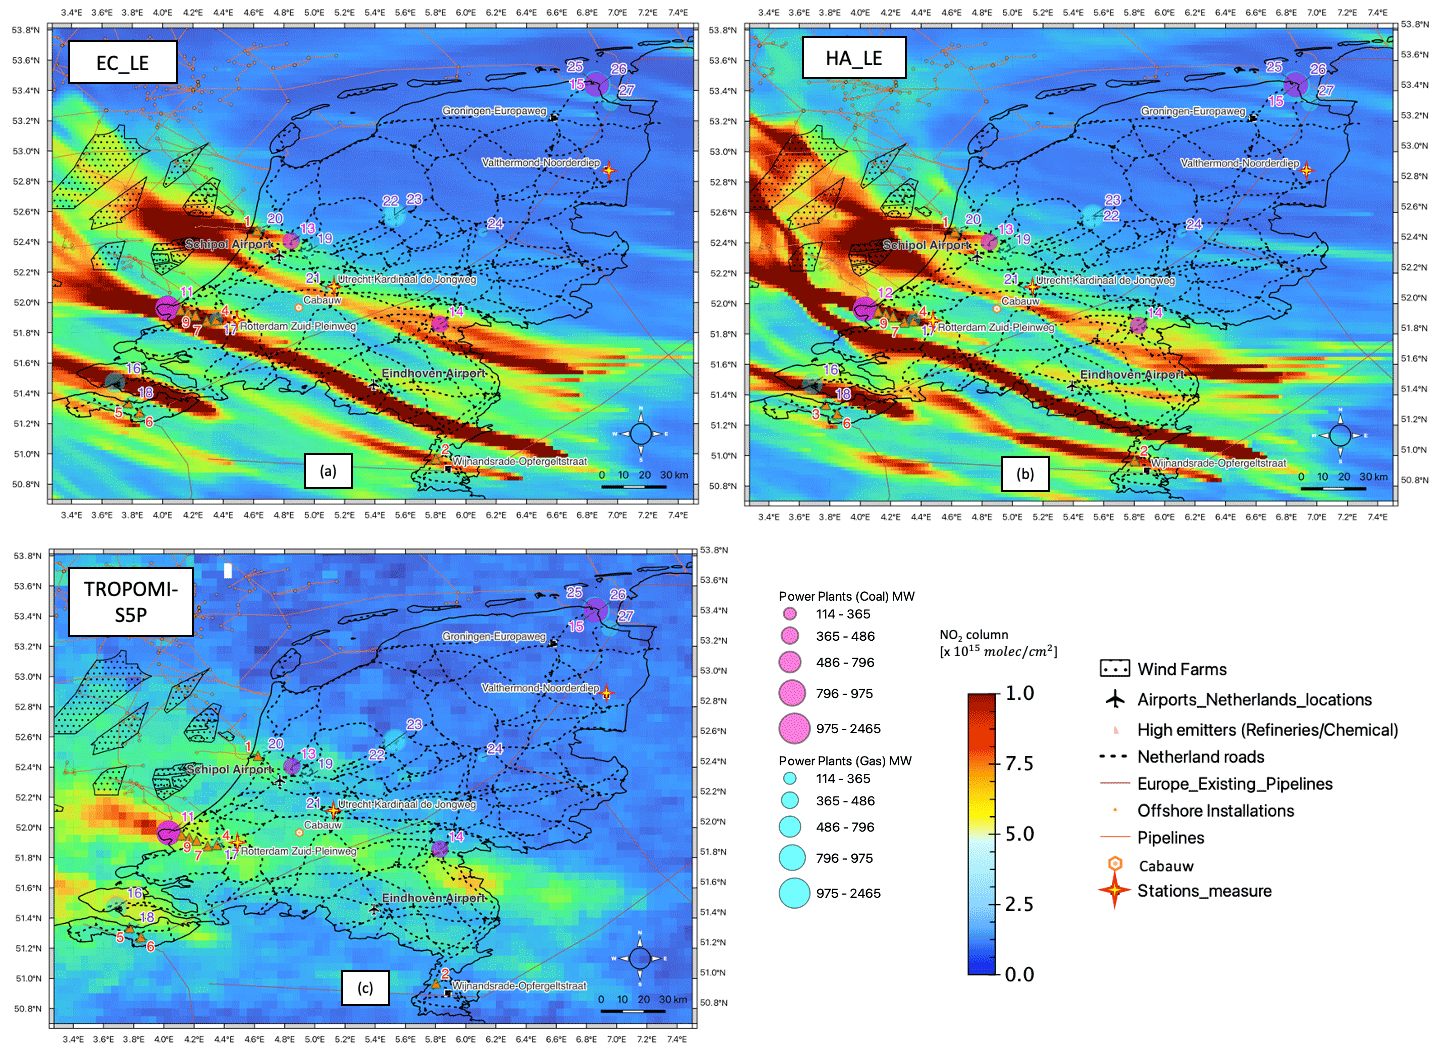
Figure 7Comparison between the tropospheric columns of NO2 from (EC_LE) (a) and (HA_LE) (b) for the overpass time of TROPOMI at 14:00 LT for which the retrieved tropospheric columns are shown in (c) for 22 April 2019. Large sources of NOx, such as power plants, principal airports, and main roads, are marked. The ground observation stations depicted with a star are the stations shown in Fig. 8. The base maps are from http://www.gadm.org/ (last access: 15 June 2023), and the information about human activity is from https://emodnet.ec.europa.eu/en/human-activities (last access: 10 June 2023).
Examples of the tropospheric column of NO2 for the (EC_LE) and (HA_LE) configurations and the tropospheric column retrieved from the TROPOMI satellite instrument are shown in Fig. 7 for a single snapshot for 22 April 2019. Figure 7a shows the tropospheric column of NO2 for the (EC_LE) configuration, while Fig. 7b shows the tropospheric column of NO2 for the (HA_LE) configuration. Figure 7c shows the tropospheric column of NO2 obtained from the TROPOMI satellite retrieval.
Table 4Names and labels as displayed in Fig. 7 for the largest emitters in the Netherlands, organized into three categories as follows: factories and refineries, power plants using coal, power plants using gas.
The comparison reveals that the (HA_LE) configuration produces a tropospheric column of NO2 that is slightly more similar to the TROPOMI satellite retrieval, particularly in regions with high NO2 concentrations. The difference with the EC_LE simulation is due to a slight difference in wind direction in the HARMONIE configuration, which affects the transport and diffusion of NO2 emissions in the atmosphere. In addition to revealing differences in NO2 concentrations between the two model configurations and the satellite retrieval, the images in Fig. 7 show different details over the maps. Specifically, the maps illustrate the locations of coal and gas power stations, oil rigs and pipelines, principal airports, and roads across the Netherlands. These details are important to consider in atmospheric chemistry modelling, as they can help to identify potential sources of NO2 emissions and inform policy decisions related to air quality management.
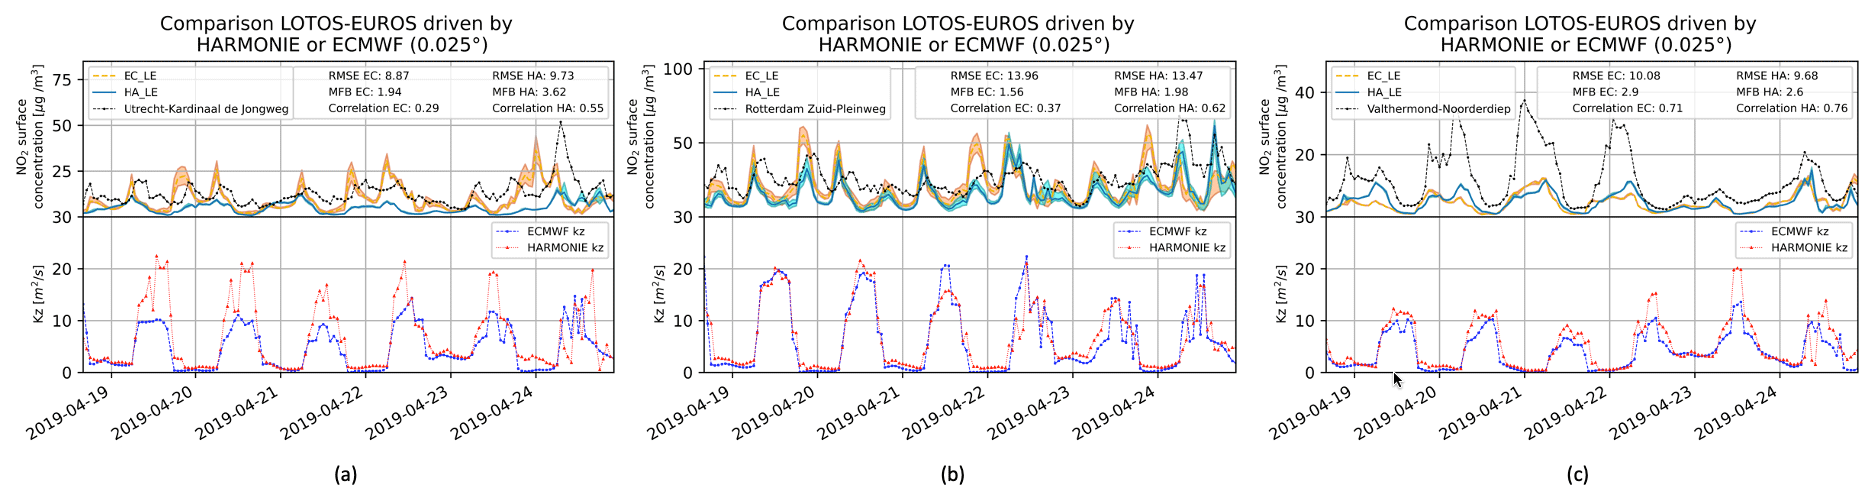
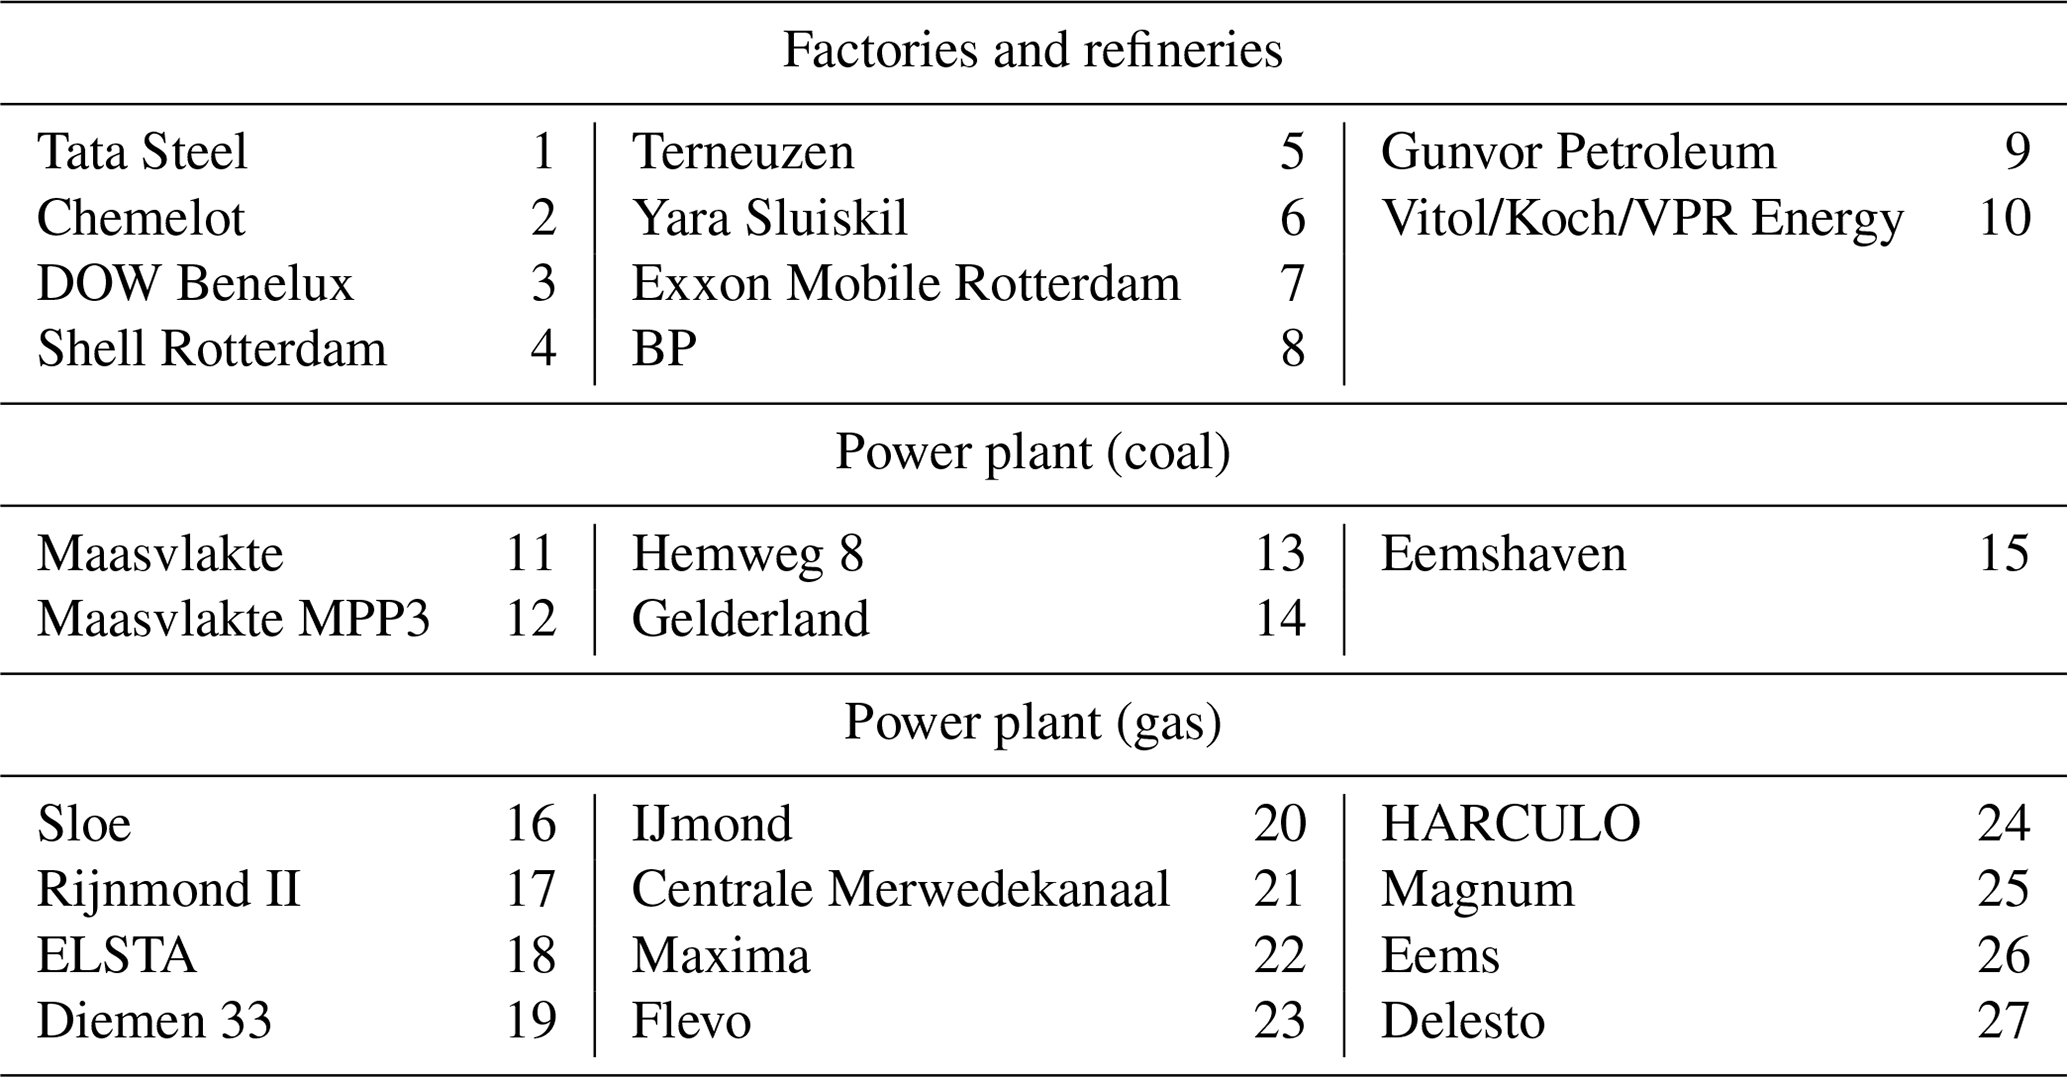
Figure 8Comparison between NO2 observations and simulations at three air quality stations from the national network: (a) Utrecht Kardinaal de Jongweg, (b) Rotterdam Zuid-Pleinweg, and (c) Valthermond Noorderdiep. The shaded area represents the standard deviation between the grid cell where the station is located and the surrounding cells. The lower graphs show the simulations of the vertical diffusion coefficient Kz between the surface and second LOTOS-EUROS model layer.
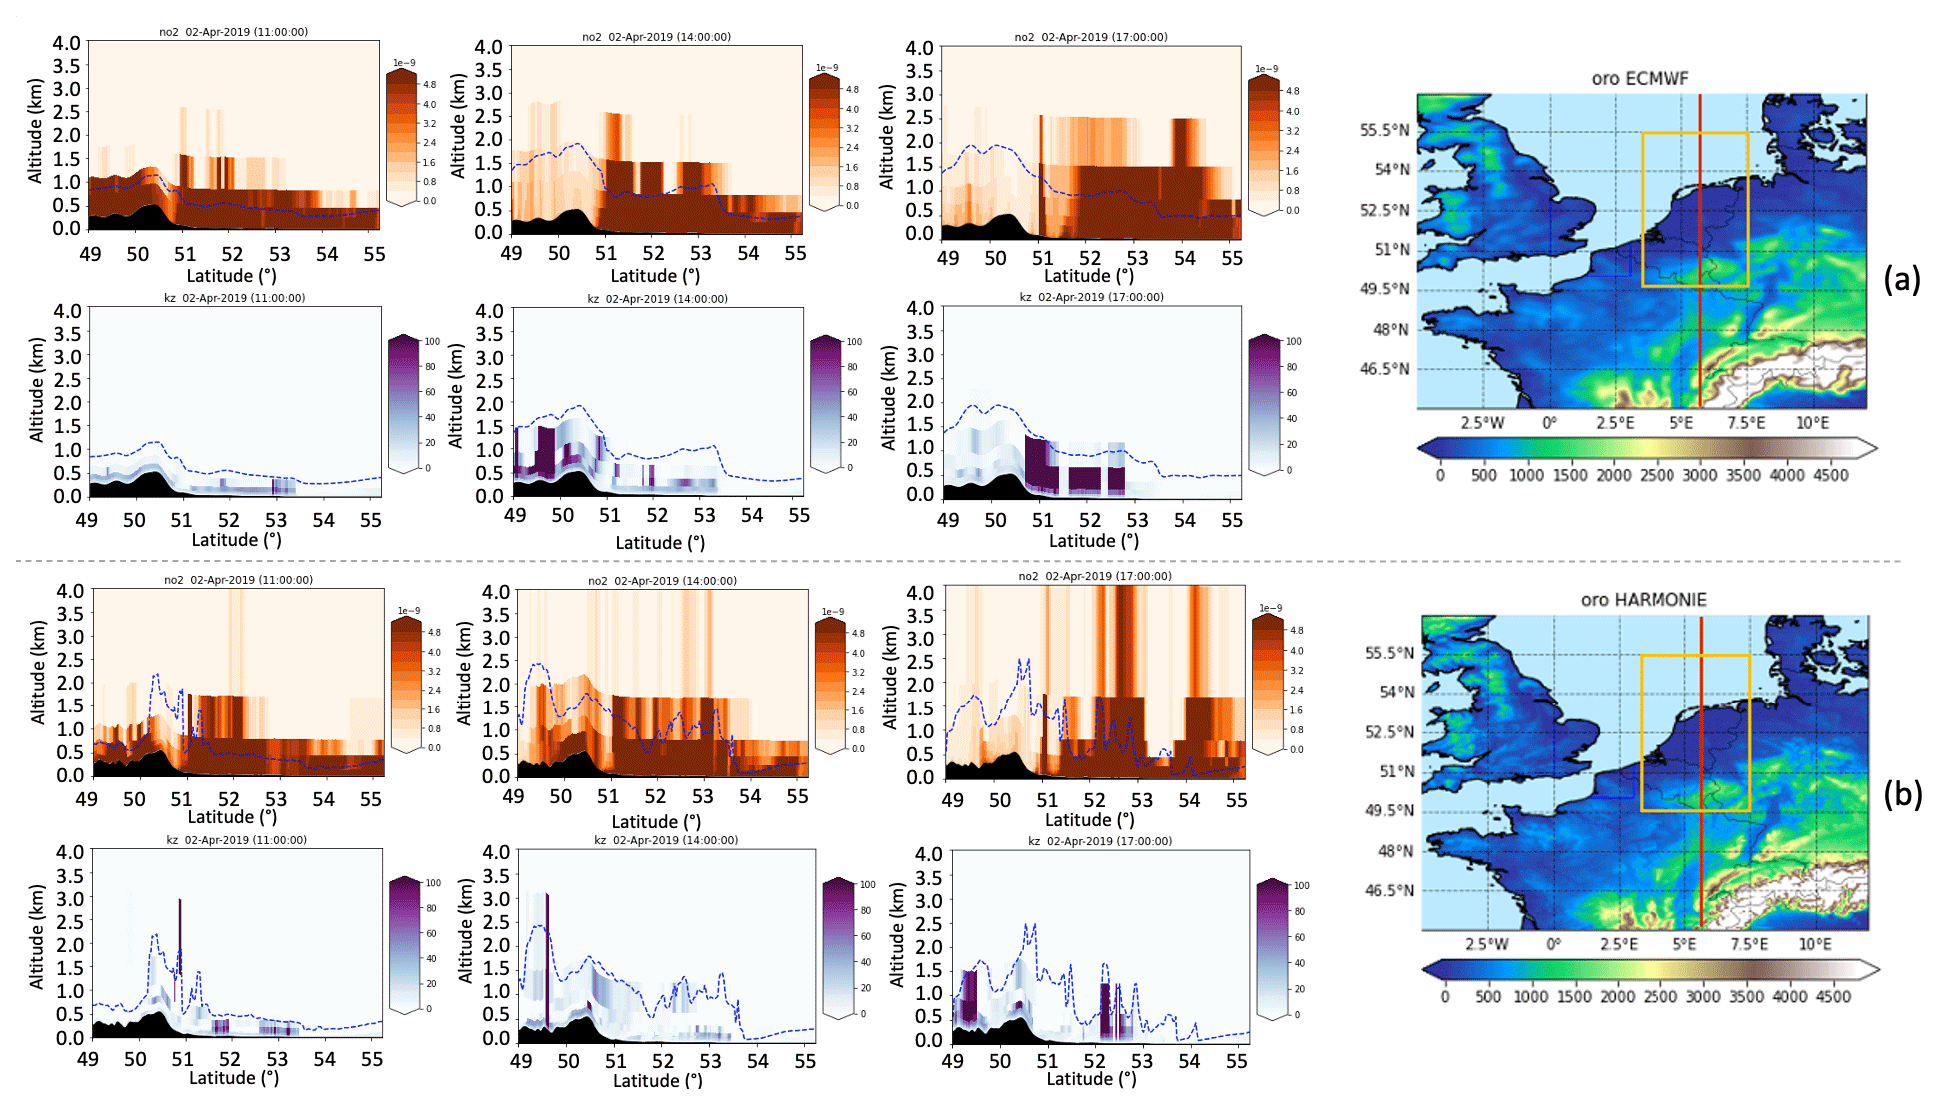
Figure 9(a) Transversal cuts on longitude (6.2° E) over the Netherlands comparison between the (EC_LE) configuration and (b) the (HA_LE) NO2 concentration fields. The dashed blue lines correspond to the planetary boundary layer in the models. The panels on the right (a, b) show each of the transversal cuts. The base maps are from http://www.gadm.org/ (last access: 15 June 2023).
Figure 8 shows a comparison between the NO2 simulations and observations at three stations within the national air quality network. The locations compared are marked in Fig. 7 with a red star: Station Utrecht Kardinaal de Jongweg (Fig. 7a) is located in a central part of the country, Rotterdam Zuid-Pleinweg (Fig. 7b) is located in the city of Rotterdam and is characterized by high levels of pollutants due to the nearby presence of the harbour and refineries activities, and Valthermond Noorderlep (Fig. 7c) is located in a more rural area. The standard deviation between the grid cell where each station is located and its neighbouring cells is added to the simulation time series to have a notion of the representative error of these site comparisons. Three statistics (root mean square error – RMSE, mean fractional bias – MFB, correlation) are presented for each configuration in each location. The highest correlations with the observations over the full time period are obtained using the HARMONIE high-resolution meteorology. The lower panel of this figure shows the vertical diffusion coefficient Kz between the surface and the second LOTOS-EUROS model layer, which offers additional insights into the analysis of surface air quality observations. Kz values are high over the Rotterdam Zuid-Pleinweg station; for the other two stations, Utrecht Kardinaal de Jongweg and Valthermond Noorderlep, lower Kz values are found but with relatively high values in the HARMONIE model configuration that suggest a locally higher vertical mixing in this model configuration.
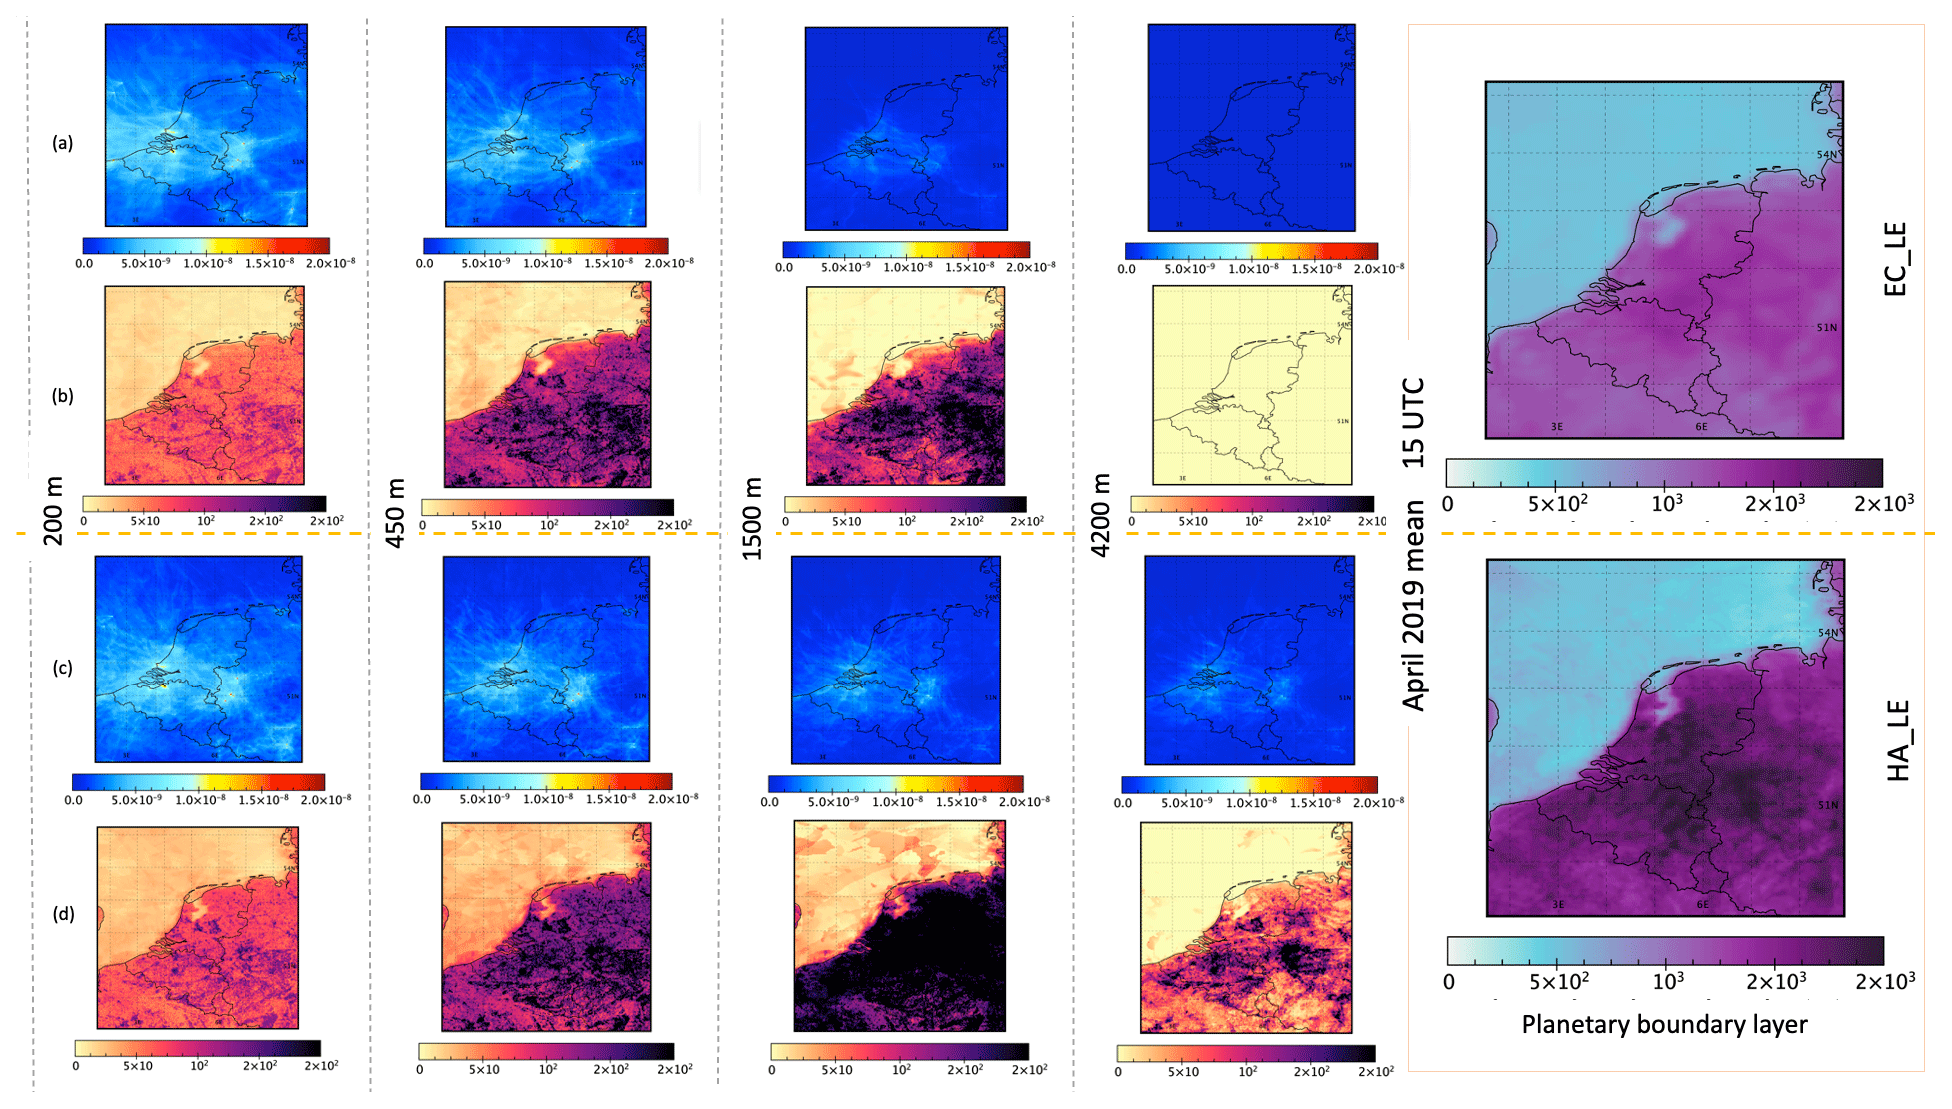
Figure 10April mean (15:00 UTC) NO2 concentration fields [mol mol−1] and Kz [m2 s−1] at 200, 450, 1500, and 4200 m altitude (a, c) for EC_LE and (b, d) for HA_LE. The base maps are from http://www.gadm.org/ (last access: 15 June 2023).
The transversal cut over the Netherlands in Fig. 9 shows a comparison between the (EC_LE) configuration in the upper panel and the (HA_LE) NO2 fields in the panel below. The figure indicates notable differences in the NO2 concentration fields produced by the two model configurations in both the NO2 columns and the value of the Kz diffusion coefficient at the layer interfaces. The planetary boundary layer height is shown in all pictures with a shaded blue line. Here, the HARMONIE provides a more complex structure that impacts the modelled vertical mixing. In Fig. 9a, the (EC_LE) configuration shows lower NO2 concentrations compared to Fig. 9b, where the (HA_LE) configuration produces higher NO2 concentrations. Note that the differences with the observations may be attributed to the (different) meteorological drivers as well as to the (identical, but uncertain) emission data in the two model configurations. Both meteorology and emission and chemistry uncertainties can affect the ability of a CTM to simulate observations of atmospheric pollutants.
Overall, our comparison of the two model configurations highlights the importance of an appropriate model configuration when evaluating NO2 concentrations in a given region with a CTM at a given spatial resolution. More research is needed to investigate the specific factors that contribute to the differences between the two model configurations for LOTOS-EUROS and to determine which configuration is more accurate for simulating NO2 concentration in the Netherlands. Figure 10 compares both configurations for a mean of April for four levels of the NO2 concentration and the diffusion coefficient.
The HARMONIE atmospheric model stands out with its enhanced structure and distinct field shape compared to the ECMWF. However, it exhibits a discrepancy when simulating the boundary layer height, overestimating it compared to real-world observations. This disparity significantly affects air pollutant concentrations, particularly at higher levels in the atmosphere. The higher simulated boundary layer height in HARMONIE allows pollutants to be transported to higher altitudes, leading to changes in chemical reactions and the formation of secondary pollutants. The amount of upward mixing affects regional air quality, climate, and the understanding of long-range pollutant transport. Accurately representing the boundary layer height is therefore crucial for reliable air quality forecasts and the assessment of (surface) pollutant impacts. Resolving this issue requires further research and refinement of the model's parameterizations and processes related to boundary layer dynamics, enabling improved simulations of pollutant vertical dispersion into different atmospheric layers.
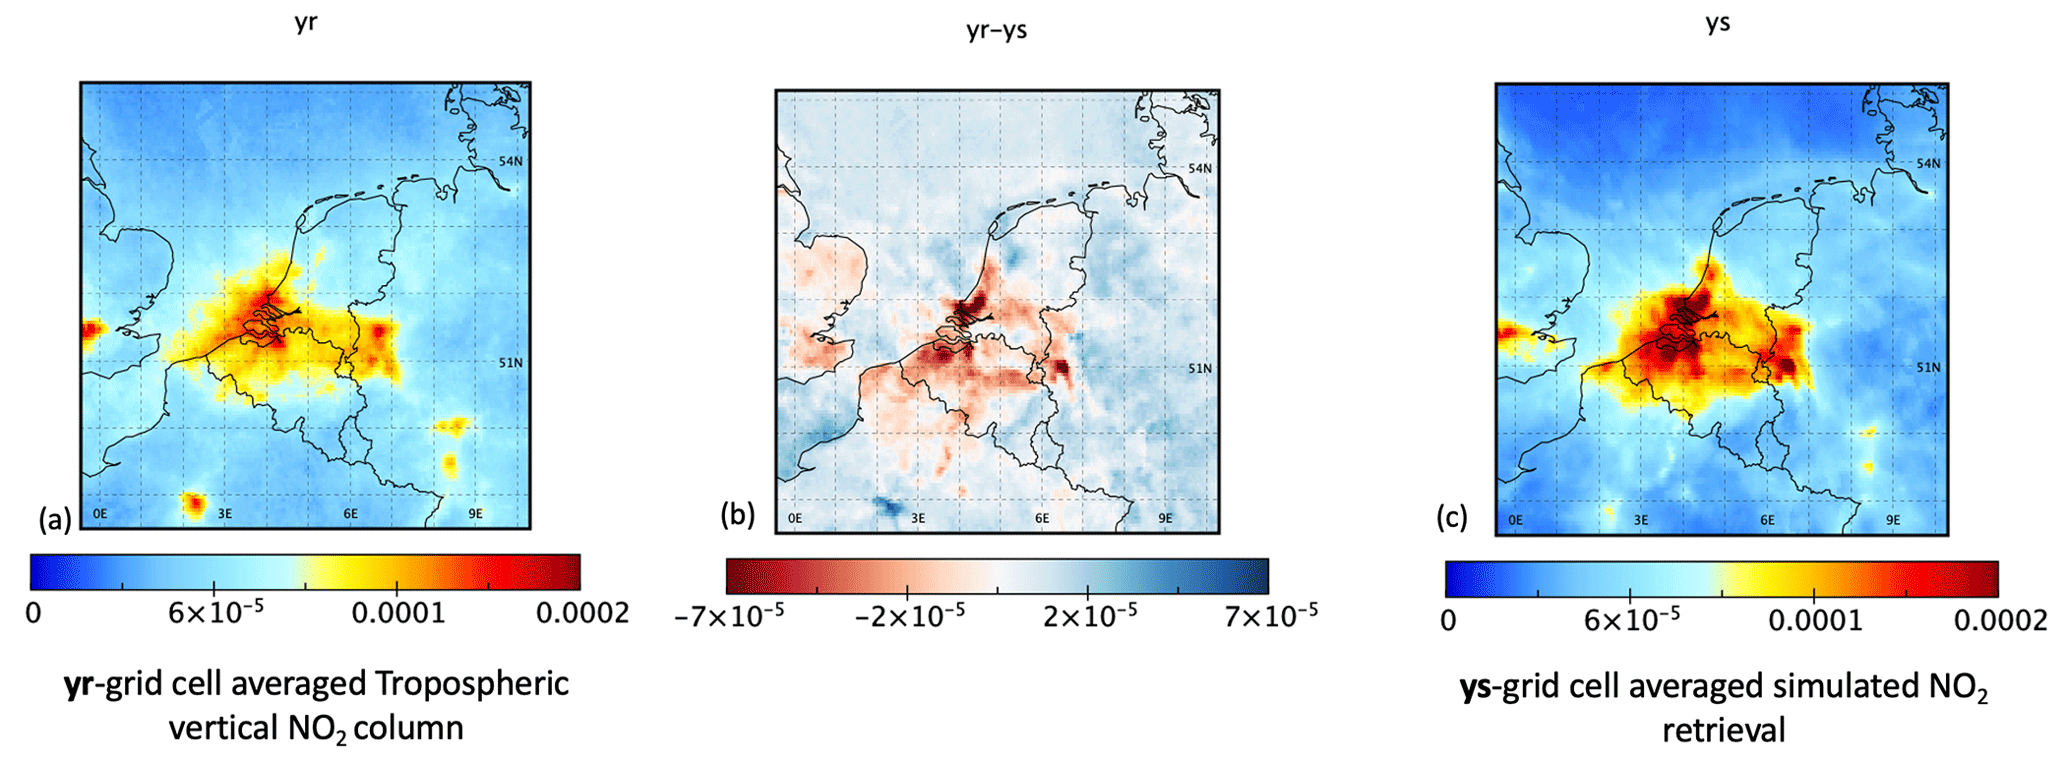
Figure 11Comparison between the LOTOS-EUROS simulated retrieval of the tropospheric column of NO2 ys and the TROPOMI average tropospheric column yr. The base maps are from http://www.gadm.org/ (last access: 15 June 2023).
The comparison between the LOTOS-EUROS simulated retrieval of the tropospheric column of NO2 and the TROPOMI average tropospheric vertical column, which corresponds to the input needed for the data assimilation stage, are shown in Fig. 11. Figure 11a shows the TROPOMI average tropospheric vertical column yr product, Fig. 11c shows the LOTOS-EUROS simulated retrieval of the tropospheric column of NO2 ys, and Fig. 11b shows the difference between the two.
In this study two meteorological models that have different features served as input for the LOTOS-EUROS chemical transport model. The hydrostatic nature of a meteorological model such as ECMWF refers to the assumption that the atmosphere is in a state of hydrostatic equilibrium, meaning that the vertical pressure gradient balances the gravitational force. In this configuration, the atmospheric equations used by the model do not include the effects of non-hydrostatic processes, such as wind, turbulence, and gravity waves. In contrast, a non-hydrostatic meteorological model allows for including non-hydrostatic processes in the atmospheric equations. This can provide a more accurate representation of the mixing dynamics of the atmosphere, especially in regions where these processes are significant, such as near the coast, over forests, and in urban areas.
The choice of a hydrostatic or non-hydrostatic meteorological configuration can significantly impact the performance of a chemical transport model. A hydrostatic configuration may be sufficient in some cases, but a non-hydrostatic configuration may be necessary to better represent the transport of pollutants in the atmosphere accurately. Overall, it is essential to carefully consider the meteorological model's capabilities and the study region's specific characteristics when choosing a hydrostatic or non-hydrostatic configuration for a chemical transport model. This can ensure that the model can accurately represent the transport of pollutants and quantify air quality.
In this study, the vertical velocity fields in LOTOS-EUROS are calculated using the convergence and divergence of the horizontal winds from the meteorological model. This allows the model to simulate the effects of vertical motion in the atmosphere on the transport of pollutants. Uncertainties in the vertical transport and mixing mean that a CTM may not accurately represent the vertical motion of pollutants in the atmosphere. This can lead to significant errors in the model's predictions of the distribution and impact of pollutants on air quality. Other models, such as CHIMERE, recently evaluated a new vertical advection mechanism to improve the vertical transport and a new vertical advection scheme that strongly reduces excess vertical diffusion (Menut et al., 2021).
Using high-spatial resolution meteorology in a CTM like LOTOS EUROS can improve the accuracy and reliability of the model simulations. High-resolution meteorological data provides more detailed information about the atmosphere's wind, temperature, pressure, and humidity conditions, which can be used to simulate the movement of pollutants and trace gases more accurately. In particular, high-resolution meteorology can provide more accurate representations of the effects of small-scale atmospheric processes, such as turbulence and convection. This can improve the model's ability to simulate the distribution and impact of pollutants on air quality and can provide more detailed and helpful information for air quality forecasting.
The input meteorological information is part of the CTM model error and should be included in the uncertainty description when assimilating observations. The following step is the preparation for the assimilation experiments using satellite column measurements. Figure 11 shows the two products needed to perform the assimilation, the difference between the two provide the input to correct in any of the data assimilation techniques. It is important to carefully consider the model configuration and meteorological factors such as vertical mixing in a CTM for the potential benefits of satellite remote sensing data in improving the accuracy of the modelled NO2 concentrations. There might be significant differences between the simulated and observed products, in particular in regions with high NO2 concentrations. Underlying model uncertainties, for example due to vertical mixing, are important to consider in the data assimilation stage, as they can impact the accuracy of the assimilated data and ultimately the accuracy of the analysis of modelled NO2 concentrations.
This study explores the coupling of meteorological data from the HARMONIE (cy43) model with the LOTOS-EUROS chemical transport model (CTM) to simulate NO2 concentrations, comparing these results with simulations that utilize ECMWF meteorological data. The research seeks to evaluate the performance and accuracy of these different meteorological couplings in predicting NO2 levels. A general comparison between the two setups reveals that both meteorological variables and NO2 simulations are comparable, indicating a level of technical consistency between the HARMONIE and ECMWF configurations.
Despite the overall comparability, notable differences emerge in the vertical column concentrations of NO2. Specifically, the HARMONIE configuration exhibits higher values in the upper layer of the atmosphere compared to the ECMWF setup. This difference is at least partly attributed to the vertical diffusion coefficients and planetary boundary layer height, highlighting the sensitivity of NO2 dispersion to model-specific meteorological parameters. Our analysis reveals that HARMONIE provides a more detailed structure for meteorological drivers than the coarser ECMWF fields. This granularity is particularly evident in the simulation of the boundary layer height, which, along with the diffusion coefficient discrepancies, significantly impacts air pollutant concentrations near the surface and their transport to the higher layers of the atmosphere.
The study underscores the importance of accurately representing the boundary layer height, as it plays a crucial role in the distribution and chemical transformation of pollutants. The higher boundary layer height simulated by HARMONIE facilitates the transport of pollutants to higher altitudes, where they can undergo chemical reactions leading to the formation of secondary pollutants. This phenomenon has implications for regional air quality, climate, and the understanding of long-range pollutant transport. Addressing the discrepancies in boundary layer height simulation requires further research, focusing on refining the model's parameterizations and processes related to boundary layer dynamics to enhance the simulation of pollutant dispersion across different atmospheric layers.
The analysis also points to a slight improvement in surface NO2 concentrations when compared with observations from ground stations in the HARMONIE configuration, though it emphasizes that these findings do not significantly enhance our understanding of surface NO2 levels. In terms of the statistics, a slight improvement for the performance in the surface NO2 concentrations compared with ground stations was observed with the high-spatial-resolution meteorology. The study calls for further examination of vertical transport processes and additional validation efforts, particularly with NO2 profile measurements from MAX-DOAS. Highlighting the computational advantages and the need for high spatial resolution in the HARMONIE configuration, the research suggests further development of LOTOS-EUROS to leverage these benefits fully.
Looking ahead, the study proposes using both the ECMWF and HARMONIE configurations in a data assimilation experiment with TROPOMI NO2 data. This approach aims to better understand the impact of uncertainties in the meteorology on the horizontal and vertical transport of contaminants, marking an essential step towards refining air quality models and improving our ability to predict and mitigate the effects of air pollution on the environment and public health.
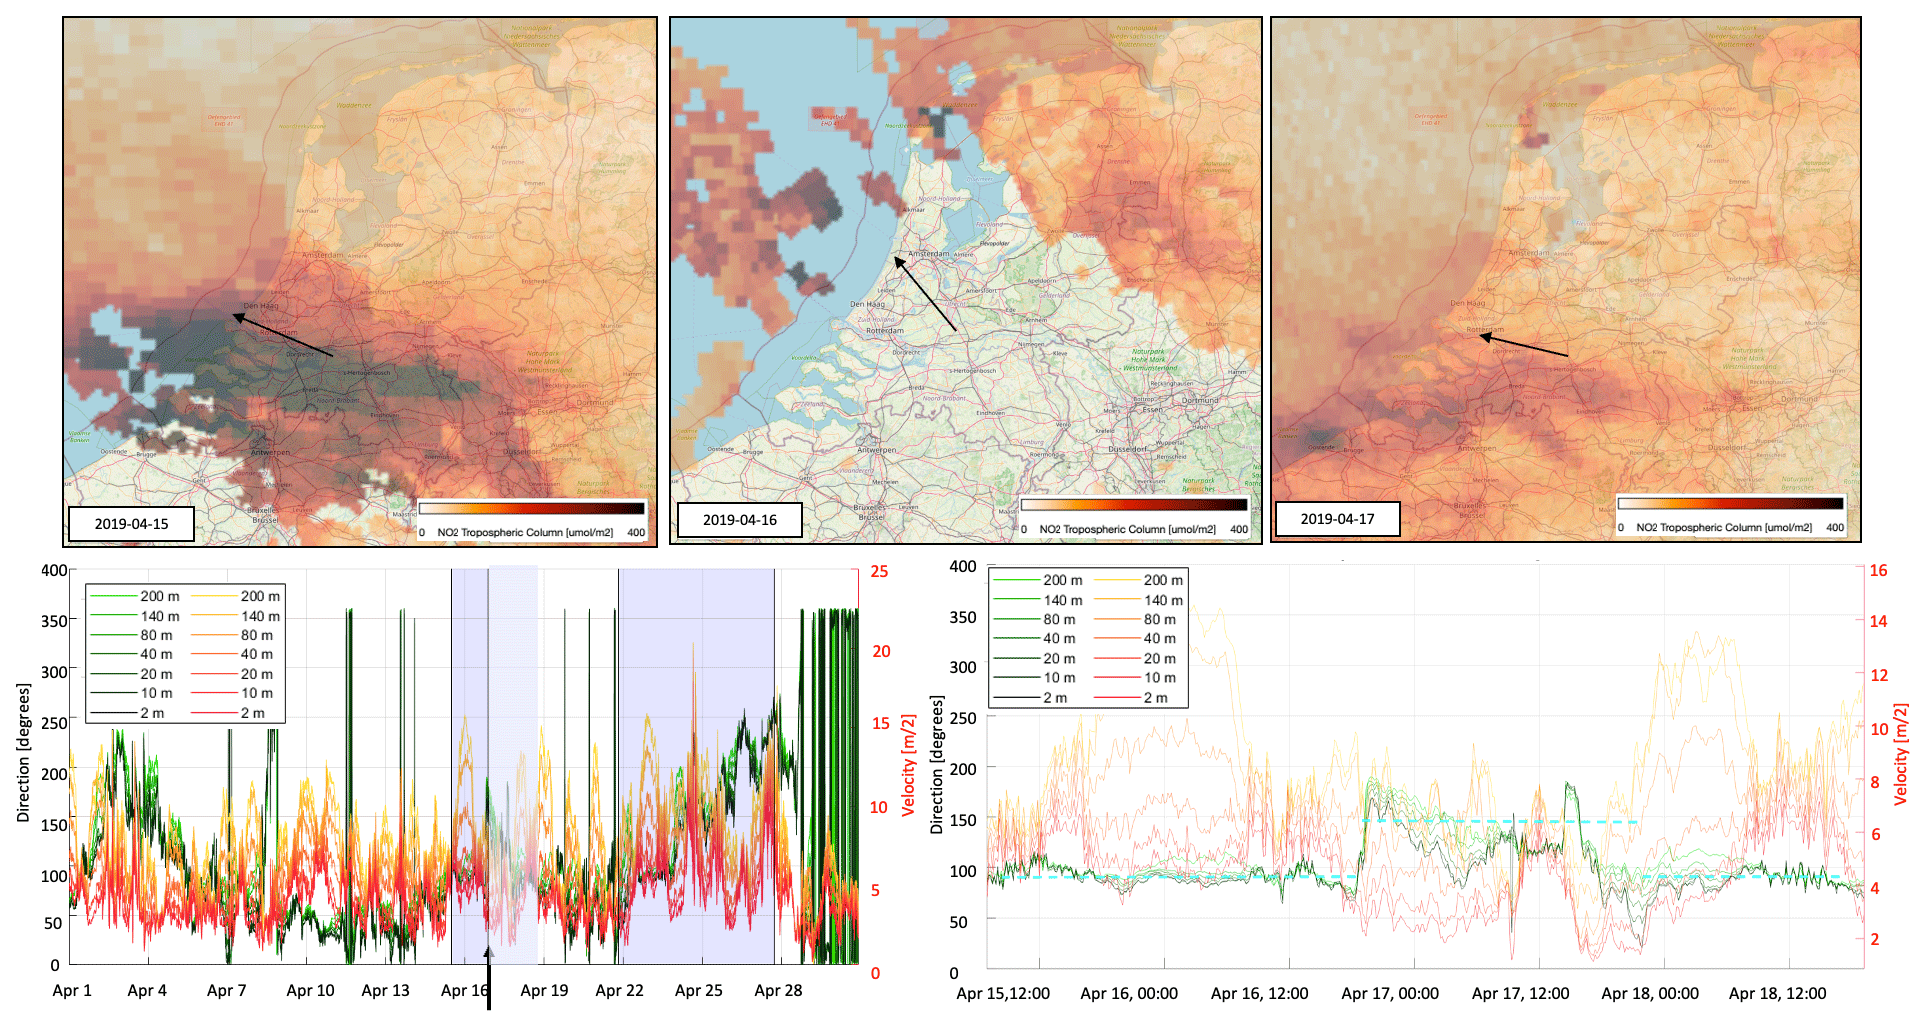
Figure A1Transport plumes of NO2 TROPOMI tropospheric column observations compared with the Cabauw observations for wind direction and magnitude for seven levels at 2–200 m from 15 April 2019 to 17 April 2019. © OpenStreetMap contributors 2021. Distributed under the Open Data Commons Open Database License (ODbL) v1.0.
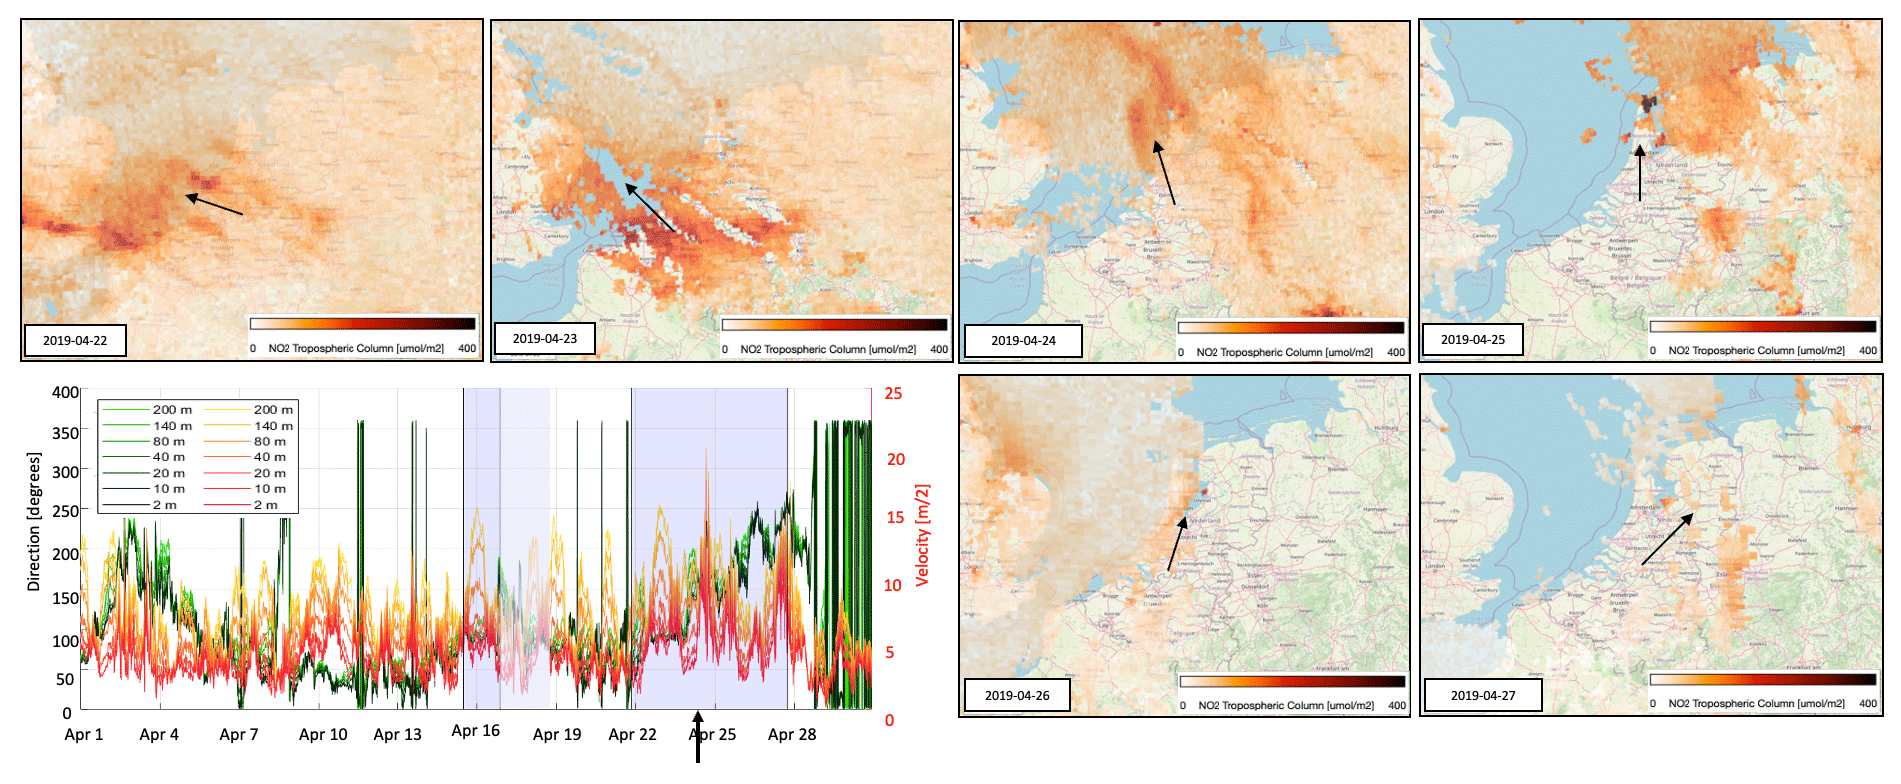
Figure A2Transport plumes of NO2 TROPOMI tropospheric column observations compared with the CABAUW observations for wind direction and magnitude for seven levels at 2–200 m from 22 April 2019 to 27 April 2019 in which a scenario of changing air mass direction drive the transport of contaminants. © OpenStreetMap contributors 2021. Distributed under the Open Data Commons Open Database License (ODbL) v1.0.
The dataset used in this study was obtained from a public repository hosted on Zenodo, a widely recognized open-access repository that facilitates research data sharing and collaboration. This particular dataset, accessible at https://doi.org/10.5281/zenodo.8431342 (Yarce Botero et al., 2023), provides comprehensive data essential for our analysis. It was published in 2023 and supports the findings of this research. To download the Cabauw data please use the following link: https://dataplatform.knmi.nl/dataset/cesar-tower-meteo-lb1-t10-v1-2 (Koninklijk Nederlands Meteorologisch Instituut, 2020).
Map data are copyrighted by OpenStreetMap contributors and available from https://www.openstreetmap.org (OpenStreetMap Contributors, 2021)
The NO2 data were downloaded for the ground stations at different places in the Netherlands from http://www.luchtmeetnet.nl (last access: 15 January 2023, Luchtmeetnet.nl, 2024).
The supplement related to this article is available online at: https://doi.org/10.5194/gmd-17-3765-2024-supplement.
Conceptualization: AYB and MvW. Methodology: AYB. Software: AYB and AS. Analysis: AYB, MvW, AS, and HE. Formal resources: MvW, HE, and PS. Data curation: AYB. Writing original draft preparation: AYB. Writing review and editing: MvW and AS. Visualization: AYB. Project administration: MvW. All authors have read and agreed to the published version of the paper.
The contact author has declared that none of the authors has any competing interests.
Publisher's note: Copernicus Publications remains neutral with regard to jurisdictional claims made in the text, published maps, institutional affiliations, or any other geographical representation in this paper. While Copernicus Publications makes every effort to include appropriate place names, the final responsibility lies with the authors.
The modelling simulation and subsequent analysis of the output were carried out on the Dutch National Supercomputer, Snellius. This research was supported and facilitated by the Dutch national e-infrastructure and the SURF Cooperative.
This research has been supported by the NWO programme Gebruikersondersteuning (grant no. KNW19002) (Dutch collaborative network for air pollution monitoring using satellites).
This paper was edited by Slimane Bekki and reviewed by two anonymous referees.
Apituley, A., Russchenberg, H., van der Marel, H., Bosveld, F., Boers, R., ten Brink, H., de Leeuw, G., Uijlenhoet, R., Arbresser-Rastburg, B., and Rockmann, T.: Overview of research and networking with ground based remote sensing for atmospheric profiling at the cabauw experimental site for atmospheric research (cesar)-the netherlands, in: IGARSS 2008-2008 IEEE International Geoscience and Remote Sensing Symposium, 6–11 July 2008, Boston, Ma, USA, vol. 3, pp. III–903, IEEE, https://doi.org/10.1109/IGARSS.2008.4779496, 2008. a
Baas, P., Verzijlbergh, R., van Dorp, P., and Jonker, H.: Investigating energy production and wake losses of multi-gigawatt offshore wind farms with atmospheric large-eddy simulation, Wind Energ. Sci., 8, 787–805, https://doi.org/10.5194/wes-8-787-2023, 2023. a
Bengtsson, L., Andrae, U., Aspelien, T., Batrak, Y., Calvo, J., de Rooy, W., Gleeson, E., Hansen-Sass, B., Homleid, M., Hortal, M., Ivarsson, K.-I., Lenderink, G., Niemelä, S., Nielsen, K. P., Onvlee, J., Rontu, L., Samuelsson, P., Muñoz, D. S., Subias, A., Tijm, S., Toll, V., Yang, X., and Ødegaard Køltzow, M.: The HARMONIE–AROME Model Configuration in the ALADIN–HIRLAM NWP System, Mon. Weather Rev., 145, 1919–1935, https://doi.org/10.1175/MWR-D-16-0417.1, 2017. a, b
Boersma, K. F., Eskes, H. J., Dirksen, R. J., van der A, R. J., Veefkind, J. P., Stammes, P., Huijnen, V., Kleipool, Q. L., Sneep, M., Claas, J., Leitão, J., Richter, A., Zhou, Y., and Brunner, D.: An improved tropospheric NO2 column retrieval algorithm for the Ozone Monitoring Instrument, Atmos. Meas. Tech., 4, 1905–1928, https://doi.org/10.5194/amt-4-1905-2011, 2011. a
Bosveld, F. C., Baas, P., Beljaars, A. C., Holtslag, A. A., de Arellano, J. V.-G., and Van De Wiel, B. J.: Fifty years of atmospheric boundary-layer research at Cabauw serving weather, air quality and climate, Bound.-Lay. Meteorol., 177, 583–612, 2020. a
Chang, T. Y.: Current concepts and applications of air quality simulation models, Environ. Int., 3, 337–351, 1980. a
Clark, P., Roberts, N., Lean, H., Ballard, S. P., and Charlton-Perez, C.: Convection-permitting models: a step-change in rainfall forecasting, Meteorol. Appl., 23, 165–181, 2016. a
Ding, J.: Impact of HARMONIE high-resolution meteorological forecasts on the air quality simulations of LOTOS-EUROS, Trainee report at Royal Netherlands Meteorological Institute, 2013. a
El-Harbawi, M.: Air quality modelling, simulation, and computational methods: a review, Environ. Rev., 21, 149–179, 2013. a
Engdahl, B. J. K., Thompson, G., and Bengtsson, L.: Improving the representation of supercooled liquid water in the HARMONIE-AROME weather forecast model, Tellus A, 72, 1–18, 2020. a
Escudero, M., Segers, A., Kranenburg, R., Querol, X., Alastuey, A., Borge, R., de la Paz, D., Gangoiti, G., and Schaap, M.: Analysis of summer O3 in the Madrid air basin with the LOTOS-EUROS chemical transport model, Atmos. Chem. Phys., 19, 14211–14232, https://doi.org/10.5194/acp-19-14211-2019, 2019. a
Fountoukis, C. and Nenes, A.: ISORROPIA II: a computationally efficient thermodynamic equilibrium model for K+–Ca2+–Mg2+––Na+–––Cl−–H2O aerosols, Atmos. Chem. Phys., 7, 4639–4659, https://doi.org/10.5194/acp-7-4639-2007, 2007. a
Gibbon, J. and Holm, D. D.: Extreme events in solutions of hydrostatic and non-hydrostatic climate models, Philos. T. R. Soc. A, 369, 1156–1179, 2011. a
Haakenstad, H., Breivik, Ø., Furevik, B. R., Reistad, M., Bohlinger, P., and Aarnes, O. J.: NORA3: A nonhydrostatic high-resolution hindcast of the North Sea, the Norwegian Sea, and the Barents Sea, J. Appl. Meteorol. Clim., 60, 1443–1464, 2021. a
Kalverla, P., Steeneveld, G.-J., Ronda, R., and Holtslag, A. A.: Evaluation of three mainstream numerical weather prediction models with observations from meteorological mast IJmuiden at the North Sea, Wind Energy, 22, 34–48, 2019. a, b
Khan, S. and Hassan, Q.: Review of developments in air quality modelling and air quality dispersion models, J. Environ. Eng. Sci., 16, 1–10, 2020. a
Knoop, S., Ramakrishnan, P., and Wijnant, I.: Dutch Offshore Wind Atlas Validation against Cabauw Meteomast Wind Measurements, Energies, 13, 6558, https://doi.org/10.3390/en13246558, 2020. a
Koninklijk Nederlands Meteorologisch Instituut: Meteo profiles – validated tower profiles of wind, dew point, temperature and visibility at 10 minute interval at Cabauw, v1.2, KNMI Data Services [data set], https://dataplatform.knmi.nl/dataset/cesar-tower-meteo-lb1-t10-v1-2 (last access: 10 April 2023), 2020. a
Lawrence, M. G.: The relationship between relative humidity and the dewpoint temperature in moist air: A simple conversion and applications, B. Am. Meteorol. Soc., 86, 225–234, 2005. a
Lorenc, A. C. and Jardak, M.: A comparison of hybrid variational data assimilation methods for global NWP, Q. J. Roy. Meteor. Soc., 144, 2748–2760, 2018. a
Luchtmeetnet.nl: Luchtmeetnet.nl, Ministry of Infrastructure and the Environment and National Institute of Public Health and the Environment (RIVM) and other regional EPAs [data set], https://www.luchtmeetnet.nl (last access: 15 January 2023), 2024. a
Manders, A. M. M., Builtjes, P. J. H., Curier, L., Denier van der Gon, H. A. C., Hendriks, C., Jonkers, S., Kranenburg, R., Kuenen, J. J. P., Segers, A. J., Timmermans, R. M. A., Visschedijk, A. J. H., Wichink Kruit, R. J., van Pul, W. A. J., Sauter, F. J., van der Swaluw, E., Swart, D. P. J., Douros, J., Eskes, H., van Meijgaard, E., van Ulft, B., van Velthoven, P., Banzhaf, S., Mues, A. C., Stern, R., Fu, G., Lu, S., Heemink, A., van Velzen, N., and Schaap, M.: Curriculum vitae of the LOTOS–EUROS (v2.0) chemistry transport model, Geosci. Model Dev., 10, 4145–4173, https://doi.org/10.5194/gmd-10-4145-2017, 2017. a
Manders-Groot, A., Schaap, M., van Ulft, B., and van Meijgaard, E.: Coupling of the air quality model Lotus-Euros to the climate model Racmo, National Research Programme Knowledge for Climate Nationaal Onderzoekprogramma Kennis voor Klimaat (KvK), https://edepot.wur.nl/328070 (last access: 1 July 2023), 2011. a
Marseille, G.-J. and Stoffelen, A.: Toward Scatterometer Winds Assimilation in the Mesoscale HARMONIE Model, IEEE J. Sel. Top. Appl., 10, 2383–2393, https://doi.org/10.1109/JSTARS.2016.2640339, 2017. a
Menut, L., Bessagnet, B., Briant, R., Cholakian, A., Couvidat, F., Mailler, S., Pennel, R., Siour, G., Tuccella, P., Turquety, S., and Valari, M.: The CHIMERE v2020r1 online chemistry-transport model, Geosci. Model Dev., 14, 6781–6811, https://doi.org/10.5194/gmd-14-6781-2021, 2021. a
OpenStreetMap Contributors: OpenStreetMap, Open Data Commons [data set], https://www.openstreetmap.org (last access: 1 April 2023), 2021. a
Pielke, R. A. and Uliasz, M.: Use of meteorological models as input to regional and mesoscale air quality models–limitations and strengths, Atmos. Environ., 32, 1455–1466, 1998. a
Saito, K., Ishida, J.-I., Aranami, K., Hara, T., Segawa, T., Narita, M., and Honda, Y.: Nonhydrostatic Atmospheric Models and Operational Development at JMA, J. Meteorol. Soc. Jpn. Ser. II, 85B, 271–304, https://doi.org/10.2151/jmsj.85B.271, 2007. a
Schaap, M., van Loon, M., ten Brink, H. M., Dentener, F. J., and Builtjes, P. J. H.: Secondary inorganic aerosol simulations for Europe with special attention to nitrate, Atmos. Chem. Phys., 4, 857–874, https://doi.org/10.5194/acp-4-857-2004, 2004. a
Schaap, M., Timmermans, R. M., Roemer, M., Boersen, G., Builtjes, P., Sauter, F., Velders, G., and Beck, J.: The LOTOS? EUROS model: description, validation and latest developments, Int. J. Environ. Pollut., 32, 270–290, 2008. a
Thürkow, M., Kirchner, I., Kranenburg, R., Timmermans, R., and Schaap, M.: A multi-meteorological comparison for episodes of PM10 concentrations in the Berlin agglomeration area in Germany with the LOTOS-EUROS CTM, Atmos. Environ., 244, 117946, https://doi.org/10.1016/j.atmosenv.2020.117946, 2021. a
van Stratum, B., Theeuwes, N., Barkmeijer, J., van Ulft, B., and Wijnant, I.: A One-Year-Long Evaluation of a Wind-Farm Parameterization in HARMONIE-AROME, J. Adv. Model. Earth Sy., 14, e2021MS002947, https://doi.org/10.1029/2021MS002947, 2022. a, b
Verzijlbergh, R.: Atmospheric flows in large wind farms, Europhysics News, 52, 20–23, 2021. a
Viana Jiménez, S. and Díez Muyo, M. V.: Procesos de superficie en Harmonie-Arome y su importancia en procesos atmosféricos, Sexto simposio nacional de prediccion – Memorial Antionio Mestres, 17–19 September 2018, Servicios Centrales de AEMET, Madrid, 325–334, https://doi.org/10.31978/639-19-010-0.325, 2019. a
Wichink Kruit, R. J., Schaap, M., Sauter, F. J., van Zanten, M. C., and van Pul, W. A. J.: Modeling the distribution of ammonia across Europe including bi-directional surface–atmosphere exchange, Biogeosciences, 9, 5261–5277, https://doi.org/10.5194/bg-9-5261-2012, 2012. a
Yarce Botero, A., Van Weele, M., Segers, A., Siebesma, P., and Eskes, H.: Investigating the impact of HARMONIE-WINS50 (cy43) and LOTOS-EUROS (v2.2.002) coupling on NO2 concentrations in The Netherlands (LOTOS-EUROS V2.2002. HARMONIE (Cy43) WINS50). GEIA: Global Emissions InitiAtive (GEIA), Brussels, Zenodo [code and data set], https://doi.org/10.5281/zenodo.8431342, 2023. a