the Creative Commons Attribution 4.0 License.
the Creative Commons Attribution 4.0 License.
A single-column ocean biogeochemistry model (GOTM–TOPAZ) version 1.0
Hyun-Chae Jung
Byung-Kwon Moon
Jieun Wie
Hyei-Sun Park
Johan Lee
Young-Hwa Byun
Recently, Earth system models (ESMs) have begun to consider the marine ecosystem to reduce errors in climate simulations. However, many models are unable to fully represent the ocean-biology-induced climate feedback, which is due in part to significant bias in the simulated biogeochemical properties. Therefore, we developed the Generic Ocean Turbulence Model–Tracers of Phytoplankton with Allometric Zooplankton (GOTM–TOPAZ), a single-column ocean biogeochemistry model that can be used to improve ocean biogeochemical processes in ESMs. This model was developed by combining GOTM, a single-column model that can simulate the physical environment of the ocean, and TOPAZ, a biogeochemical module. Here, the original form of TOPAZ has been modified and modularized to allow easy coupling with other physical ocean models. To demonstrate interactions between ocean physics and biogeochemical processes, the model was designed to allow ocean temperature to change due to absorption of visible light by chlorophyll in phytoplankton. We also added a module to reproduce upwelling and the air–sea gas transfer process for oxygen and carbon dioxide, which are of particular importance for marine ecosystems. The simulated variables (e.g., chlorophyll, oxygen, nitrogen, phosphorus, silicon) of GOTM–TOPAZ were evaluated by comparison against observations. The temporal variability in the observed upper-ocean (0–20 m) chlorophyll is well captured by the GOTM–TOPAZ with a correlation coefficient of 0.53 at point 107 in the Sea of Japan. The surface correlation coefficients among GOTM–TOPAZ oxygen, nitrogen, phosphorus, and silicon are 0.47, 0.31, 0.16, and 0.19, respectively. We compared the GOTM–TOPAZ simulations with those from MOM–TOPAZ and found that GOTM–TOPAZ showed relatively lower correlations, which is most likely due to the limitations of the single-column model. Results also indicate that source–sink terms may contribute to the biases in the surface layer (<60 m), while initial values are important for realistic simulations in the deep sea (>250 m). Despite this limitation, we argue that our GOTM–TOPAZ model is a good starting point for further investigation of key biogeochemical processes and is also useful to couple complex biogeochemical processes with various oceanic global circulation models.
- Article
(12630 KB) - Full-text XML
- BibTeX
- EndNote
Over several decades, climate researchers have accumulated significant knowledge on atmosphere–land–ocean feedback processes through various studies related to climate systems (Friedlingstein et al., 2006; Soden and Held, 2006; Dirmeyer et al., 2012; Randerson et al., 2015). With the advancement of coupled modeling techniques and an exponential increase in the number of computer resources available, climate research institutions worldwide began competing to develop Earth system models (ESMs) (Dunne et al., 2012a, b; Jones and Sellar, 2015; Sokolov et al., 2018). ESMs are often coupled with biogeochemistry models that consider the atmosphere–ocean carbon cycle and ocean ecosystem cycles (Dunne et al., 2012b; Yool et al., 2013; Azhar et al., 2014; Stock et al., 2014; Aumont et al., 2015). Recently, reproductions of ocean ecosystems in ESMs have become very precise with the addition of physiological details, such as light or nutrient acclimation, and the division of various phytoplankton and zooplankton into functional groups (Hense et al., 2017).
The following processes are generally considered the most important in ocean biogeochemistry models: the ocean ecosystem cycle, including phytoplankton and zooplankton; the biogeochemical carbon cycle; and the biogeochemical cycle of key nutrients (P, N, Fe, and Si) (Dunne et al., 2012b; Aumont et al., 2015). These three cycles are not independent and include mutual material exchange through chemical mechanisms. There are still no accurate methodologies with which to differentiate biogeochemical variables and to represent biogeochemical processes as formulas (Sauerland et al., 2018). In other words, biogeochemical processes are reproduced in the model via parameterization that adjusts the parameters of a formula based on observations and some general parameters (e.g., maximum phytoplankton growth rate) that are adjusted until the model produces reasonable results (Sauerland et al., 2018).
Researchers have been using single-column models (SCMs) to control the parameterizations and increase their understanding of the physical processes in models. Betts and Miller (1986) suggested that SCMs were an effective tool with which to develop and control the convective scheme of an atmospheric model, while Price et al. (1986) used an ocean SCM to study the daily cycle of the mixed layer in the Pacific Ocean. A SCM allows for control of physics parameters, alongside large-scale forcing influences, and, unlike 3-D models, it has a low calculation cost. Accordingly, SCMs have been viewed as essential tools with which to develop and improve numerical models (Lebassi-Habtezion and Caldwell, 2015; Hartung et al., 2018). SCM-based studies are essential for improving ocean biogeochemical processes, which are reproduced in climate models based on column physics (Evans and Garçon, 1997; Burchard et al., 2006; Bruggenman and Bolding, 2014). Even the latest analyses of the ESMs included in the Coupled Model Intercomparison Project Phase 5 (CMIP5) show high biases and inter-model diversity in ocean biogeochemical variables (Lim et al., 2017). Therefore, a single-column form of a biogeochemistry model might be a useful tool to meet the ongoing demand for improvements in biogeochemistry models in ESMs.
The oceanic biogeochemical cycle affects not only the physical environment of the upper ocean but also that of the entire climate system, and such changes produce feedback that, in turn, alters the ocean ecosystem (Hense et al., 2017; Lim et al., 2017; Park et al., 2018). Hense et al. (2017) presented the CO2 cycle, gas and particle cycle, and changes in the physical environment of the upper ocean by chlorophyll as important climate–ocean biogeochemistry feedback loops reproduced in ESMs that are currently available. An ESM that reproduces all three of these biological mechanisms does not exist today; however, all of these mechanisms need to be properly reproduced in the ESMs to reduce the uncertainty in predicting future climate change. This would allow ESMs to change in a fundamentally different way. Furthermore, there are generally time constraints in repeated experiments using ocean general circulation models (OGCMs) and biogeochemistry models due to their complexity and the heavy calculation required. Consequently, SCMs are crucial for applying and testing new climate–ocean biogeochemistry feedbacks in existing ESMs.
In this study, we developed the Generic Ocean Turbulence Model–Tracers of Phytoplankton with Allometric Zooplankton (GOTM–TOPAZ), which is a single-column ocean biogeochemistry model. GOTM is a one-dimensional ocean model that focuses on reproducing statistical turbulence closures (see http://www.gotm.net, last access: 22 November 2018); TOPAZ is an ocean biogeochemistry model developed by the Geophysical Fluid Dynamics Laboratory (GFDL) and coupled with the ESM2M and ESM2G models (Dunne et al., 2012a, b). We modularized TOPAZ to apply external physical environmental data while modifying it as a SCM. It was then combined with a GOTM utilizing an air–sea gas exchange for CO2 and O2 and optical feedback from photosynthesis by chlorophyll. A vertical advection prescription module that can reproduce upwelling was also added to this model. To verify GOTM–TOPAZ, we selected points in the Sea of Japan off the coast of the Korean Peninsula upon which to conduct simulations. The results produced by the model were compared to observed data and results from OGCMs to verify the reliability of GOTM-TOPAZ.
In GOTM–TOPAZ, GOTM version 4.0 is applied to ocean physics. The physical basis of GOTM is Reynolds-averaged Navier–Stokes equations in a rotational coordinate system (Eqs. 1 and 2). Moreover, the temperature and salinity equations derived using these methods are given in Eqs. (3) and (4), respectively. GOTM uses one-dimensional potential temperature, salinity, and horizontal velocity based on these four equations, as shown below.
In Eqs. (1) and (2), u, v, and w represent the mean velocities in the spatial directions x (eastward), y (northward), and z (upward), respectively; ν represents the molecular diffusivity of momentum; ρ0 represents a constant reference density; p represents pressure; and f represents the Coriolis parameter. In Eq. (3), the temperature (T) equation, ν′ represents the molecular diffusivity due to heat, cp represents the heat capacity, and I represents the vertical divergence of short-wave radiation. The effect of solar radiation absorbed by seawater is included in this equation; thus, Eq. (3) is closely associated with the radiation parameterization method. Moreover, a coupled ocean biogeochemistry model must contain an additional short-wave absorption process associated with chlorophyll synthesis distributed throughout the upper-ocean layer (Morel and Antoine, 1994; Cloern et al., 1995; Manizza et al., 2005; Litchman et al., 2015; Hense et al., 2017). Based on the methodology of Manizza et al. (2005), we applied a visible light absorption process due to chlorophyll synthesis, explained in detail in Sect. 4.4, to the coupled model. Equation (4) explains the vertical distribution of salinity (S). In this equation, ν′′ represents the molecular diffusivity of salinity, τR represents the relaxation timescale, and SR represents the observed salinity distribution. In other words, the terms on the right side of this equation express the “relaxation” process based on observations. Unlike 3-D models, SCMs cannot reproduce horizontal advection. Therefore, as salinity is greatly affected by horizontal advection, it is necessary to prescribe and supplement the observed value to the simulated value with the terms on the right side of Eq. (4) (Burchard et al., 2006). Please see Umlauf and Burchard (2003, 2005), Umlauf et al. (2005), and Burchard et al. (2006) for further detailed information on GOTM.
We chose TOPAZ version 2.0 to couple with GOTM. TOPAZ simulates the nitrogen, phosphorus, iron, dissolved oxygen, and lithogenic material cycles as well as the ocean carbon cycle while also considering zooplankton and phytoplankton growth cycles. It divides phytoplankton into small and large groups based on size, including the group of nitrogen-fixing diazotrophs. Consequently, TOPAZ handles a total of 30 prognostic and 11 diagnostic tracers. The local changes in the tracers simulated in TOPAZ can be explained by the following equation:
Equation (5) is an advection–diffusion equation for each state variable C simulated in TOPAZ. In this equation, v represents the velocity vector calculated in the ocean model, K represents diffusivity, and SC represents the sources minus the sinks of C calculated at each point in the model. TOPAZ has received data from the ocean model in terms of the transport tendency of the tracers associated with advection and horizontal diffusion, and it calculates vertical diffusion and source–sink terms internally. The biological processes of TOPAZ were reproduced with a focus on phytoplankton growth, nutrient and light limitations, the grazing process, and empirical formulas derived from observations. These are followed by the Redfield ratio (Redfield et al., 1963), Liebig's law of the minimum (De Baar, 1994), and size considerations (large organisms feed on smaller ones), which were used to establish the ocean ecosystem model (Dunne et al., 2012b). Please see Dunne et al. (2012b) for further detailed information on TOPAZ.
TOPAZ was initially coupled with Modular Ocean Model 5 (MOM5), an OGCM developed by the GFDL. We separated TOPAZ from MOM5 and constructed two modules by separating the initialization and main calculation subroutines. This model was then modified into a SCM while adding interfaces associated with surface flux prescriptions (boundary conditions) and initial data input.
In our new coupled model, GOTM provided ocean physics calculations for TOPAZ, and TOPAZ relayed optical feedback from the chlorophyll simulated according to these data to GOTM. A subroutine that calculates the optical feedback from chlorophyll and another that prescribes the vertical advection were added to GOTM–TOPAZ (see Fig. 1 for the flow diagram). Upwelling that usually occurs along coastal areas due to wind plays a major role in changing the vertical distribution of zooplankton and phytoplankton by supplying the surface layer with nutrient-rich intermediate water (Krezel et al., 2005; Lips and Lips, 2010; Shin et al., 2017). We connected the vertical advection module in GOTM to TOPAZ so that the upwelling was reproduced in TOPAZ.
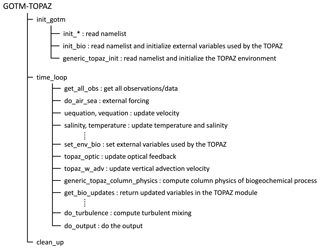
Figure 1Flow diagram of the Fortran subroutines comprising the Generic Ocean Turbulence Model–Tracers of Phytoplankton with Allometric Zooplankton.
4.1 Initial conditions
The initial data needed to run GOTM–TOPAZ can be divided into the data needed to operate the GOTM and TOPAZ models individually. To run GOTM, it is necessary to have the initial ocean data (temperature and salinity) and the salinity data for the duration of the model run time. The latter are needed to relax GOTM. For TOPAZ, initial data are needed for the 30 prognostic and 11 diagnostic tracers.
4.2 Boundary conditions
Atmospheric forcing data must be prescribed in GOTM–TOPAZ because it is not coupled with an atmospheric model. The atmospheric forcing variables needed to run the model are 10 m u wind; v wind (m s−1); surface (2 m) air pressure (hPa); surface (2 m) air temperature (∘C); relative humidity (%), wet bulb temperature (∘C), or dew point temperature (∘C); and cloud cover (1∕10).
Values for surface or bottom fluxes for a few types of tracers must be provided to accurately simulate ocean biogeochemical variables. TOPAZ includes processes for variables including sediment calcite cycling and the external bottom fluxes of O2, NH4, PO4, and alkalinity (Dunne et al., 2012b). However, it does not include a process for calculating the atmosphere–ocean surface flux. Therefore, we added processes for calculating the surface fluxes of O2, NO3, NH4, alkalinity, lithogenic aluminosilicate, dissolved iron, and dissolved inorganic carbon. Of the subroutines shown in Fig. 1, the calculation of the surface fluxes is implemented using generic_topaz_column_physics. The surface flux of NO3, NH4, lithogenic aluminosilicate, and dissolved iron is prescribed using monthly average climate values, while alkalinity is calculated from prescribed NO3 dry or wet deposition values. These surface flux data are provided by the Australian Research Council's Centre of Excellence for Climate System Science (ARCCSS; http://climate-cms.unsw.wikispaces.net/Data, last access: 22 November 2018). The following equation was used to calculate the air–sea gas transfer for O2 and CO2 (dissolved inorganic carbon):
Here, F is the upward flux of gas A, and kw is its gas transfer velocity, which can be calculated as a function of the Schmidt number and wind speed at 10 m (Wanninkhof, 1992). ρ is the density of surface seawater, [A] is the concentration (µmol kg−1) of gas A at the surface of the ocean, and [A]sat is the corresponding saturation concentration of gas A in equilibrium with a water-vapor-saturated atmosphere at total atmospheric pressure (Najjar and Orr, 1998). [A] is predicted by the model. Please see Najjar and Orr (1998) for further detailed information related to Eq. (6).
4.3 Ocean physics
GOTM simulates the physics of oceanic environments based on Eqs. (1)–(4). In the coupled model, GOTM relays the following simulated one-dimensional ocean physical variables to the TOPAZ module at each time step: potential temperature (∘C), salinity (psu), thermal diffusion coefficient (m2 s−1), density (kg m−3), thickness (m), mixed layer thickness (m), and radiation (W m−2).
4.4 Optical feedback
As explained in Sect. 2, the photosynthesis of chlorophyll distributed throughout the upper ocean is known to have physical effects. Manizza et al. (2005) used satellite observation data and OGCMs to conduct a study of changes in ocean irradiance due to the absorption of visible light by chlorophyll. We used their methodology to apply the optical feedback from chlorophyll on GOTM–TOPAZ in the following manner.
In these equations, visible light was divided into red and blue/green bands in accordance with Manizza et al. (2005). In Eq. (7), λ represents the wavelength of these bands and ksw(λ) represents the light attenuation coefficient of optically pure seawater, which has values of 0.225 and 0.0232 m−1, respectively, in red and blue/green bands. In these bands, the values of the pigment adsorption χ(λ) are 0.037 and 0.074 m−2 mg Chl m−3, respectively; e(λ), the power law for absorption, has values of 0.629 and 0.674 (no units), respectively. Moreover, [chl] represents the concentration of chlorophyll in milligrams of chlorophyll per cubic meter.
Infrared light (IIR) and visible light (IVIS) that reach mean open ocean conditions are set in Eqs. (8) and (9), respectively, by default. However, GOTM–TOPAZ can change the light extinction method by modifying the name list in GOTM (see http://www.gotm.net, last access: 22 November 2018) and this can also be used to change the coefficients of IIR and IVIS. The total irradiance of the red and blue/green bands that reach the ocean surface is represented in Eq. (10). Ultimately, the irradiance of visible light transmitted at each vertical level (z) can be calculated in GOTM–TOPAZ using Eq. (11). Moreover, the sum of the second and third terms on the right side of Eq. (11) represents photosynthetically active radiation (PAR) and is used in TOPAZ to calculate the growth rate of phytoplankton groups.
4.5 Vertical advection
As mentioned at the beginning of Sect. 4, the upwelling phenomenon generated by coastal winds is known to affect phytoplankton growth by supplying nutrient-rich intermediate water to the upper ocean. GOTM is already designed to allow users to prescribe vertical advection to experiments. Therefore, we linked the subroutines of GOTM that are related to vertical advection to TOPAZ, so GOTM–TOPAZ users can study the impact of upwelling on the biogeochemical environment of the ocean. Users can prescribe vertical advection as a constant or input the velocities by time and depth in ASCII format to reproduce the desired form of vertical motions. Please refer to the GOTM home page (http://www.gotm.net, last access: 22 November 2018) and Burchard et al. (2006) for further technical details and numerical analysis of the vertical advection in GOTM.
The Sea of Japan is unique, with its steep topography and three large, deep, and semi-enclosed basins. Moreover, it is somewhat isolated from other major oceans, connects to the Pacific Ocean through a narrow strait, and is sometimes referred to as a miniature ocean since it contains a double gyre and experiences various oceanic phenomena (Ichiye, 1984). The high-temperature, high-salinity Tsushima Warm Current (TWC) introduced through the Korea Strait is divided into two main branches: the nearshore branch, which flows northeastward along the Japanese coast, and the East Korean Warm Current (EKWC), which flows northward along the Korean coast (Uda, 1934; Tanioka, 1968; Moriyasu, 1972) (Fig. 2). Apart from these two main branches, there is another that exists offshore of the first branch, but it is not present all year (Shimomura and Miyata, 1957; Kawabe, 1982). To the north, the North Korean Cold Current (NKCC) flows southward along the Korean coast. Furthermore, the 200–400 m East Sea Intermediate Water (ESIW) is known for its high concentration of dissolved oxygen and the appearance of a salinity-minimum layer (Kim and Chung, 1984; Kim and Kim, 1999). The Sea of Japan is divided into warm and cold regions relative to the 40∘ N parallel, and, since the current pattern and characteristics of the Sea of Japan vary spatially and seasonally, this region is very important to oceanographic studies. This region is also considered important for biogeochemical research (Joo et al., 2014; Kim et al., 2016; Shin et al., 2017) for the following reasons: the nutrient-rich seawater that flows along the southern coast of the Korean Peninsula due to inflow from the Nakdong River, which is located at its southeastern end; the influence of a strong southerly wind during the summer, which causes upwelling off the coast of the Sea of Japan; and the transport of this nutrient- and chlorophyll-rich seawater near Ulleungdo by the EKWC. We selected three points that have features typical of the Sea of Japan and for which observation data suitable to use for verification exist (Fig. 2): point 107, where the EKWC and NKCC meet (130.0∘ E, 38.0∘ N); point 104, which is an important location along the EKWC (131.3∘ E, 37.1∘ N); and point 102, which is in the middle of a warm eddy created as the EKWC moves north (130.6∘ E, 36.1∘ N). As noted previously, these points are in regions with strong advection and thus may not be suitable for testing GOTM–TOPAZ, which is a SCM. However, since the results obtained using GOTM–TOPAZ were significant when compared to the observations, we think that this shows that it is possible to perform sensitivity experiments using GOTM–TOPAZ at several kinds of locations.
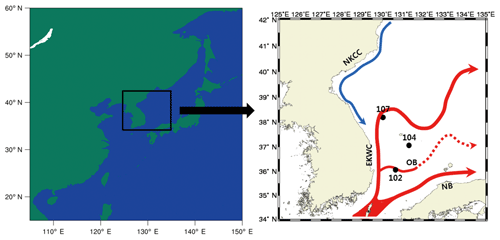
Figure 2Location of points (107, 104, 102) in the Sea of Japan and flow of the nearby North Korean Cold Current (NKCC), East Korean Warm Current (EKWC), offshore branch (OB) of the Tsushima Warm Current, and the nearshore branch (NB) of the Tsushima Warm Current.
The observed data, such as seawater temperature and salinity, were used to initialize and relax vertical structures in GOTM throughout the simulation. These data were provided by the National Institute of Fisheries Science (NIFS; http://www.nifs.go.kr/kodc, last access: 22 November 2018). The water temperature and salinity data from the NIFS were measured at 15 m intervals at depths of 0 to 500 m. They were measured once in February, April, June, August, October, and December every year beginning in 1961. For the initial data on prognostic and diagnostic tracers in TOPAZ, we used the data provided by ARCCSS for use with MOM5 (http://climate-cms.unsw.wikispaces.net/Data, last access: 22 November 2018). These initial tracer data were interpolated for each location, and a spin-up was applied over 14 years for use in the experiments. For atmospheric forcing data, we input 0.75∘ ERA-Interim reanalysis data provided by the European Centre for Medium-Range Weather Forecasts (Dee et al., 2011). We applied global data to our model by interpolating the latitude and longitude values of the test points.
We used the monthly average of observed seawater temperature and salinity data from the analysis fields in EN.4.2.1, provided by the Hadley Centre at the Met Office (Good et al., 2013), to verify the results from GOTM–TOPAZ following the adjusted method in Gouretski and Reseghetti (2010). With respect to chlorophyll, we compared the results simulated by the model using observational data with a resolution of 9 km gathered by the NASA Goddard Space Flight Center's Sea-Viewing Wide Field-of-View Sensor (SeaWiFS) from October 1997 to December 2007 (McClain et al., 1998). The results of simulations of dissolved oxygen and nutrients such as nitrogen, phosphorus, and silicon were tested using observational data from the NIFS; these data were measured once every year, in February, April, June, August, October, and December, at depths of 0, 20, 50, and 100 m. Specific measurement dates and times were not fixed, so we viewed the measurement data as values that represented each month and used them to verify the model. Data from a model that operated MOM5, the Sea-Ice Simulator, and TOPAZ together (MOM) were used for comparative analysis. MOM was operated using CORE-II forcing data (Large and Yeager, 2009) from 1950 to 2008. We also used data from the Surface Ocean CO2 Atlas (SOCAT) (Bakker et al., 2016) from the analysis period to verify the CO2 air–sea gas flux in TOPAZ. The time periods for which SOCAT observational data exist for point 102 are April 2001, January 2005, November 2008, and December 2008. For points 104 and 107, the time period is April 2001. Finally, we performed a spin-up for 14 years on the initial data at each point and analyzed the results of operating GOTM–TOPAZ from 1999 to 2008.
Figure 3 shows the results of the GOTM–TOPAZ simulation and observational data (EN.4.2.1) as vertical distributions of the water column over time. The vertical distributions of salinity at all points are well simulated and are comparable to the observations, although this could also be because relaxation was applied. The water temperature at point 107, as simulated by GOTM–TOPAZ, showed a cold bias in the upper layer at a depth of around 120 m (Fig. 3a). This appears to be the effect of large-scale forcing (from the EKWC) that GOTM–TOPAZ could not resolve. Similar differences in water temperature also appeared at points 104 and 102 (Fig. 3b and c). Observational results showed that the water temperature was particularly affected by the ESIW, a finding that did not appear in the GOTM–TOPAZ results. It was determined that since GOTM–TOPAZ could not reproduce advection from the ESIW, there were differences (warm bias) in the vertical water temperature distributions near depths of 200 m compared to the observational results at all points (Fig. 3).
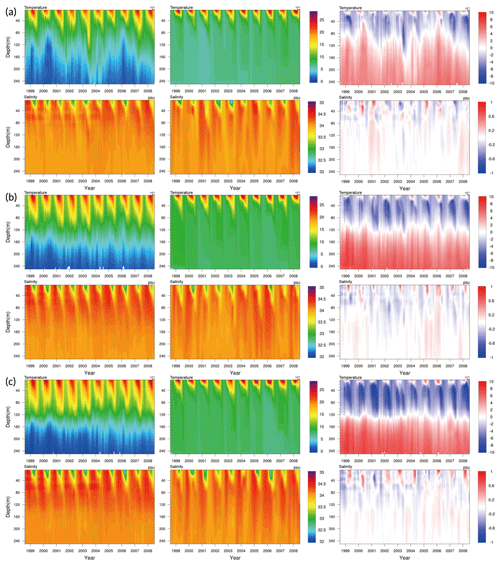
Figure 3Comparison of the vertical distribution for water temperature (∘), salinity (psu), and the difference (GOTM–TOPAZ minus the observations) at points (a) 107, (b) 104, and (c) 102 for the 10-year period (1999–2008).
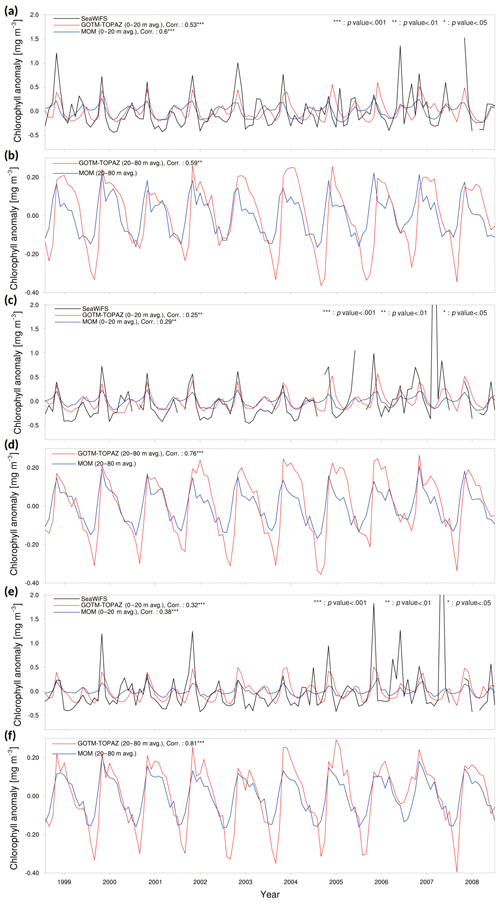
Figure 4Chlorophyll anomaly time series and correlation values for observational data (black lines), MOM5_SIS_TOPAZ results (blue lines), and GOTM–TOPAZ results (red lines) for the 10-year period of 1999–2008. Panels (a), (c), and (e) show the mean values at depths ≥20 m and the correlations between the observations and each model at points 107, 104, and 102, respectively. Panels (b), (d), and (f) show the mean values at depths of 20–80 m and the correlation between the two models at points 107, 104, and 102, respectively.
We used SeaWiFS data to measure chlorophyll concentrations using light reflected from the ocean surface and thus verified the results simulated by GOTM–TOPAZ. However, part of the reflected light reaches the satellite from the mixed layer below the ocean surface due to a backscattering effect (Jochum et al., 2009; Park et al., 2013). Therefore, we compared chlorophyll anomalies averaged up to 20 m in the data from each model and chlorophyll from SeaWiFS. The mean chlorophyll concentration at depths of 0–20 m, as simulated by GOTM–TOPAZ and MOM, had similar seasonal variabilities at point 107; their correlation coefficients versus the observational data were 0.53 and 0.60, respectively, which is statistically significant (p<0.001) (Fig. 4a). At points 104 and 102, these correlation coefficients of GOTM–TOPAZ versus the observational data were 0.25 (p<0.01) (Fig. 4c) and 0.32 (p<0.001) (Fig. 4e), respectively. In the case in which the maximum concentration of chlorophyll at all points occurred annually on the surface layer, GOTM–TOPAZ showed smaller errors against the observational results than did MOM (Fig. 4a, c, and e).
Phytoplankton in the Sea of Japan are generally present in the highest concentrations at depths of around 10–60 m (Rho et al., 2012). Therefore, we averaged chlorophyll concentrations from 20 to 80 m to verify the model results (Fig. 4b, d and f). However, since observational data for chlorophyll in the subsurface layer (∼20–80 m) were unavailable, the MOM and GOTM–TOPAZ results were compared instead. There were slight differences in the scale of the minimum and maximum concentrations of chlorophyll in the subsurface layer at point 107, but the two models had a correlation coefficient of 0.59 (p<0.01) and a similar seasonal variability (Fig. 4b). At points 104 and 102, the GOTM–TOPAZ chlorophyll results had a slightly lower correlation coefficient against the observational data than MOM did, but its seasonal variability was similar to that of the observation data and the results from MOM (Fig. 4d and f). However, when compared to the results from MOM, the time series of the chlorophyll anomaly in the ocean surface and subsurface layers simulated by GOTM–TOPAZ appear to show a time shift (Fig. 4). In the TOPAZ module in MOM, the transport tendencies of each tracer were calculated in the ocean model; however, this process was not carried out in GOTM–TOPAZ. In addition, MOM and GOTM–TOPAZ are not only just different models of the marine physical environment; the atmospheric forcing data they each use are also different. Therefore, there are complex reasons for the differences in the results of the two models, and further detailed experiments and analysis are required.
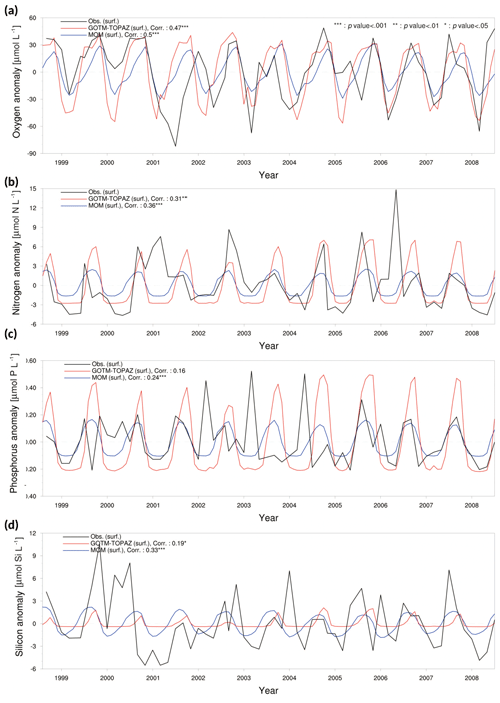
Figure 5Anomaly time series and correlation values from observational data (black lines), MOM results (blue lines), and GOTM–TOPAZ results (red lines) for concentrations of (a) dissolved oxygen, (b) nitrogen, (c) phosphorus, and (d) silicon at point 107 for the 10-year period of 1999–2008; in this figure, nitrogen, phosphorus, and silicon include NO3, PO4, and SIO4, respectively.
We evaluated the performance of GOTM–TOPAZ in terms of simulations of dissolved oxygen, nitrogen, phosphorus, and silicon. The sea surface dissolved oxygen at point 107 simulated by GOTM–TOPAZ and MOM had correlation coefficients of 0.47 (p<0.001) and 0.50 (p<0.001), respectively, versus the observed data (Fig. 5a). The GOTM–TOPAZ correlation coefficient versus the observed data was 0.31 (p<0.001) for nitrogen, 0.16 (p<0.10) for phosphorus, and 0.19 (p<0.05) for silicon; these were lower than the correlation coefficients between MOM and the observed data (0.36, 0.24, and 0.33, respectively; p<0.001). However, GOTM–TOPAZ seemed to depict the seasonal variability in nutrients at the sea surface well (Fig. 5b–d). At point 104, the GOTM–TOPAZ correlation coefficient was 0.37 (p<0.001) for dissolved oxygen, 0.54 (p<0.001) for nitrogen, 0.2 (p<0.05) for phosphorus, and 0.1 (statistically non-significant) for silicon (Fig. 6). For point 102, the GOTM–TOPAZ correlation coefficient was 0.59 (p<0.001) for dissolved oxygen, 0.24 (p<0.01) for nitrogen, 0.09 (statistically non-significant) for phosphorus, and 0.2 (p<0.01) for silicon (Fig. 7). In these two points, GOTM–TOPAZ showed values for surface dissolved oxygen and nutrients with seasonal variabilities that were similar to those of the observed data and the data from MOM (Figs. 6–7).
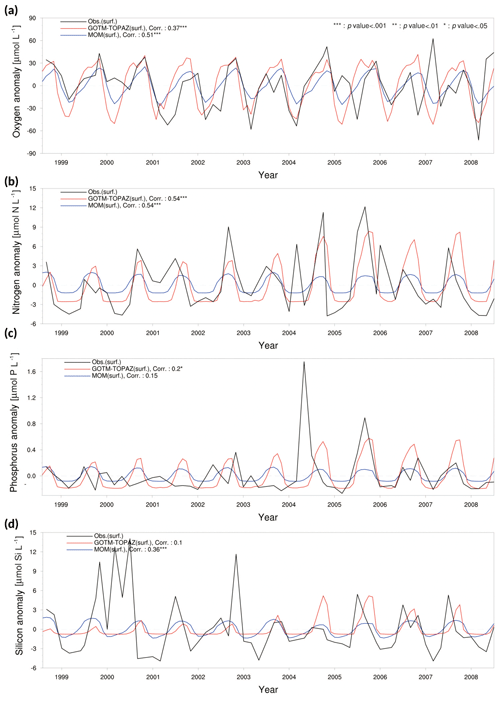
Figure 6Anomaly time series and correlation values from observational data (black lines), MOM results (blue lines), and GOTM–TOPAZ results (red lines) for concentrations of (a) dissolved oxygen, (b) nitrogen, (c) phosphorus, and (d) silicon at point 104 for the 10-year period of 1999–2008; in this figure, nitrogen, phosphorus, and silicon include NO3, PO4, and SIO4, respectively.
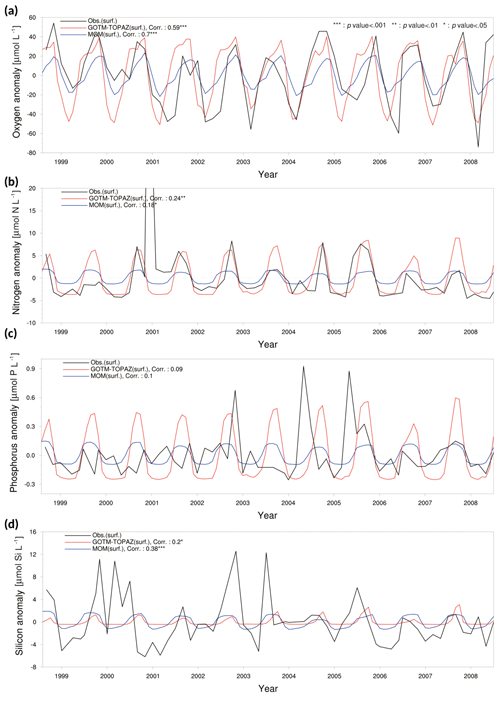
Figure 7Anomaly time series and correlation values from observational data (black lines), MOM results (blue lines), and GOTM–TOPAZ results (red lines) for concentrations of (a) dissolved oxygen, (b) nitrogen, (c) phosphorus, and (d) silicon at point 102 for the 10-year period of 1999–2008; in this figure, nitrogen, phosphorus, and silicon include NO3, PO4, and SIO4, respectively.
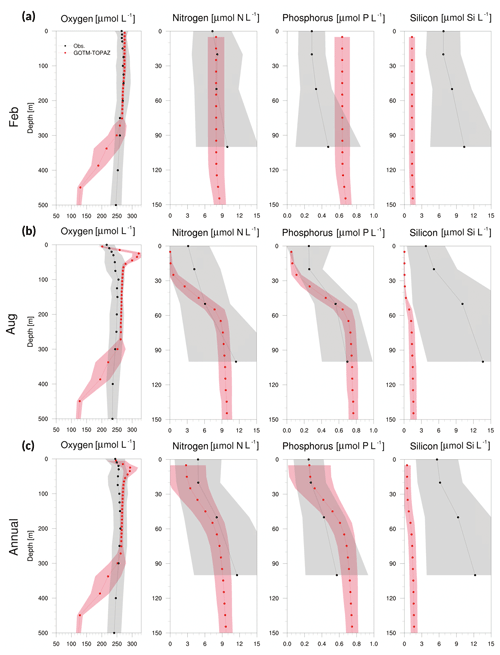
Figure 8Vertical profiles from observational data (black dots) and GOTM–TOPAZ results (red dots) at point 107 for concentrations of dissolved oxygen, nitrogen, phosphorus, and silicon averaged from 1999 to 2008, (a) for February, (b) for August, and (c) annually. The shaded areas represent 1σ. In this figure, nitrogen, phosphorus, and silicon include NO3, PO4, and SIO4, respectively.
Figures 8–10 show a comparison of the vertical profiles of dissolved oxygen, nitrogen, phosphorus, and silicon averaged for February, August, and the entire period from 1999 to 2008 at points 107, 104, and 102. Mixing in the upper ocean occurs actively during winter due to strong winds, and GOTM–TOPAZ simulated dissolved oxygen (surface to 250 m) and nitrogen (surface to 100 m) concentrations well during that season (Figs. 8–10a). However, for phosphorus and silicon at the same depths, there was a difference between the GOTM–TOPAZ results and the observational data. In the case of all points, the concentrations of nitrogen, phosphorus, and silicon simulated by GOTM–TOPAZ from the surface to 60 m decreased during August, and these concentrations were clearly distinguishable from each depth due to strong stratification in the summer (Figs. 8–10b). These stratifications appeared in the observational data. During this season, the oxygen concentration simulated by GOTM–TOPAZ increased sharply from depths of 20–60 m at points 107, 104, and 102 (Figs. 8–10b). This seems to have been caused by the creation of oxygen from photosynthesis by phytoplankton. However, a highly concentrated dissolved oxygen concentration is not apparent in the observational data because the warm water, which is characterized by low dissolved oxygen, is transported by the EKWC during the summer season (Rho et al., 2012). The concentrations of dissolved oxygen from 80 to 250 m at point 107 were similar in both the results from GOTM–TOPAZ and in the 10-year observational data (Fig. 8c). However, the differences increased beyond depths of 250 m. Nonetheless, the results demonstrated that dissolved oxygen at 80–250 m, nitrogen, and phosphorus (but not silicon) are well simulated over 10 years using GOTM–TOPAZ (Fig. 8c). The vertical distributions of dissolved oxygen and nutrients at points 104 and 102 as simulated by GOTM–TOPAZ over the same time period also showed similar patterns as those at point 107 (Figs. 9–10).
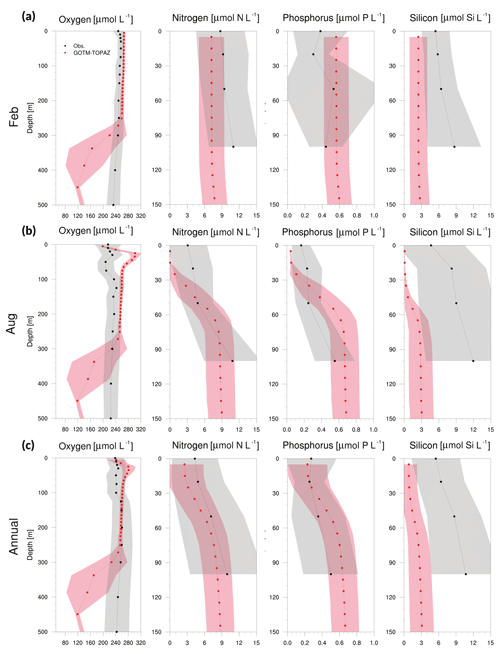
Figure 9Vertical profiles from observational data (black dots) and GOTM–TOPAZ results (red dots) at point 104 for concentrations of dissolved oxygen, nitrogen, phosphorus, and silicon averaged from 1999 to 2008, (a) for February, (b) for August, and (c) annually. The shaded areas represent 1σ. In this figure, nitrogen, phosphorus, and silicon include NO3, PO4, and SIO4, respectively.
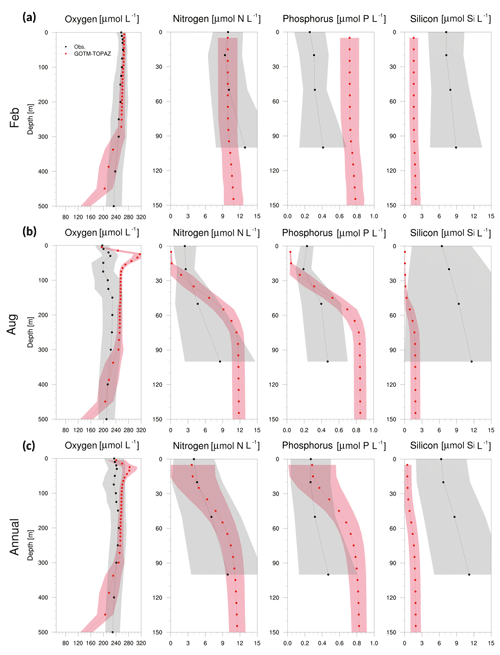
Figure 10Vertical profiles from observational data (black dots) and GOTM–TOPAZ results (red dots) at point 102 for concentrations of dissolved oxygen, nitrogen, phosphorus, and silicon averaged from 1999 to 2008, (a) for February, (b) for August, and (c) annually. The shaded areas represent 1σ. In this figure, nitrogen, phosphorus, and silicon include NO3, PO4, and SIO4, respectively.
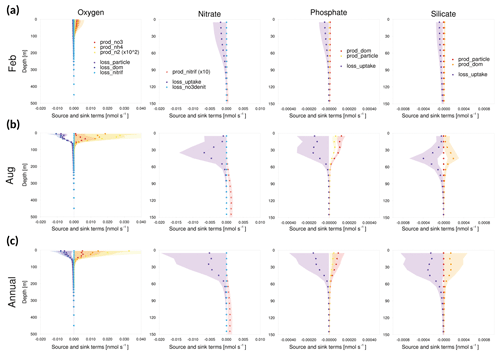
Figure 11Vertical profiles of the tendencies of source and sink terms in GOTM–TOPAZ at point 107 for the 10-year period of 1999–2008, (a) for February, (b) for August, and (c) annually. The shaded areas represent 1σ.
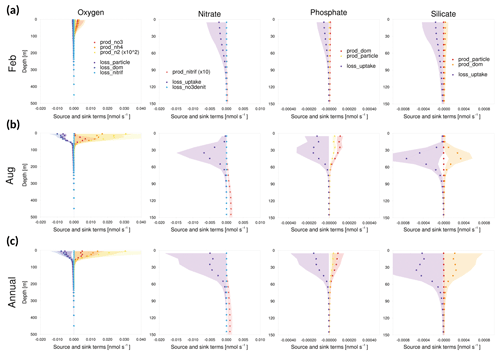
Figure 12Vertical profiles of the tendencies of source and sink terms in GOTM–TOPAZ at point 104 for the 10-year period of 1999–2008, (a) for February, (b) for August, and (c) annually. The shaded areas represent 1σ.
In addition, the magnitudes of the source and sink terms of GOTM–TOPAZ were analyzed. When TOPAZ was implemented three-dimensionally by being coupled with MOM, the concentration of tracers was calculated through advection–diffusion processes as well as source–sink processes. Conversely, in the case of GOTM–TOPAZ, which is a SCM, GOTM-TOPAZ determined the tendency of state variables through vertical diffusion and source and sink terms without considering advection and horizontal diffusion. At every point, the bias of dissolved oxygen seemed to be larger in summer than in winter, where the vertical diffusion is stronger. Since there was also a bias in the deep sea (<250 m), we focused on source and sink terms rather than on vertical diffusion. Figures 11–13 show 10-year (1999–2008) average source and sink terms of nutrients (nitrate, phosphate, silicate) and dissolved oxygen. The production of dissolved oxygen is attributable to nitrate, ammonia, and nitrogen fixation, while its loss occurs in the production of NH4 from non-sinking particles, sinking particles, and dissolved organic matter and nitrification. The production of nitrate is caused by nitrification, and its loss is determined by denitrification and uptake by phytoplankton. In the phosphate and silicate, the production is attributable to dissolved organic matter and particles, and the loss is determined by uptake due to phytoplankton (Dunne et al., 2012b).
As shown in Figs. 11–13, the source and sink of dissolved oxygen and nutrients occurred mainly in the surface layer (<60 m), and their influence seemed to be negligible at deeper depths. The source of dissolved oxygen was remarkable in the surface layer during summer because phytoplankton flourishes in summer. This pattern was commonly observed at all three points. The surface layer of point 102, which is the southernmost point, showed more production (consumption) of dissolved oxygen (nutrients) than did the other points in winter. Being located at the southernmost location, point 102 was greatly affected by the warm current (EKWC), which resulted in flourishing phytoplankton. However, even at this point, the source and sink of both the dissolved oxygen and nutrients made few contributions at 250 m or deeper.
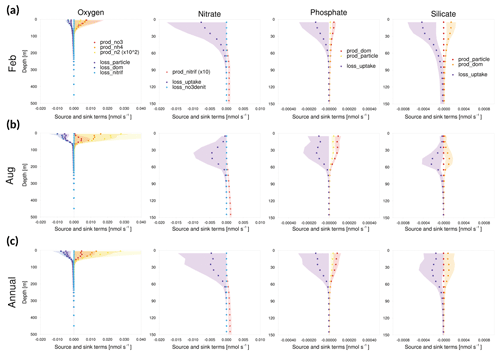
Figure 13Vertical profiles of the tendencies of source and sink terms in GOTM–TOPAZ at point 102 for the 10-year period of 1999–2008, (a) for February, (b) for August, and (c) annually. The shaded areas represent 1σ.
Accordingly, it could be inferred that the simulation of biogeochemical variables in the deep sea (<250 m) would be more affected by initial values than by source or sink. In order to verify this assumption, the model was simulated by setting the initial data as the observations. The results indicated that the bias of dissolved oxygen was significantly reduced in the deep sea (Fig. 14). This result indicates that tracers simulated by GOTM–TOPAZ greatly depend on source–sink processes in the surface layer (<60 m) and are sensitive to initial values in the deep sea.
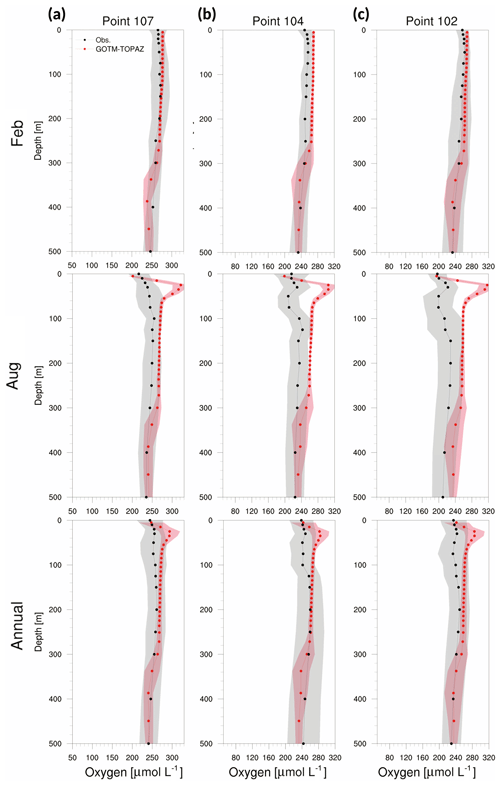
Figure 14Vertical profiles from observations (black dots) and GOTM–TOPAZ results (red dots) for concentrations of dissolved oxygen averaged from 1999 to 2008, (a) for point 107, (b) for point 104, and (c) for point 102. GOTM–TOPAZ is simulated by prescribing observations for the initial data. The shaded areas represent 1σ.
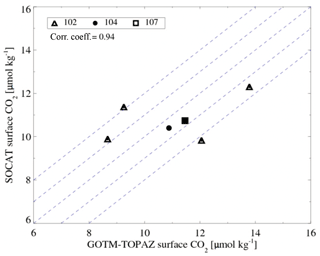
Finally, to verify the air–sea gas exchange simulated by GOTM–TOPAZ, we compared the monthly average sea surface CO2 concentrations in the model and in SOCAT. The correlation coefficient between the sea surface CO2 concentration simulated by GOTM–TOPAZ and the observational data was 0.94 (Fig. 15). However, there were no more than 6 months for which the observational values existed at all points; therefore, this is a statistically insignificant value.
In this paper, we explain the major models that comprise GOTM–TOPAZ and the biological–physical feedback loop that they reproduce. In addition, we compiled data from three points of scientific importance in the Sea of Japan, near the Korean Peninsula, and analyzed the results of operating GOTM–TOPAZ for a decade (∼1999–2008). We compared ocean water temperatures, salinity, and biogeochemical variables such as chlorophyll, dissolved oxygen, nitrogen, phosphorus, and silicon concentrations against the observational data and output from the OGCM to evaluate the performance of GOTM–TOPAZ. The results showed that GOTM–TOPAZ had lower correlation coefficients than did OGCM but that it simulated seasonal variability in a similar manner overall. In addition, we analyzed the magnitudes of the source–sink terms for dissolved oxygen and nutrients, which were simulated by GOTM–TOPAZ. This analysis revealed the characteristics of the model and the cause of the bias, which was shown in the vertical profile of dissolved oxygen. Consequently, GOTM–TOPAZ is mainly affected by source–sink terms in the surface layer (<60 m) and is sensitive to initial values in the deep sea (>250 m). Future users of GOTM–TOPAZ need to consider such characteristics when designing an experiment.
The SCM (1-D model) includes important physical processes and has a much lower computation cost than do the 3-D models; this means that a variety of experiments can be performed repeatedly. With this advantage, 1-D models can be useful to track mechanisms that are difficult to understand using 3-D models. We believe that TOPAZ, in particular, can be used to obtain insights into the interactions between the chemical makeup and organisms in the ocean because it accounts for complex biogeochemical mechanisms. In addition, the key processes which are studied via TOPAZ can later be implemented into 3-D models.
A variety of single-column ocean biogeochemical models have already been developed. However, GOTM–TOPAZ includes complex biogeochemical processes and models over 30 kinds of tracers; the other models, which have only simple structures, do not (Dunne et al., 2012b). Furthermore, GOTM–TOPAZ considers the gas transfer caused by changes in the atmosphere and the physical environment of the ocean, depicting the deposition of dissolved iron, lithogenic aluminosilicate, NH4, and NO3 due to aerosols. We believe that the sophistication of TOPAZ provides researchers with the opportunity to perform a variety of experiments.
For example, aerosol concentrations are continuously increasing over the East Asia region and are known to affect precipitation and atmospheric circulation. Thus, there is a possibility that aerosols affect oceanic biogeochemical processes as deposition occurs into the ocean, and this cannot be ignored. A variety of numerical experiments are necessary to understand this process, but they are difficult to perform using 3-D models due to limitations in computing resources. However, as previously noted, GOTM–TOPAZ is fast; as such, it is useful for understanding the biogeochemical changes that occur in the ocean when the concentration of aerosols or CO2 in the atmosphere changes. In addition, recent studies have reported that the distribution of fisheries is changing due to changes in phytoplankton size structure caused by the upwelling intensity on the coast of the Sea of Japan (Shin et al., 2017). The TOPAZ phytoplankton are divided into two types depending on their size, which should prove to be useful in this type of future research.
In addition, GOTM–TOPAZ can be used in studies on feedback mechanisms in the biogeochemical and physical environment of the ocean. Sonntag and Hense (2011) used a simple biogeochemistry model linked to GOTM (GOTM–BIO) to analyze the effects of phytoplankton on the physical environment of the upper ocean. The feedback from cyanobacteria, particularly during surface blooms that cause changes in ocean surface albedo, the solar light absorption rate, and the momentum relayed to the ocean by wind, were applied to the model during the experiment. Sonntag and Hense (2011) provided us a better understanding of the needs and direction to focus on with GOTM–TOPAZ, and we plan to apply various climate–ocean biogeochemistry feedback mechanisms to it in future research. We also plan to evolve GOTM–TOPAZ into a single ESM by coupling an atmospheric SCM and a model that reproduces atmospheric chemical mechanisms with GOTM–TOPAZ.
We separated TOPAZ from MOM and constructed a model with separate initiation and column physics modules, thus introducing the possibility of more easily coupling it with various other ocean models in the future. We are currently conducting a study on coupling TOPAZ with the Nucleus for European Modelling of the Ocean (NEMO), another OGCM that is already coupled with other biogeochemistry models, such as MEDUSA (Yool et al., 2013) and PISCES (Aumont et al., 2015). If NEMO and TOPAZ can be coupled successfully, a comparative analysis of the simulation results from the each biogeochemistry model might provide the driving force for improving the modeling of physical processes associated with ocean biogeochemistry.
The GOTM–TOPAZ software is based on GOTM version 4 and MOM version 5, both available for download from their respective distribution sites (https://gotm.net, last access: 22 November 2018, https://www.gfdl.noaa.gov/, last access: 22 November 2018). GOTM–TOPAZ is freely available at https://doi.org/10.5281/zenodo.1405270 (Jung and Moon, 2018).
| Abbreviation | Full form |
| ESM | Earth system model |
| SCM | Single-column model |
| OGCMs | Ocean global circulation models |
| CMIP5 | Coupled Model Intercomparison Project Phase 5 |
| GFDL | Geophysical Fluid Dynamics Laboratory |
| ARCCSS | Australian Research Council Centre of Excellence for Climate System Science |
| NIFS | National Institute of Fisheries Science |
| ESM2M | Earth System Model version 2, with Modular Ocean Model version 4.1 |
| ESM2G | Earth System Model version 2, with General Ocean Layer Dynamics |
| ECMWF | European Centre for Medium-Range Weather Forecasts |
| GOTM | General Ocean Turbulence Model |
| TOPAZ | Tracers of Phytoplankton with Allometric Zooplankton |
| MOM5 | Modular Ocean Model version 5 |
| NEMO | Nucleus for European Modelling of the Ocean |
| MEDUSA | Model of Ecosystem Dynamics, Nutrients Utilization, Sequestration and Acidification |
| PISCES | Pelagic Interactions Scheme for Carbon and Ecosystem Studies |
| SOCAT | Surface Ocean CO2 Atlas |
| SeaWiFS | Sea-viewing Wide Field-of-view Sensor |
| CORE-II | Coordinated Ocean-ice Reference Experiments II |
| PAR | Photosynthetically active radiation |
| TWC | Tsushima Warm Current |
| EKWC | East Korean Warm Current |
| NKCC | North Korean Cold Current |
| NB | Nearshore branch |
| OB | Offshore branch |
| ESIW | East Sea Intermediate Water |
HCJ and BKM drafted the paper, performed the experiments, and were primarily responsible for developing GOTM–TOPAZ. JW, HSP, JL, and YHB contributed to code debugging and writing the paper.
The authors declare that they have no conflict of interest.
We would like to thank the GOTM and MOM communities for their support. In
addition, we would like to thank the European Centre for Medium-Range Weather
Forecasts for providing ERA-Interim data and the Hadley Centre at the Met
Office for providing the EN4 datasets. In addition, we would like to thank
the National Institute of Fisheries Science for providing ocean observation
data and the NASA Goddard Space Flight Center for providing SeaWiFS datasets.
We also thank Daehyuk Kim
at Kongju National University of Korea for providing
some advice during this research. We appreciate Jin-Ho Choi and Han-Kyoung Kim
at Chonbuk National University of Korea for their helpful discussion and
comments. This work was funded by the Korea Meteorological Administration
Research and Development Program under grant KMI
(KMI2018-03513).
Edited by: Paul Halloran
Reviewed by: two anonymous referees
Aumont, O., Ethé, C., Tagliabue, A., Bopp, L., and Gehlen, M.: PISCES-v2: an ocean biogeochemical model for carbon and ecosystem studies, Geosci. Model Dev., 8, 2465–2513, https://doi.org/10.5194/gmd-8-2465-2015, 2015.
Azhar, M. A., Canfield, D. E., Fennel, K., Thamdrup, B., and Bjerrum, C. J.: A model-based insight into the coupling of nitrogen and sulphur cycles in a coastal upwelling system, J. Geophys. Res.-Biogeo., 119, 264–285, https://doi.org/10.1002/2012JG002271, 2014.
Bakker, D. C. E., Pfeil, B., Landa, C. S., Metzl, N., O'Brien, K. M., Olsen, A., Smith, K., Cosca, C., Harasawa, S., Jones, S. D., Nakaoka, S.-I., Nojiri, Y., Schuster, U., Steinhoff, T., Sweeney, C., Takahashi, T., Tilbrook, B., Wada, C., Wanninkhof, R., Alin, S. R., Balestrini, C. F., Barbero, L., Bates, N. R., Bianchi, A. A., Bonou, F., Boutin, J., Bozec, Y., Burger, E. F., Cai, W.-J., Castle, R. D., Chen, L., Chierici, M., Currie, K., Evans, W., Featherstone, C., Feely, R. A., Fransson, A., Goyet, C., Greenwood, N., Gregor, L., Hankin, S., Hardman-Mountford, N. J., Harlay, J., Hauck, J., Hoppema, M., Humphreys, M. P., Hunt, C. W., Huss, B., Ibánhez, J. S. P., Johannessen, T., Keeling, R., Kitidis, V., Körtzinger, A., Kozyr, A., Krasakopoulou, E., Kuwata, A., Landschützer, P., Lauvset, S. K., LefÈ vre, N., Lo Monaco, C., Manke, A., Mathis, J. T., Merlivat, L., Millero, F. J., Monteiro, P. M. S., Munro, D. R., Murata, A., Newberger, T., Omar, A. M., Ono, T., Paterson, K., Pearce, D., Pierrot, D., Robbins, L. L., Saito, S., Salisbury, J., Schlitzer, R., Schneider, B., Schweitzer, R., Sieger, R., Skjelvan, I., Sullivan, K. F., Sutherland, S. C., Sutton, A. J., Tadokoro, K., Telszewski, M., Tuma, M., van Heuven, S. M. A. C., Vandemark, D., Ward, B., Watson, A. J., and Xu, S.: A multi-decade record of high-quality fCO2 data in version 3 of the Surface Ocean CO2 Atlas (SOCAT), Earth Syst. Sci. Data, 8, 383–413, https://doi.org/10.5194/essd-8-383-2016, 2016.
Betts, A. K. and Miller, M. J.: A new convective adjustment scheme. Part II: Single column tests using GATE wave, BOMEX, ATEX and arctic air-mass data sets, Q. J. Roy. Meteor. Soc., 112, 693–709, https://doi.org/10.1002/qj.49711247308, 1986.
Bruggenman, J. and Bolding, K.: A general framework for aquatic biogeochemical models, Environ. Modell. Softw., 61, 249–265, https://doi.org/10.1016/j.envsoft.2014.04.002, 2014.
Burchard, H., Bolding, K., Kuhn, W., Meister, A., Neumann, T., and Umlauf, L.: Description of a flexible and extendable physical-biogeochemical model system for the water column, J. Marine Syst., 61, 180–211, https://doi.org/10.1016/j.jmarsys.2005.04.011, 2006.
Cloern, J. E., Grenz, C., and Vidergar-Lucas, L.: An empirical model of the phytoplankton chlorophyll: carbon ratio-the conversion factor between productivity and growth rate, Limnol. Oceanogr., 40, 1313–1321, https://doi.org/10.4319/lo.1995.40.7.1313, 1995.
De Baar, H. J. W.: von Liebig's law of the minimum and plankton ecology (1899–1991), Progress. Oceanogr., 33, 347–386, 1994.
Dee, D. P., Uppala, S. M., Simmons, A. J., Berrisford, P., Poli, P., Kobayashi, S., Andrae, U., Balmaseda, M. A., Balsamo, G., Bauer, P., Bechtold, P., Beljaars, A. C. M., van de Berg, L., Bidlot, J., Bormann, N., Delsol, C., Dragani, R., Fuentes, M., Geer, A. J., Haimberger, L., Healy, S. B., Hersbach, H., Hólm, E. V., Isaksen, L., Kållberg, P., Köhler, M., Matricardi, M., McNally, A. P., Monge-Sanz, B. M., Morcrette, J.-J., Park, B.-K., Peubey, C., de Rosnay, P., Tavolato, C., Thépaut, J.-N., and Vitart, F.: The ERA-Interim reanalysis: configuration and performance of the data assimilation system, Q. J. Roy. Meteor. Soc., 137, 553–597, https://doi.org/10.1002/qj.828, 2011.
Dirmeyer, P. A., Cash, B. A., Kinter III, J. L., Stan, C., Jung, T., Marx, L., Towers, P., Wedi, N., Adams, J. M., Altshuler, E. L., Huang, B., Jin, E. K., and Manganello, J.: Evidence for enhanced land-atmosphere feedback in a warming climate, J. Hydrometeorol., 13, 981–995, https://doi.org/10.1175/JHM-D-11-0104.1, 2012.
Dunne, J. P., John, J. G., Adcroft, A. J., Griffies, S. M., Hallberg, R. W., Shevliakova, E. N., Stouffer, R. J., Cooke, W., Dunne, K. A., Harrison, M. J., Krasting, J. P., Malyshev, S. L., Milly, P. C. D., Phillipps, P. J., Sentman, L. A., Samuels, B. L., Spelman, M. J., Winton, M., Wittenberg, A. T., and Zadeh, N.: GFDL's ESM2 global coupled climate-carbon Earth System Models Part I: Physical formulation and baseline simulation characteristics, J. Climate, 25, 6646–6665, https://doi.org/10.1175/JCLI-D-11-00560.1, 2012a.
Dunne, J. P., John, J. G., Shevliakova, E., Stouffer, R. J., Krasting, J. P., Malyshev, S. L., Milly, P. C. D, Sentman, L. T., Adcroft, A. J., Cooke, W., Dunne, K. A., Griffies, S. M., Hallberg, R. W., Harrison, M. J., Levy, H., Wittenberg, A. T., Phillips, P. J., and Zadeh, N.: GFDL's ESM2 global coupled climate–carbon earth system models. Part II: carbon system formulation and baseline simulation characteristics, J. Climate, 26, 2247–2267, https://doi.org/10.1175/jcli-d-12-00150.1, 2012b.
Evans, T. and Garçon, V.: One-Dimensional Models of Water Column Biogeochemistry; Report of a Workshop held in Toulouse, France, November–December 1995, 1997.
Friedlingstein, P., Cox, P., Betts, R., Bopp, L., von Bloh, W., Brovkin, V., Cadule, P., Doney, S., Eby, M., Fung, I., Bala, G., John, J., Jones, C., Joos, F., Kato, T., Kawamiya, M., Knorr, W., Lindsay, K., Matthews, H. D., Raddatz, T., Rayner, P., Reick, C., Roeckner, E., Schnitzler, K. G., Schnur, R., Strassmann, K., Weaver, A. J., Yoshikawa, C., and Zeng, N.: Climate-Carbon Cycle Feedback Analysis: Results from the C4MIP Model Intercomparison, J. Climate, 19, 3337–3353, https://doi.org/10.1175/JCLI3800.1, 2006.
Good, S. A., Martin, M. J., and Rayner, N. A.: EN4: Quality controlled ocean temperature and salinity profiles and monthly objective analyses with uncertainty estimates, J. Geophys. Res.-Oceans, 118, 6704–6716, https://doi.org/10.1002/2013JC009067, 2013.
Gouretski, V. and Reseghetti, F.: On depth and temperature biases in bathythermograph data: development of a new correction scheme based on analysis of a global ocean database, Deep-Sea Res. Pt. I, 57, 812–833, https://doi.org/10.1016/j.dsr.2010.03.011, 2010.
Hartung, K., Svensson, G., Struthers, H., Deppenmeier, A.-L., and Hazeleger, W.: An EC-Earth coupled atmosphere–ocean single-column model (AOSCM.v1_EC-Earth3) for studying coupled marine and polar processes, Geosci. Model Dev., 11, 4117–4137, https://doi.org/10.5194/gmd-11-4117-2018, 2018.
Hense, I., Stemmler, I., and Sonntag, S.: Ideas and perspectives: climate-relevant marine biologically driven mechanisms in Earth system models, Biogeosciences, 14, 403–413, https://doi.org/10.5194/bg-14-403-2017, 2017.
Ichiye, T. (Ed.): Some problem of circulation and hydrography of the Japan Sea and Tsushima Current, in: Ocean Hydrography of the Japan Sea and China Seas, Elsevier Science Publishers, Amsterdam, 15–54, 1984.
Jochum, M., Yeager, S., Lindsay, K., Moore, K., and Murtugudde, R.: Quantification of the Feedback between Phytoplankton and ENSO in the Community Climate System Model, J. Climate, 23, 2916–2925, https://doi.org/10.1175/2010JCLI3254.1, 2009.
Jones, C. and Sellar, A.: Development of the 1st version of the UK Earth system model, UKESM newsletter no. 1 – August 2015, available at: https://ukesm.ac.uk/ukesm-newsletter-no-1-august-2015/ (last access: 4 November 2018), 2015.
Joo, H. T., Park, J. W., Son, S. H., Noh, J.–H., Jeong, J.-Y., Kwak, J. H., Saux-Picart, S., Choi, J. H., Kang, C.-K., and Lee, S. H.: Long-term annual primary production in the Ulleung Basin as a biological hot spot in the East/Japan Sea, J. Geophys. Res.-Oceans, 119, 3002–3011, https://doi.org/10.1002/2014JC009862, 2014.
Jung, H.-C. and Moon, B.-K., GOTM-TOPAZ (Version 1.0), Zenodo, https://doi.org/10.5281/zenodo.1405270, 2018.
Kawabe, M.: Branching of the Tsushima Current in the Japan Sea. Part II: Numerical experiment, J. Oceanogr. Soc. Jpn., 38, 183–192, https://doi.org/10.1007/BF02111101, 1982.
Kim, D.-W., Jo, Y.-H., Choi, J.-K., Choi, J.-G., and Bi, H.: Physical processes leading to the development of an anomalously large Cochlodinium polykrikoides bloom in the East sea/Japan sea, Harmful Algae, 55, 250–258, https://doi.org/10.1016/j.hal.2016.03.019, 2016.
Kim, K. and Chung, J. Y.: On the Salinity-Minimum and Dissolved Oxygen-Maximum Layer in the East Sea (Sea Of Japan), Elsevier Oceanogr. Ser., 39, 55–65, https://doi.org/10.1016/S0422-9894(08)70290-3, 1984.
Kim, Y.-G. and Kim, K.: Intermediate Waters in the East/Japan Sea, J. Oceanogr., 55, 123–132, https://doi.org/10.1023/A:1007877610531, 1999.
Krezel, A., Szymanek, L., Kozlowski, L., and Szymelfenig, M.: Influence of coastal upwelling on chlorophyll a concentration in the surface water along the Polish coast of the Baltic Sea, Oceanologia, 47, 433–452, 2005.
Large, W. G. and Yeager, S. G.: The global climatology of an interannually varying air-sea flux data set, Clim. Dynam., 33, 341–364, https://doi.org/10.1007/s00382-008-0441-3, 2009.
Lebassi-Habtezion, B. and Caldwell, P. M.: Aerosol specification in single-column Community Atmosphere Model version 5, Geosci. Model Dev., 8, 817–828, https://doi.org/10.5194/gmd-8-817-2015, 2015.
Lim, H.-G., Park, J.-Y., and Kug, J.-S.: Impact of chlorophyll bias on the tropical Pacific mean climate in an earth system model, Clim. Dynam., 51, 2681–2694, https://doi.org/10.1007/s00382-017-4036-8, 2017.
Lips, I. and Lips, U.: Phytoplankton dynamics effected by the coastal upwelling events in the Gulf of Finland in July–August 2006, J. Plankton Res., 32, 1269–1282, https://doi.org/10.1093/plankt/fbq049, 2010.
Litchman, E., Pinto, P. T., Edwards, K. F., Klausmeier, C. A., Kremer, C. T., and Thomas M. K.: Global biogeochemical impacts of phytoplankton: a trait-based perspective, J. Ecol., 103, 1384–1396, https://doi.org/10.1111/1365-2745.12438, 2015.
Manizza, M., Le Quéré, C., Watson, A. J., and Buitenhuis, E. T.: Bio-optical feedbacks among phytoplankton, upper ocean physics and sea-ice in a global model, Geophys. Res. Lett., 32, L05603, https://doi.org/10.1029/2004GL020778, 2005.
McClain, C. R., Cleave, M. L., Feldman, G. C., Gregg, W. W., Hooker, S. B., and Kuring, N.: Science quality seawifs data for global biosphere research, Sea Technol., 39, 10–16, 1998.
Morel, A. and Antoine, D.: Heating rate within the upper ocean in relation to its Bio-Optical state, J. Phys. Oceanogr., 24, 1652–1665, https://doi.org/10.1175/1520-0485(1994)024<1652:HRWTUO>2.0.CO;2, 1994.
Moriyasu, S.: The Tsushima Current. Kuroshio, Its Physical Aspects, 353–369 pp., 1972.
Najjar, R. and Orr, J. C.: Design of OCMIP-2 simulations of chlorofluorocarbons, the solubility pump and common biogeochemistry, Internal report of the Ocean Carbon-Cycle Model Intercomparison Project (OCMIP), 25 pp., LSCE/CEA Saclay, Gif-sur-Yvette, France, 1998.
Park, J.-Y., Dunne, J. P., and Stock, C. A.: Ocean chlorophyll as a precursor of ENSO: An Earth system modeling study, Geophys. Res. Lett., 45, 1939–1947, https://doi.org/10.1002/2017GL076077, 2018.
Park, J.-Y., Kug, J.-S., Seo, H., and Bader, J.: Impact of bio-physical feedbacks on the tropical climate in coupled and uncoupled GCMs, Clim. Dynam., 43, 1811–1827, https://doi.org/10.1007/s00382-013-2009-0, 2013.
Price, J. F., Weller, R. A., and Pinkel, R.: Diurnal cycling: Observations and models of the upper ocean response to diurnal heating, cooling, and wind mixing, J. Geophys. Res.-Oceans, 91, 8411–8427, https://doi.org/10.1029/JC091iC07p08411, 1986.
Randerson, J. T., Lindsay, K., Munoz, E., Fu, W., Moore, J. K., Hoffman, F. M., Mahowald, N. M., and Doney, S. C.: Multicentury changes in ocean and land contributions to the climate-carbon feedback, Global Biogeochem. Cy., 29, 744–759, https://doi.org/10.1002/2014GB005079, 2015.
Redfield, A. C., Ketchum, B. H., and Richards, F.: The influence of organisms on the composition of sea water, in: The Sea, edited by: Hill, M. N., Wiley-Interscience, New York, 2, 26–77, 1963.
Rho, T., Lee, T., Kim, G., Chang, K.-I., Na, T., and Kim, K.-R.: Prevailing Subsurface Chlorophyll Maximum (SCM) Layer in the East Sea and Its Relation to the Physico-Chemical Properties of Water Masses, Ocean Polar Res., 34, 413–430, https://doi.org/10.4217/OPR.2012.34.4.413, 2012 (in Korean).
Sauerland, V., Löptien, U., Leonhard, C., Oschlies, A., and Srivastav, A.: Error assessment of biogeochemical models by lower bound methods (NOMMA-1.0), Geosci. Model Dev., 11, 1181–1198, https://doi.org/10.5194/gmd-11-1181-2018, 2018.
Shimomura, T. and Miyata, K. The oceanographical conditions of the Japan sea and its water systems, laying stress on the summer of 1955, Bull. Japan Sea Reg. Fish. Res. Lab., 6, 23–97, 1957 (in Japanese).
Shin, J.-W., Park, J., Choi, J.-G., Jo, Y.-H., Kang, J. J., Joo, H. T., and Lee, S. H.: Variability of phytoplankton size structure in response to changes in coastal upwelling intensity in the southwestern East Sea, J. Geophys. Res.-Oceans, 122, 10262–10274, https://doi.org/10.1002/2017JC013467, 2017.
Soden, B. J. and Held, I. M.: An assessment of Climate Feedbacks in Coupled Ocean-Atmosphere Models, J. Climate, 19, 3354, https://doi.org/10.1175/JCLI3799.1, 2006.
Sokolov, A., Kicklighter, D., Schlosser, C. A., Wang, C., Monier, E., Brown-Steiner, B., Prinn, R., Forest, C., Gao, X., Libardoni, A., and Eastham, S.: Description and Evaluation of the MIT Earth System Model (MESH), J. Adv. Model. Earth Sy., 10, 1759–1789, https://doi.org/10.1029/2018MS001277, 2018.
Sonntag, S. and Hense, I.: Phytoplankton behavior affects ocean mixed layer dynamics through biological-physical feedback mechanisms, Geophys. Res. Lett., 38, L15610, https://doi.org/10.1029/2011GL048205, 2011.
Stock C. A., Dunne, J. P., and John, J. G.: Global-scale carbon and energy flows through the marine planktonic food web: an analysis with a coupled physical–biological model, Prog. Oceanogr., 120, 1–28, https://doi.org/10.1016/j.pocean.2013.07.001, 2014.
Tanioka, K.: On the Eastern Korea Warm Current (Tosen Warm Current), Oceanogr. Mag., 20, 31–38, 1968.
Uda, M.: The results of simultaneous oceanographical investigations in the Japan Sea and its adjacent waters in May and June 1932, J. Imp. Fisher. Exp. St., 5, 57–190, 1934 (in Japanese).
Umlauf, L. and Burchard, H.: A generic length-scale equation for geophysical turbulence models, J. Mar. Res. 61, 235–265, https://doi.org/10.1357/002224003322005087, 2003.
Umlauf, L. and Burchard, H.: Second-order turbulence closure models for geophysical boundary layers. A review of recent work, Cont. Shelf Res., 25, 795–827, https://doi.org/10.1016/j.csr.2004.08.004, 2005.
Umlauf, L., Burchard, H., and Bolding, K.: General Ocean Turbulence Model. Scientific documentation. v3.2. Marine Science Reports no. 63, Baltic Sea Research Institute Warnemünde, 274 pp., Warnemünde, Germany, 2005.
Wanninkhof, R.: Relationship between wind speed and gas exchange over the ocean, J. Geophys. Res., 97, 7373–7382, https://doi.org/10.1029/92JC00188, 1992.
Yool, A., Popova, E. E., and Anderson, T. R.: MEDUSA-2.0: an intermediate complexity biogeochemical model of the marine carbon cycle for climate change and ocean acidification studies, Geosci. Model Dev., 6, 1767–1811, https://doi.org/10.5194/gmd-6-1767-2013, 2013.
- Abstract
- Introduction
- The physical ocean model: General Ocean Turbulence Model (GOTM)
- The ocean biogeochemistry model: Tracers of Phytoplankton with Allometric Zooplankton (TOPAZ)
- The ocean biogeochemistry coupled model: GOTM–TOPAZ
- Experimental setup
- Results
- Discussion
- Code and data availability
- Appendix A: List of abbreviations
- Author contributions
- Competing interests
- Acknowledgements
- References


