the Creative Commons Attribution 4.0 License.
the Creative Commons Attribution 4.0 License.
EcoGEnIE 1.0: plankton ecology in the cGEnIE Earth system model
Ben A. Ward
Jamie D. Wilson
Ros M. Death
Fanny M. Monteiro
Andrew Yool
Andy Ridgwell
We present an extension to the carbon-centric Grid Enabled Integrated Earth system model (cGEnIE) that explicitly accounts for the growth and interaction of an arbitrary number of plankton species. The new package (ECOGEM) replaces the implicit, flux-based parameterisation of the plankton community currently employed, with explicitly resolved plankton populations and ecological dynamics. In ECOGEM, any number of plankton species, with ecophysiological traits (e.g. growth and grazing rates) assigned according to organism size and functional group (e.g. phytoplankton and zooplankton) can be incorporated at runtime. We illustrate the capability of the marine ecology enabled Earth system model (EcoGEnIE) by comparing results from one configuration of ECOGEM (with eight generic phytoplankton and zooplankton size classes) to climatological and seasonal observations. We find that the new ecological components of the model show reasonable agreement with both global-scale climatological and local-scale seasonal data. We also compare EcoGEnIE results to the existing biogeochemical incarnation of cGEnIE. We find that the resulting global-scale distributions of phosphate, iron, dissolved inorganic carbon, alkalinity, and oxygen are similar for both iterations of the model. A slight deterioration in some fields in EcoGEnIE (relative to the data) is observed, although we make no attempt to re-tune the overall marine cycling of carbon and nutrients here. The increased capabilities of EcoGEnIE in this regard will enable future exploration of the ecological community on much longer timescales than have previously been examined in global ocean ecosystem models and particularly for past climates and global biogeochemical cycles.
- Article
(8055 KB) - Full-text XML
- BibTeX
- EndNote
The marine ecosystem is an integral component of the Earth system and its dynamics. Photosynthetic plankton ultimately support almost all life in the ocean, including the fish stocks that provide essential nutrition to more than half the human population (Hollowed et al., 2013). In addition, the marine biota determine an important downward flux of carbon, known as the “biological pump”. This flux arises as biomass generated by photosynthesis in the well-lit ocean surface sinks into the dark ocean interior, where it is remineralised (e.g. Hülse et al., 2017). Modulated by the activity and composition of marine ecosystems, the biological pump increases the partial pressure of CO2 at depth and decreases it in the ocean surface and atmosphere, and thus plays a key role in the regulation of Earth's climate. For instance, the existence of the biological carbon pump has been estimated to be responsible for an approximately 200 ppm decrease in atmospheric carbon concentration at steady state (Parekh et al., 2006), with variations in its magnitude being cited as playing a key role in, for example, the late Quaternary glacial–interglacial climate oscillations (Watson et al., 2000; Hain et al., 2014).
A variety of different marine biogeochemical modelling approaches has been developed in an attempt to understand how the marine carbon cycle functions and its dynamical interaction with climate, and to make both past and future projections. In the simplest of these approaches, the biological pump is incorporated into an ocean circulation (or box) model without explicitly including any state variables for the biota. Such models have been described as models of “biogenically induced chemical fluxes” (rather than explicitly of the biology – and ecology – itself; Maier-Reimer, 1993). They vary considerably in complexity but can be broadly divided into two categories. In the first of these, “nutrient-restoring” models calculate the biological uptake of nutrients at any one point at the ocean surface as the flux required to maintain surface nutrient concentrations at observed values (e.g. Bacastow and Maier-Reimer, 1990; Najjar et al., 1992). The vertical flux is then remineralised at depth according to some attenuating profile, such as that of Martin et al. (1987). Within this framework, carbon export is typically calculated from the nutrient flux according to a fixed stoichiometric (“Redfield”) ratio (Redfield, 1934). In addition to the availability of a spatially explicit (in the case of ocean circulation models) observed surface ocean nutrient field, nutrient-restoring models inherently only require a single parameter – the restoring timescale – and even this parameter is not critical (as long as the timescale is sufficiently short that the model closely reproduces the observed nutrient concentrations). The simplicity of this approach lends itself to being able to focus on a very specific part of the ecosystem dynamics, namely the downward transport of organic matter, and was highly influential, particularly during the early days of marine biogeochemical model development and assessment of carbon uptake and transport dynamics (e.g. Marchal et al., 1998; Najjar et al., 1992). However, because this approach is based explicitly upon observed values (or modified observations), they are primarily only suitable for diagnostic and modern steady-state applications and are unable to model any deviations of nutrient cycling, and hence of climate, from the current ocean state.
More sophisticated models of biogenically induced chemical fluxes do away with a direct observational constraint and instead estimate the organic matter export term on the basis of limiting factors, such as temperature, light, and the availability of nutrients such as nitrogen, phosphorous, and iron – an approach we will here refer to as “nutrient limitation”. Models based on this approach (e.g. Bacastow and Maier-Reimer, 1990; Heinze et al., 1991; Archer and Johnson, 2000) were natural successors to the early nutrient-restoring models and could account for the influence of multiple limiting nutrients and even implicitly partition export between different functional types (Watson et al., 2000). Without entraining an explicit dependence on observed surface ocean nutrient distributions, these models also gain much more freedom and, with it, a degree of predictive capability. Additionally, other than plausible values for nutrient half-saturation constants, nutrient-limitation models make few assumptions that are specifically tied to modern observations and assume very little (if anything) about the particular organisms present. Hence, as long as one makes the assumption that the marine plankton that existed at some specific time in the past were physiologically similar, particularly in terms of fundamental nutrient requirements, there is no apparent reason why nutrient-limitation models will not be as applicable to much of the Phanerozoic in terms of geological past, as they are to the present (questions of how suitable they might be to the present in the first place aside). Using nutrient-limitation flux schemes, marine biogeochemical cycles have hence already been simulated for periods such as the mid-Cretaceous (Monteiro et al., 2012) and end-Permian (Meyer et al., 2008), times for which surface nutrient distributions are not known a priori.
The disadvantage of both variants of models of biogenically induced chemical fluxes is that they are not able to represent interactions between parts of the ecosystem (e.g. resource competition and predator–prey interactions), simply because these components and processes are not resolved. Nor can they address questions involving the addition or loss, such as those associated with past extinction events, of plankton species and changes in ecosystem complexity and/or structure. They also suffer from being overly responsive to changes in nutrient availability. In the case of restoring models, this is simply because any change in the target field will be closely tracked. In the case of the nutrient-limitation models, the lack of an explicit biomass term results in export fluxes changing instantaneously in response to changing limiting factors. In the real world, by contrast, sufficient biomass must first exist, such as in a bloom condition, in order to achieve maximal export. This has consequences for how the seasonality of organic matter export is represented. Other restrictions include the inability to know anything about ecosystem size structure (and, by association, about particle sinking speed) or the degree of recycling at the ocean surface and hence the partitioning of carbon into dissolved vs. particulate phases in exported organic matter.
To allow models to respond to changes in ecosystem structure, and to incorporate some of the additional feedbacks and complexities that may be important in determining the future marine response to continued greenhouse gas emissions (Le Quéré et al., 2005), it has been necessary to explicitly resolve the ecosystem itself. Such models have been developed across a wide range of complexities (Kwiatkowski et al., 2014). Among the simplest are nutrient–phytoplankton–zooplankton–detritus (NPZD)-type models, resolving a single nutrient, homogenous phytoplankton and zooplankton communities, and a single detrital pool (Wroblewski et al., 1988; Oschlies, 2001). At the other end of the spectrum, more complex models may include multiple nutrients and several plankton functional types (PFTs) (e.g. Aumont et al., 2003; Moore et al., 2002; Le Quéré et al., 2005). What links these models is that the living state variables are very broadly based on ecological guilds (i.e. groups of organisms that exploit similar resources).
While simple NPZD models are capable of reproducing some of the observed variability in bulk properties such as chlorophyll biomass and primary production (Schartau and Oschlies, 2003b; Yool et al., 2013; Ward et al., 2013), their very simplicity precludes the representation of many potentially important biogeochemical processes and climate feedbacks. Additionally, NPZD models are parameterised to represent the activity of diverse plankton communities, with different parameter values being required as the ecosystem changes in space and time (Schartau and Oschlies, 2003a; Losa et al., 2006). In this regard, PFT models may be more generally applicable because they resolve relatively more fundamental ecological processes that may be less sensitive to environmental variability (Friedrichs et al., 2007). These are the key factors that have motivated the development of more complex models, in which the broad ecological guilds of NPZD models are replaced with more specific groups based on ecological and/or biogeochemical function (Aumont et al., 2015; Butenschön et al., 2016). It is argued that resolving more components of the ecosystem allows the representation of important climate feedbacks that cannot be accounted for in simpler models (Le Quéré, 2006).
However, alongside their advantages, the current generation of PFT models is faced with two important and conflicting challenges. Firstly, these complex models contain a large number of parameters that are often poorly constrained by observations (Anderson, 2005). Secondly, although PFT models resolve more ecological structure than the preceding generation of ocean ecosystem models, they are rarely general enough to perform well across large environmental gradients (Friedrichs et al., 2006, 2007; Ward et al., 2010). To these, one might add difficulties in their application to past climates. PFT models are based on a conceptual reduction of the modern marine ecosystem to its apparent key biogeochemical components, such as nitrogen fixation, or opal frustule production (as by diatoms). The role of diatoms and the attendant cycling of silica quickly become moot once one looks back in Earth history, as the origin of diatoms is thought to be sometime early in the Mesozoic (252–66 Ma), and they did not proliferate and diversify until later in the Cenozoic (66–0 Ma) (Falkowski et al., 2004). In addition, the physiological details of each species encoded in the model are taken directly from laboratory culture experiments of isolated strains (Le Quéré et al., 2005) creating a parameter dependence on modern cultured species, in addition to a structural one.
Recent studies have begun to address these issues by focusing on the more general rules that govern diversity (rather than by trying to quantify and parameterise the diversity itself). These “trait-based” models are beginning to be applied in the field of marine biogeochemical modelling (e.g. Follows et al., 2007; Bruggeman and Kooijman, 2007), with a major advantage being that they are able to resolve greater diversity with fewer specified parameters. One of the main challenges of this approach then is to identify the general rules or trade-offs that govern competition between organisms (Follows et al., 2007; Litchman et al., 2007). These trade-offs are often strongly constrained by organism size. A potentially large number of different plankton size classes can therefore be parameterised according to well-known allometric relationships linking plankton physiological traits to organism size (e.g. Tang, 1995; Hansen et al., 1997). This approach has the associated advantage that the size composition of the plankton community affects the biogeochemical function of the community (e.g. Guidi et al., 2009). If one assumes that the same allometric relationships and trade-offs are relatively invariant with time, then this approach provides a potential way forward to addressing geological questions.
In this paper, we present an adaptable modelling framework with an ecological structure that can be easily adapted according to the scientific question at hand. The model is formulated so that all plankton are described by the same set of equations, and any differences are simply a matter of parameterisation. Within this framework, each plankton population is characterised in terms of its size-dependent traits and its distinct functional type. The model also includes a realistic physiological component, based on a cell quota model (Caperon, 1968; Droop, 1968) and a dynamic photoacclimation model (Geider et al., 1998). This physiological component increases model realism by allowing phytoplankton to flexibly take up nutrients according to availability, rather than according to an unrealistically rigid cellular stoichiometry. Such flexible stoichiometry is rarely included in large-scale ocean models and provides the opportunity to study the links between plankton physiology, ecological competition, and biogeochemistry. This model is then embedded within the carbon-centric Grid Enabled Integrated Earth system model (cGEnIE) widely used in addressing questions of past climate and carbon cycling, and the overall properties of the model system are evaluated.
The structure of this paper is as follows. In Sect. 2, we will briefly outline the nature and properties of the cGEnIE Earth system model, focusing on the ocean circulation and marine biogeochemical modules most directly relevant to the simulation of marine ecology. In Sect. 3, we introduce the new ecological model – ECOGEM – that has been developed within the cGEnIE framework. Section 4 describes the preliminary experiments of ECOGEM, and Sect. 5 presents results from the new integrated ecological global model (EcoGEnIE) in comparison to observations (where available) as well as to the pre-existing biogeochemical simulation of cGEnIE.
GEnIE is an Earth system model of intermediate complexity (EMIC) (Claussen et al., 2002) and is based on a modular framework that allows different components of the Earth system, including ocean circulation, ocean biogeochemistry, deep-sea sediments, and geochemistry, to be incorporated (Lenton et al., 2007). The simplified atmosphere and carbon-centric version of GEnIE we use – cGEnIE – has been previously applied to explore and understand the interactions between biological productivity, biogeochemistry, and climate over a range of timescales and time periods (e.g. Ridgwell and Schmidt, 2010; Monteiro et al., 2012; Norris et al., 2013; John et al., 2014; Gibbs et al., 2015; Meyer et al., 2016; Tagliabue et al., 2016). As is common for EMICs, cGEnIE features a decreased spatial and temporal resolution in order to facilitate the efficient simulation of the various interacting components. This imposes limits on the resolution of ecosystem dynamics to large-scale annual/seasonal patterns in contrast to higher resolutions often used to model modern ecosystems. However, our motivation for incorporating a new marine ecosystem module into cGEnIE is to focus on the explicit interactions between ecosystems, biogeochemistry, and climate that are computationally prohibitive in higher-resolution models. In other words, our motivation is to include and explore a more complete range of interactions and dynamics within the marine system, at the expense of spatial fidelity and with the intention to explore long timescale and paleoceanographic questions, rather than short-term and future anthropogenic concerns.
2.1 Ocean physics and climate model component – C-GOLDSTEIN
The fast climate model, C-GOLDSTEIN features a reduced physics (frictional geostrophic) 3-D ocean circulation model coupled to a 2-D energy–moisture balance model of the atmosphere and a dynamic–thermodynamic sea-ice model. Full descriptions of the model can be found in Edwards and Marsh (2005a) and Marsh et al. (2011).
The circulation model calculates the horizontal and vertical transport of heat, salinity, and biogeochemical tracers via the combined parameterisation for isoneutral diffusion and eddy-induced advection (Edwards and Marsh, 2005a; Marsh et al., 2011). The ocean model is configured on a 36×36 equal-area horizontal grid with 16 logarithmically spaced z-coordinate levels. The horizontal grid is generally constructed to be uniform in longitude (10∘ resolution) and uniform in the sine of latitude (varying in latitude from ∼3.2∘ at the Equator to 19.2∘ near the poles). The thickness of the vertical grid increases with depth, from 80.8 m at the surface to as much as 765 m at depth. The degree of spatial and temporal abstraction in C-GOLDSTEIN results in parameter values that are not well known and require calibration against observations. The parameters for C-GOLDSTEIN were calibrated against annual mean climatological observations of temperature, salinity, surface air temperature, and humidity using the ensemble Kalman filer (EnKF) methodology (Hargreaves et al., 2004; Ridgwell et al., 2007a). The parameter values for C-GOLDSTEIN used are those reported for the 16-level model in Table S1 of Cao et al. (2009) under “GEnIE16”. C-GOLDSTEIN is run with 96 time steps per year. The resulting circulation is dynamically similar to that of classical general circulation models based on the primitive equations but is significantly faster to run and in this configuration performs well against standard tests of circulation models such as anthropogenic CO2 and chlorofluorocarbon (CFC) uptake, as well as in reproducing the deep-ocean radiocarbon (Δ14C) distribution (Cao et al., 2009).
2.2 Ocean biogeochemical model component – BIOGEM
Transformations and spatial redistribution of biogeochemical compounds both at the ocean surface (by biological uptake) and in the ocean interior (remineralisation), plus air–sea gas exchange, are handled by the module BIOGEM. In the pre-existing version of BIOGEM, the biological (soft-tissue) pump is driven by an implicit (i.e. unresolved) biological community (in place of an explicit representation of living microbial community). It is therefore a nutrient-limitation variant of a model of biogenically induced chemical fluxes, as outlined above. A full description can be found in Ridgwell et al. (2007a) and Ridgwell and Death (2018).
In this study, we use a seasonally insolation forced 16-level ocean model configuration, similar to that of Cao et al. (2009). However, in the particular biogeochemical configuration we use, limitation of biological uptake of carbon is provided by the availability of two nutrients. In addition to phosphate, we now include an iron cycle following Tagliabue et al. (2016). This aspect of the model is determined by a revised set of parameters controlling the iron cycle (Ridgwell and Death, 2018). We also incorporate a series of minor modifications to the climate model component, particularly in terms of the ocean grid and wind velocity and stress forcings (consistent with Marsh et al., 2011) together with associated changes to several of the physics parameters. A complete description and evaluation of the physical and biogeochemical configuration of cGEnIE is provided in Ridgwell and Death (2018).
The current
BIOGEM module in cGEnIE does not explicitly resolve the biological community
and instead transforms surface inorganic nutrients directly
into exported nutrients or dissolved organic matter (DOM):
| inorganic nutrients | DOM and remineralised nutrients |
This simplification greatly facilitates the efficient modelling of the carbon cycle over long timescales but with the associated caveats of an implicit scheme (as discussed earlier). In ECOGEM, biological uptake is again limited by light, temperature, and nutrient availability, but here it must pass through an explicit and dynamic intermediary plankton community, before being returned to DOM or dissolved inorganic nutrients:
| inorganic nutrients | living biomass | DOM and remineralised nutrients |
The ecological community is also subject to mortality and internal trophic interactions, and will produce both inorganic compounds and organic matter. The structural relationship between BIOGEM and ECOGEM is illustrated in Fig. 1.
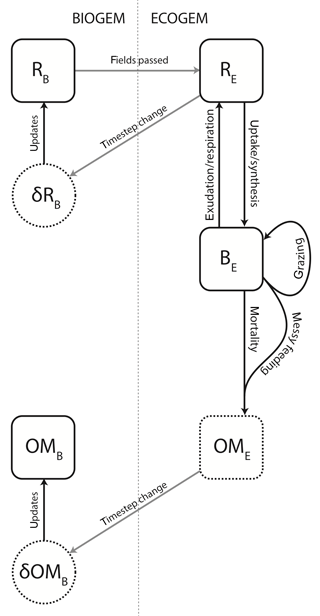
Figure 1Schematic representation of the coupling between BIOGEM and ECOGEM. State variables: R indicates the inorganic element (i.e. resource), B indicates plankton biomass, and OM indicates organic matter. Subscripts B and E denote state variables in BIOGEM and ECOGEM, respectively. BIOGEM passes resource biomass R to ECOGEM. ECOGEM passes rates of change (δ) in R and OM back to BIOGEM.
In the following section, we outline the key state variables directly relating to ecosystem function (Sect. 3.1) describe the mathematical form of the key rate processes relating to each state variable (Sect. 3.2) and how they link together (Sect. 3.3). We will then describe the parameterisation of the model according to organism size and functional type (Sect. 3.4). The model equations are modified from Ward et al. (2012). We provide all the equations used in ECOGEM here, but we provide only brief descriptions of the parameterisations and parameter value justifications already included in Ward et al. (2012).
3.1 State variables
ECOGEM state variables are organised into three matrices (Table 1), representing ecologically relevant biogeochemical tracers (hereafter referred to as “nutrient resources”), plankton biomass, and organic matter. All these matrices have units of mmol element m−3, with the exception of the dynamic chlorophyll quota, which is expressed in units of mg chlorophyll m−3. The nutrient resource vector (R) includes Ir distinct inorganic resources. The plankton community (B) is made up of J individual populations, each associated with Ib cellular nutrient quotas. Finally, organic matter (D) is made up of K size classes of organic matter, each containing id organic nutrient element pools. (Note that, strictly speaking, detrital organic matter is not explicitly resolved as a state variable in ECOGEM, as we currently only resolve the production of organic matter, which is passed to BIOGEM and held there as a state variable. As a consequence, there is no grazing on detrital organic matter in the current configuration of EcoGEnIE. We include a description of D and its relationships here for completeness and for convenience of notation.)
3.1.1 Inorganic resources
R is a row vector of length Ir, the number of dissolved inorganic nutrient resources.
An individual inorganic resource is denoted by the appropriate subscript. For example, PO4 is denoted .
3.1.2 Plankton biomass
B is a J×Ib matrix, where J is the number of plankton populations and Ib is the number of cellular quotas, including chlorophyll.
Each population and element are denoted by an appropriate subscript. For example, the total carbon biomass of plankton population j is denoted Bj,C, while the chlorophyll biomass of that population is denoted Bj,Chl. The column vector describing the carbon content of all plankton populations is denoted BC.
This framework can account for competition between (in theory) any number of different plankton populations. The model equations (below) are written in terms of an “ideal” planktonic form, with the potential to exhibit the full range of ecophysiological traits (among those that are included in the model). Individual populations may take on a realistic subset of these traits, according to their assigned plankton functional type (PFT) (see Sect. 3.4.1). Each population is also assigned a characteristic size, in terms of equivalent spherical diameter (ESD) or cell volume. Organism size plays a key role in determining each population's ecophysiological traits (see Sect. 3.4.2).
3.1.3 Organic detritus
D is a K×Id matrix, where K is the number of detrital size classes and Id is the number of detrital nutrient elements.
Each size class and element are denoted by an appropriate subscript. For example, dissolved organic phosphorus (size class k=1) is denoted D1,P, while particulate organic iron (size class k=2) is denoted D2,Fe.
3.2 Plankton physiology and ecology
The rates of change in each state variable within ECOGEM are defined by a range of ecophysiological processes. These are defined by a set of mathematical functions that are common to all plankton populations. Parameter values are defined in Sect. 3.4.
3.2.1 Temperature limitation
Temperature affects a wide range of metabolic processes through an Arrhenius-like equation that is here set equal for all plankton.
The parameter A describes the temperature sensitivity, T is the ambient water temperature in ∘C, and Tref is a reference temperature (also in ∘C) at which γT=1.
3.2.2 The plankton “quota”
The physiological status of a plankton population is defined in terms of its cellular nutrient quota, Q, which is the ratio of assimilated nutrient (phosphorus or iron) to carbon biomass. For each plankton population, j, and each planktonic quota, ib (≠ C),
This equation is also used to describe the population chlorophyll content relative to carbon biomass. The size of the quota increases with nutrient uptake or chlorophyll synthesis. The quota decreases through the acquisition of carbon (described below).
Excessive accumulation of P or Fe biomass in relation to carbon is prevented as the uptake or assimilation of each nutrient element is down-regulated as the respective quota becomes full. The generic form of the uptake regulation term for element ib is given by a linear function of the nutrient status, modified by an additional shape parameter Geider et al. (h=0.1; 1998) that allows greater assimilation under low-to-moderate resource limitation.
3.2.3 Nutrient uptake
Phosphate and dissolved iron ( P or Fe) are taken up as functions of environmental availability (), maximum uptake rate (), the nutrient affinity (), the quota satiation term, (), and temperature limitation (γT):
This equation is equivalent to the Michaelis–Menten-type response but replaces the half-saturation constant with the more mechanistic nutrient affinity, .
3.2.4 Photosynthesis
The photosynthesis model is modified from Geider et al. (1998) and Moore et al. (2002). Light limitation is calculated as a Poisson function of local irradiance (I), modified by the iron-dependent initial slope of the P–I curve () and the chlorophyll a : carbon ratio (Qj,Chl).
Here, is maximum light-saturated growth rate, modified from an absolute maximum rate of , according to the current nutrient and temperature limitation terms.
The nutrient-limitation term is given as a minimum function of the internal nutrient status (Droop, 1968; Caperon, 1968; Flynn, 2008), each defined by normalised hyperbolic functions for P and Fe (ib= P or Fe):
The gross photosynthetic rate (Pj,C) is then modified from by the light-limitation term.
Net carbon uptake is given by
with the second term accounting for the metabolic cost of biosynthesis (ξ). This parameter was originally defined as a loss of carbon as a fraction of nitrogen uptake (Geider et al., 1998). We define it here relative to phosphate uptake, using a fixed N:P ratio of 16.
3.2.5 Photoacclimation
The chlorophyll : carbon ratio is regulated as the cell attempts to balance the rate of light capture by chlorophyll with the maximum potential (i.e. light-replete) rate of carbon fixation. Depending on this ratio, a certain fraction of newly assimilated phosphorus is diverted to the synthesis of new chlorophyll a:
Here, ρj,Chl is the amount of chlorophyll a that is synthesised for every millimole of phosphorus assimilated (mg Chl (mmol P)−1) with representing the maximum ratio (again converting from the nitrogen-based units of Geider et al., 1998, with a fixed N:P ratio of 16). If phosphorus is assimilated at a carbon-specific rate Vj,P (mmol P (mmol C)−1 d−1), then the carbon specific rate of chlorophyll a synthesis (mg Chl (mmol C)−1 d−1) is
3.2.6 Light attenuation
In both BIOGEM and ECOGEM, the incoming shortwave solar radiation intensity is taken from the climate component in cGEnIE and varies seasonally (Edwards and Marsh, 2005b; Marsh et al., 2011). However, ECOGEM uses a slightly more complex light-attenuation scheme than BIOGEM, which simply calculates a mean solar (shortwave) irradiance averaged over the depth of the surface layer, assuming a clear-water light-attenuation scale of 20 m (Doney et al., 2006).
In ECOGEM, the light level is calculated as the mean level of photosynthetically available radiation within a variable mixed layer (with depth calculated according to Kraus and Turner, 1967). We also take into account inhibition of light penetration due to the presence of light-absorbing particles and dissolved molecules (Shigsesada and Okubo, 1981). If Chltot is the total chlorophyll concentration in the surface layer (of thickness Z1), and ZML is the mixed-layer depth, the virtual chlorophyll concentration distributed across the mixed layer is given by
The combined light-attenuation coefficient attributable to both water and the virtual chlorophyll concentration is given by
For a given level of photosynthetically available radiation at the ocean surface (I0), plankton in the surface grid box experience the average irradiance within the mixed layer, which is given by
3.2.7 Predation (including both herbivorous and carnivorous interactions)
Here, we define predation simply as the consumption of any living organism, regardless of the trophic level of the organism (i.e. phytoplankton or zooplankton prey).
The predator-biomass-specific grazing rate of predator (jpred) on prey (jprey) is given by
where γT is the temperature dependence, is the maximum grazing rate, and is the half-saturation concentration for all (available) prey. The overall grazing rate is a function of total food available to the predator, . This is given by the product of the prey biomass vector, BC, and the grazing kernel (ϕ):
Note that this equation is written out in matrix form, with the dimensions noted underneath each matrix. Each element of the grazing matrix ϕ is an approximately log-normal function of the predator–prey length ratio, , with an optimum ratio of ϑopt and a geometric standard deviation .
We also include an optional “prey-switching” term, such that predators may preferentially attack those prey that are relatively more available (i.e. active switching, s=2). Alternatively, they may attack prey in direct proportion to their availability (i.e. passive switching, s=1). In the simulations below, we assume active switching.
Finally, a prey refuge function is incorporated, such that the overall grazing rate is decreased when the availability of all prey () is low. The size of the prey refuge is dictated by the coefficient Λ. The overall grazing response is calculated on the basis of prey carbon. Grazing losses of other prey elements are simply calculated from their stoichiometric ratio to prey carbon, with different elements assimilated according to the predator's nutritional requirements (see below):
3.2.8 Prey assimilation
Prey biomass is assimilated into predator biomass with an efficiency of (ib≠ Chl). This has a maximum value of λmax that is modified according the quota status of the predator. For elements ib= P or Fe, prey biomass is assimilated as a function of the respective predator quota. If the quota is full, the element is not assimilated. If the quota is empty, the element is assimilated with maximum efficiency (λmax).
C assimilation is regulated according to the status of the most limiting nutrient element (P or Fe) modified by the same shape parameter, h, that was applied in Eq. (6).
If both nutrient quotas are full, C is assimilated at the maximum rate. If either is empty, C assimilation is down-regulated until sufficient quantities of the limiting element(s) are acquired.
3.2.9 Death
All living biomass is subject to a linear mortality rate of mp. This rate is decreased at very low biomasses (population carbon biomass ≲ 10−10 mmol C m−3) in order to maintain a viable population within every surface grid cell (“everything is everywhere, but the environment selects”; Baas-Becking, 1934).
The low biomass at which a population attains “immortality” is sufficiently small for that population to have a negligible impact on all other components of the ecosystem.
3.2.10 Calcium carbonate
The production and export of calcium carbonate (CaCO3) by calcifying plankton in the surface ocean is scaled to the export of particulate organic carbon via a spatially uniform value which is modified by a thermodynamically based relationship with the calcite saturation state. The dissolution of CaCO3 below the surface is treated in a similar way to that of particulate organic matter (POM; Eq. 34), as described by Ridgwell et al. (2007a) with the parameter values controlling the export ratio between CaCO3 and particulate organic carbon (POC) taken from Ridgwell et al. (2007b).
3.2.11 Oxygen
Oxygen production is coupled to photosynthetic carbon fixation via a fixed linear ratio, such that
The negative sign indicates that oxygen is produced as dissolved inorganic carbon (DIC) is consumed. Oxygen consumption associated with the remineralisation of organic matter is unchanged relative to BIOGEM.
3.2.12 Alkalinity
Production of alkalinity is coupled to planktonic uptake of PO4 via a fixed linear ratio, such that
The negative sign indicates that alkalinity increases as PO4 is consumed. This relationship accounts for alkalinity changes associated with N transformations (Zeebe and Wolf-Gladrow, 2001) that are not explicitly represented in the biogeochemical configurations of cGEnIE that are applied here.
3.2.13 Production of organic matter
Plankton mortality and grazing are the only two sources of organic matter, with partitioning between non-sinking dissolved and sinking particulate phases determined by the parameter β. In this initial implementation of ECOGEM, we use a similar size-based sigmoidal partitioning function to Ward and Follows (2016).
Here, βa is the (maximum) fraction to DOM as ESD approaches zero, βb is the (minimum) fraction to DOM as ESD approaches infinity, and βc is the size at which the partitioning is 50 : 50 between DOM and POM. The parameter values have been adjusted from Ward and Follows (2016), such that the global average of β is equal to the constant value of 0.66 used in cGEnIE.
3.3 Differential equations
Differential equations for R, B, and D are written below. The dimensions of each matrix and vector used in Eqs. (30)–(32) are given in Table 1. Note that while R and OM are transported by the physical component of GEnIE, living biomass B is not currently subject to any physical transport. The only communication between biological communities in adjacent grid cells is through the advection and diffusion of inorganic resources and non-living organic matter in BIOGEM. Note that some additional sources and sinks of R, and all sinks of D, are computed in BIOGEM.
3.3.1 Inorganic resources
For each inorganic resource, ir,
3.3.2 Plankton biomass
For each plankton class, j, and internal biomass quota, ib,
3.3.3 Dissolved organic matter
For each detrital nutrient element, id, the rate of change of dissolved fraction of organic matter (k=1) is described by
The dissolved organic matter vector (D1) includes three explicit tracers that are transported by the ocean circulation model and are degraded back to their constituent nutrients with a fixed turnover time of λ(=0.5 years). POM is not represented with explicit state variables in either ECOGEM or BIOGEM. Instead, its implicit production in the surface layer (and the corresponding export below the surface layer) is given by
This surface production is redistributed throughout the water column as a depth-dependent flux, . To achieve this, is partitioned between a “refractory” component (rPOM) that is predominantly remineralised close to the seafloor, and a “labile” component (1−rPOM) which predominantly remineralises in the upper water column. The net remineralisation at depth z, relative to the export depth z0, is determined by characteristic length scales (lrPOM and lPOM for refractory and labile POM, respectively):
The remineralisation length scales reflect a constant sinking speed and constant remineralisation rate. All POM reaching the seafloor is remineralised instantaneously; see Ridgwell et al. (2007a) for a fuller description and justification.
3.3.4 Coupling to BIOGEM
The calculations in BIOGEM are performed 48 times for each model year (i.e. once for every two time steps taken by the ocean circulation mode). ECOGEM takes 20 time steps for each BIOGEM time step, i.e. 960 time steps per year). At the beginning of each ECOGEM time step loop, concentrations of inorganic tracers and key properties of the physical environment are passed from BIOGEM. The ecological community responds by transforming inorganic compounds into living biomass through photosynthesis. At the end of each ECOGEM time step loop, the rates of change in R and OM are passed back to BIOGEM. is used to update DIC, phosphate, iron, oxygen, and alkalinity tracers, while is added to the dissolved organic matter pools. The rate of particulate organic matter production, , is instantly remineralised at depth using to the standard BIOGEM export functions described above (Eq. 34). is used only to update the living biomass concentrations within ECOGEM. The structure of the coupling is illustrated in Fig. 1.
In the initial implementation of ECOGEM described and evaluated here, the explicit plankton community is held entirely within the ECOGEM module and is not subject to physical transport (e.g. advection and diffusion) by the ocean circulation model (although dissolved tracers such as nutrients still are). As a first approximation, this approach appears to be acceptable, as long as the rate of transport between the very large grid cells in cGEnIE is slow in relation to the net growth rates of the plankton community. Online advection of ecosystem state variables will be implemented and its consequences explored in a future version of EcoGEnIE.
3.4 Ecophysiological parameterisation
The model community is made up of a number of different plankton populations, with each one described according to the same set of equations, as outlined above. Differences between the populations are specified according to individual parameterisation of the equations. In the following sections, we describe how the members of the plankton community are specified and how their parameters are assigned according to the organism's size and taxonomic group.
3.4.1 Model structure
The plankton community in ECOGEM is designed to be highly configurable. Each population present in the initial community is specified by a single line in an input text file, which describes the organism size and taxonomic group.
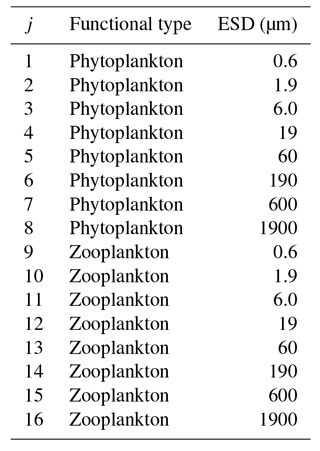
In this configuration, we include 16 plankton populations across eight different size classes. These are divided into two PFTs, namely phytoplankton and zooplankton (see Table 2). The eight phytoplankton populations have nutrient uptake and photosynthesis traits enabled, and predation traits disabled, whereas the opposite is true for the eight zooplankton populations. In the future, we expect to bring in a wider range of trait-based functional types, including siliceous plankton (e.g. Follows et al., 2007), calcifiers (Monteiro et al., 2016), nitrogen fixers (Monteiro et al., 2010), and mixotrophs (Ward and Follows, 2016).
3.4.2 Size-dependent traits
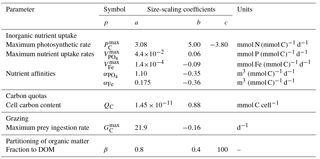
With the exception of the maximum photosynthetic rate (; see below), the size-dependent ecophysiological parameters (p) given in Table 3 are assigned as power–law functions of organismal volume () according to standard equations of the form
Here, V0 is a reference value of V0=1 µm3. The value of p at V=V0 is given by the coefficient a, while the rate of change in p as a function of V is described by the exponent b.
The maximum photosynthetic rate () of very small cells (i.e. ≲ 5 µm ESD) has been shown to deviate from the standard power law of Eq. (35) (Raven, 1994; Bec et al., 2008; Finkel et al., 2010), so we use the slightly more complex unimodal function given by Ward and Follows (2016).
The parameters of this equation (listed in Table 3) were derived empirically from the data of Marañón et al. (2013).
3.4.3 Size-independent traits
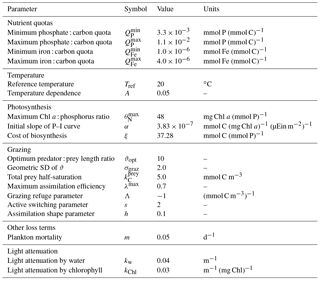
A list of size-independent model parameters is given in Table 4.
3.5 Parameter modifications
As far as possible, the parameter values applied in ECOGEM were kept as close as possible to previously published versions of the model (Ward and Follows, 2016). There were however a few modifications that were required to bring EcoGEnIE into first-order agreement with observations and the current version of cGEnIE (Ridgwell and Death, 2018). In particular, in comparison to the biogeochemical model used in Ward and Follows (2016), the amount of soluble iron supplied to cGEnIE by atmospheric deposition is considerably less. With a smaller source of iron, it was necessary to decrease the iron demand of the plankton community, and this was achieved by decreasing and by 5-fold ( from 20 to 4 nmol Fe (mmol C)−1, and from 5 to 1 nmol Fe (mmol C)−1).
We also found that the flexible stoichiometry of ECOGEM led to excessive export of carbon from the surface ocean, attributable to higher C : P ratios in organic matter (BIOGEM assumes a Redfieldian C : P of 106). This effect was moderated by increasing the size of the minimum phosphate : carbon quota, (relative to Ward et al., 2012).
4.1 10 000-year spin-up
We ran cGEnIE (as configured and described in Ridgwell and Death, 2018) and EcoGEnIE (as described here) each for period of 10 000 years. These runs were initialised from a homogenous and static ocean, with an imposed constant atmospheric CO2 concentration of 278 ppm. We present model output from the 10 000th year of integration.
4.2 Observations
Although they are not necessarily strictly comparable, we compare results from the pre-industrial configurations of cGEnIE and EcoGEnIE to contemporary climatologies from a range of sources. Global climatologies of dissolved phosphate and oxygen are drawn from the World Ocean Atlas 2009 (WOA09 – Garcia et al., 2010), while DIC and alkalinity are taken from Global Ocean Data Analysis Project version 2 (GLODAPv2 – Olsen, 2016). Surface chlorophyll concentrations represent a climatological average from 1997 to 2002, estimated by the SeaWiFS satellite. Depth-integrated primary production is from Behrenfeld and Falkowski (1997). All of these interpolated global fields have been re-gridded onto the cGEnIE grid.
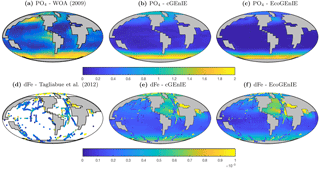
Observed dissolved iron concentrations are those published by Tagliabue et al. (2012). These data are too sparse and variable to allow reliable mapping on the cGEnIE grid and are therefore shown as individual data.
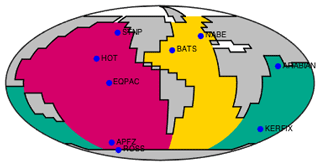
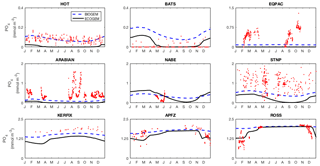
Fidelity to the observed seasonal cycle of nutrients and biomass was evaluated against observations from nine Joint Global Ocean Flux Study (JGOFS) sites: the Hawai'i ocean Time-series (HOT: 23∘ N, 158∘ W), the Bermuda Atlantic Time-series Study (BATS: 32∘ N, 64∘ W), the equatorial Pacific (EQPAC: 0∘ N, 140∘ W), the Arabian Sea (ARABIAN: 16∘ N, 62∘ E), the North Atlantic Bloom Experiment (NABE: 47∘ N, 19∘ W), Station P (STNP: 50∘ N, 145∘ W), Kerfix (KERFIX: 51∘ S, 68∘ E), Antarctic Polar Frontal Zone (APFZ: 62∘ S, 170∘ W), and the Ross Sea (ROSS: 75∘ S, 180∘ W). Model output for Kerfix and the Ross Sea site was not taken at the true locations of the observations (51∘ S, 68∘ E and 75∘ S, 180∘ W, respectively). Kerfix was moved to compensate for a poor representation of the polar front within the coarse resolution ocean model, while the Ross Sea site does not lie within the GEnIE ocean grid. At each site, the observational data represent the mean daily value within the mixed layer. Observational data from all years are plotted together as one climatological year.
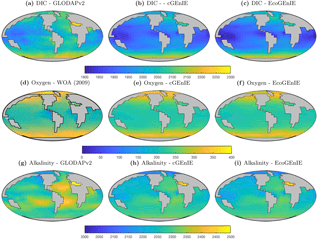
Figure 3Surface concentrations of dissolved inorganic carbon (mmol C m−3), alkalinity (m eq. m−3), and dissolved oxygen (mmol O2 m−3).
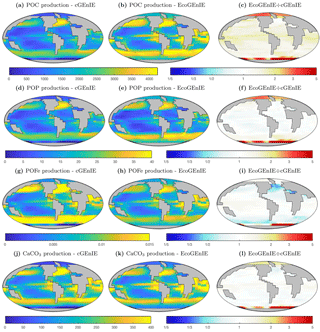
Figure 5Vertical fluxes of particulate carbon (mmol C m−2 d−1), phosphorus (mmol P m−2 d−1), iron (mmol Fe m−2 d−1), and calcium carbonate (mmol CaCO3 m−2 d−1) across the base of the surface layer. The right-hand column indicates the relative increase or decrease in ECOGEM, relative to BIOGEM (dimensionless).
5.1 Biogeochemical variables
We start by describing the global distributions of key biogeochemical tracers that are common to both cGEnIE and EcoGEnIE.
5.1.1 Global surface values
Annual mean global distributions are presented for the upper 80.8 m of the water column, corresponding to the model surface layer. In Fig. 2, we compare output from the two models to observations of dissolved phosphate and iron. Surface phosphate concentrations are broadly similar between the two versions of the model, except that EcoGEnIE provides slightly lower estimates in the Southern Ocean and equatorial upwellings. Both versions strongly underestimate surface phosphate in the equatorial and north Pacific, and to a lesser extent in the north and east Atlantic, the Arctic, and the Arabian Sea. This is likely attributable in part to the model underestimating the strength of upwelling in these regions. It should also be noted that the observations may in some cases be unrepresentative of the true surface layer, when this is significantly shallower than 80.8 m. In such cases, the observed value will be affected by measurements from below the surface layer. Iron distributions are also broadly similar between the two models, with EcoGEnIE showing slightly lower iron concentrations over most of the ocean.
Figure 3 shows observed and modelled values of inorganic carbon, oxygen, and alkalinity. The two models yield very similar surface distributions of the three tracers. DIC and alkalinity are both broadly underestimated relative to observations, while oxygen shows higher fidelity, albeit with artificially high estimates in the equatorial Atlantic and Pacific. This is likely attributable to unrealistically weak upwelling in these regions.
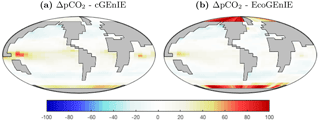
Surface ΔpCO2 from the two models is shown in Fig. 4. EcoGEnIE shows weaker CO2 outgassing in the tropical band, with a much stronger ocean-to-atmosphere flux in the western Arctic.
In Fig. 5, we show the annual mean rate of particulate organic matter production in the surface layer, and the relative differences between ECOGEM and BIOGEM. In comparison to cGEnIE, EcoGEnIE shows elevated POC production in all regions. Production of CaCO3 is globally less variable in EcoGEnIE than cGEnIE, with notable higher fluxes in the oligotrophic gyres and polar regions.
The relative proportions in which these elements and compounds are exported from the surface ocean are regulated by the stoichiometry of biological production. In cGEnIE (BIOGEM), carbon and phosphorus production is rigidly coupled through a fixed ratio of 106 : 1, while POFe : POC and CaCO3 : POC export flux ratios are regulated as a function of environmental conditions. In EcoGEnIE (ECOGEM), phosphorus, iron, and carbon fluxes are all decoupled through the flexible quota physiology, which depends on both environmental conditions and the status of the food web. Only CaCO3:POC flux ratios are regulated via the same mechanism in the two models.
5.1.2 Basin-averaged depth profiles
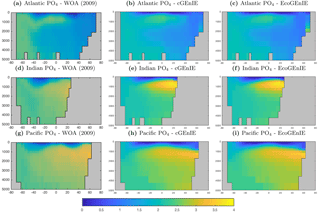
In this section, we present the meridional depth distributions of key biogeochemical tracers, averaged across each of the three main ocean basins, as shown in Fig. 6. Figure 7 shows that the distribution of dissolved phosphate is very similar between the two models, with EcoGEnIE showing a slightly stronger subsurface accumulation in the northern Indian Ocean.
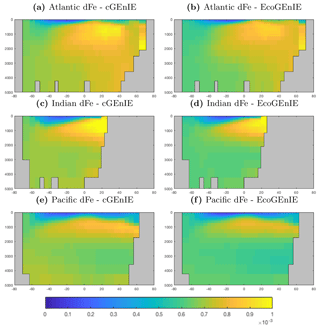
The vertical distributions shown in Fig. 8 reveal that dissolved iron is lower throughout the ocean in EcoGEnIE, relative to cGEnIE, particularly below 1500 m. Differences are less obvious at intermediate depths. (Observations are currently too sparse to estimate reliable basin-scale distributions of dissolved iron; see Tagliabue et al., 2016.)
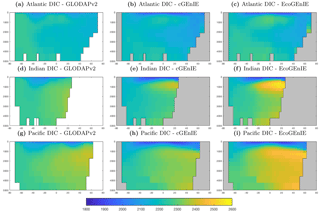
Figure 9 shows that while cGEnIE reproduces observed DIC distributions very well, EcoGEnIE overestimates concentrations within the Indian and Pacific oceans. The total oceanic DIC inventory increased by just under 2 % from 2.99 Examole C in cGEnIE to 3.05 in EcoGEnIE (with a fixed atmospheric CO2 concentration of 278 ppm). Otherwise, the two models show broadly similar distributions, with the most pronounced differences (as for PO4) in the northern Indian Ocean.
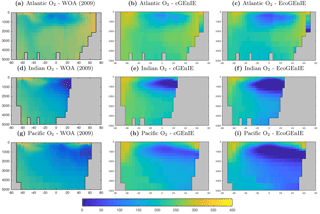
Figure 10 shows that cGEnIE reasonably captures the invasion of O2 into the ocean interior through the Southern Ocean and North Atlantic. These patterns are also seen in EcoGEnIE, although unrealistic water column anoxia is seen in the northern intermediate Indian and Pacific oceans. Again, this is likely a consequence of greater export and remineralisation of organic carbon in EcoGEnIE, leading to more oxygen consumption at intermediate depths (also evidenced by elevated PO4, DIC, and alkalinity in the same regions; Figs. 7, 9, and 11).
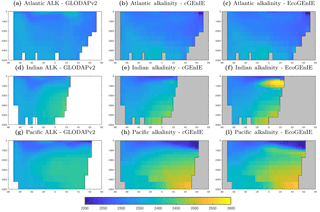
Alkalinity (Fig. 11) also shows some clear differences between the two models, again most noticeably in the northern intermediate Indian and Pacific oceans. In these regions, EcoGEnIE shows excessive accumulation of alkalinity at ∼1000 m depth. This is again attributable to the increased C export in EcoGEnIE. In the absence of a nitrogen cycle (and reduction), increased anoxic remineralisation of organic carbon (Figs. 9 and 10) leads to increased reduction of sulfate to H2S, which in turn increases the alkalinity of seawater. Further adjustment of the cellular nutrient quotas in ECOGEM and hence the effective exported P:C Redfield ratio and/or retuning of the organic matter remineralisation profiles in BIOGEM (Ridgwell et al., 2007a) would likely resolve these issues.
5.2 Ecological variables
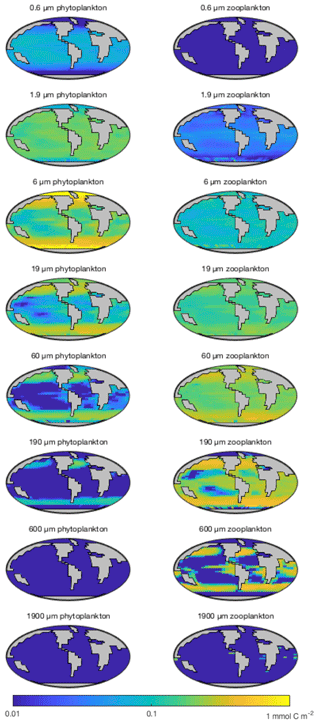
Moving on from the core components that are common to both models, we present a range of ecological variables that are exclusive to EcoGEnIE. As before, we begin by presenting the annual mean global distributions in the ocean surface layer, comparing total chlorophyll and primary production to satellite-derived estimates (Fig. 14). We then look in more detail at the community composition, with Fig. 15 showing the carbon biomass within each plankton population. Figure 16 then shows the degree of nutrient limitation within each phytoplankton population. Finally, in Fig. 17, we show the seasonal cycle of community and population level chlorophyll at each of the nine JGOFS time series sites.
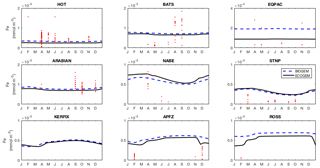
Figure 13Annual cycle of surface dissolved iron at nine time series sites in cGEnIE and EcoGEnIE. Red dots indicate climatological observations, while the lines represent modelled surface iron concentrations. Locations of the time series are indicated in Fig. 6.
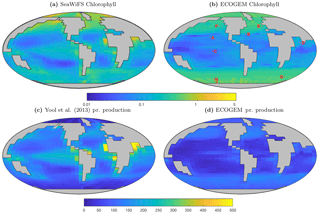
Figure 14Satellite-derived (a, c) and modelled (b, d) surface chlorophyll a concentration (mg Chl m−3) and depth-integrated primary production (mg C m−2 d−1). The satellite-derived estimate of primary production is a composite of three products (Behrenfeld and Falkowski, 1997; Carr et al., 2006; Westberry et al., 2008), as in Yool et al. (2013, their Fig. 12).
5.2.1 Global surface values
Figure 14 reveals that EcoGEnIE shows some limited agreement with the satellite-derived estimate of global chlorophyll. As expected, chlorophyll biomass is elevated in the high-latitude oceans relative to lower latitudes. The subtropical gyres show low biomass, but the distinction with higher latitudes is not as clear as in the satellite estimate. The model also shows a clear lack of chlorophyll in equatorial and coastal upwelling regions, relative to the satellite estimate. The model predicts higher chlorophyll concentrations in the Southern Ocean than the satellite estimate, although it should be noted that the satellite algorithms may be underestimating concentrations in these regions (Fig. 17 and Dierssen, 2010).
Modelled primary production correctly increases from the oligotrophic gyres towards high latitudes and upwelling regions, but variability is much lower than in the satellite estimate. Specifically, the model and satellite estimates yield broadly similar estimates in the oligotrophic gyres, but the model does not attain the high values seen at higher latitudes and in coastal areas.
Figure 15 shows the modelled carbon biomass concentrations in the surface layer for each modelled plankton population. The smallest (0.6 µm) phytoplankton size class is evenly distributed in the low-latitude oceans between 40∘ N and S but is largely absent nearer to the poles. The 1.9 µm phytoplankton size class is similarly ubiquitous at low latitudes, albeit with somewhat higher biomass, and its range extends much further towards the poles. With increasing size, the larger phytoplankton are increasingly restricted to highly productive areas, such as the subpolar gyres and upwelling zones.
Perhaps as expected, zooplankton size classes tend to mirror the biogeography of their phytoplankton prey. The smallest (1.9 µm) surviving size class is found primarily at low latitudes, although a highly variable population is found at higher latitudes. Larger zooplankton size classes follow a similar pattern to the phytoplankton, moving from a cosmopolitan but homogenous distribution in the smaller size classes towards spatially more variable distributions among the larger organisms.
The degree of nutrient limitation within each phytoplankton size class is shown in Fig. 16. The two-dimensional colour scale indicates decreasing iron limitation from left to right, and decreasing phosphorus limitation from bottom to top. White is therefore nutrient replete, blue is phosphorus limited, red is iron limited, and magenta is phosphorus–iron co-limited. The figure demonstrates that the smallest size class is not nutrient limited in any region. The increasing saturation of the colour scale in larger size classes indicates an increasing degree of nutrient limitation. As expected, nutrient limitation is strongest in the highly stratified low latitudes. A stronger vertical supply of nutrients at higher latitudes is associated with weaker nutrient limitation, although nutrient limitation is still significant among the larger size classes. Consistent with observations (Moore et al., 2013), phosphorus limitation is restricted to low latitudes. Iron limitation dominates in high-latitude regions, especially among larger size classes. Among these larger groups, the upwelling zones appear to be characterised by iron-phosphorus co-limitation.
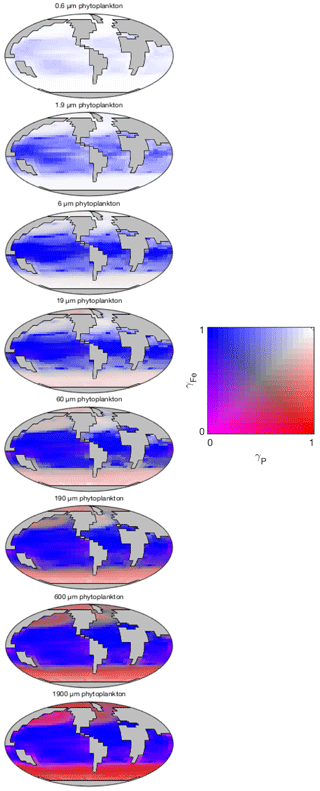
Figure 16Nutrient limitation in each phytoplankton population (dimensionless). The two-dimensional colour scale indicates decreasing phosphorus limitation from left to right, and decreasing iron limitation from bottom to top. White is therefore nutrient replete, blue is phosphorus limited, red is iron limited, and magenta is phosphorus–iron co-limited.
5.2.2 Time series
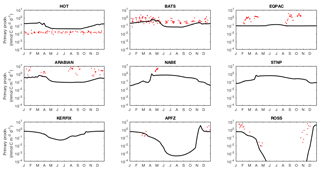
The seasonal cycles of phytoplankton chlorophyll a are compared to time series observations in Fig. 17. The modelled total chlorophyll concentrations (black lines) track the observed concentrations (red dots) reasonably well at most sites. The bottom three panels also suggest that the satellite data shown in Fig. 14 may slightly underestimate surface chlorophyll concentrations in the Southern Ocean. The modelled surface chlorophyll concentration is too low in the equatorial Pacific, while the spring bloom occurs 1–2 months earlier than was seen during the North Atlantic Bloom Experiment.
The seasonal cycles of primary production in the surface layer are compared to time series observations in Fig. 18. As also indicated in Fig. 14, the spatial variance in modelled primary production is too low, with primary production overestimated at the most oligotrophic site (HOT) and typically underestimated at the most productive sites (especially the equatorial Pacific, NABE, and the Ross Sea). In contrast to the lack of spatial variability, the model exhibits significant seasonal variation, often in excess of the observed variability (at those sites where the seasonal cycle is well resolved).
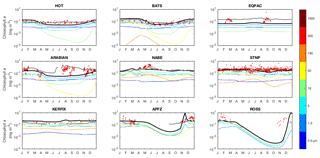
Figure 17Annual cycle of surface chlorophyll a at nine JGOFS time series sites. Red dots indicate climatological observations, while the black lines represent modelled total surface chlorophyll a. Coloured lines represent chlorophyll a in individual size classes (blue is small; red is large). Locations of the time series are indicated in Fig. 6. Satellite estimates of chlorophyll a are shown in grey.
5.2.3 cGEnIE vs. EcoGEnIE
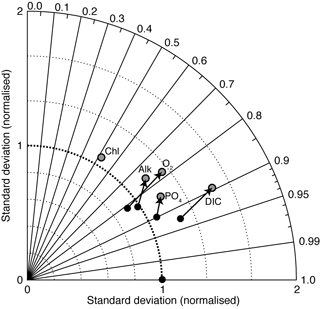
Figure 19 is a Taylor diagram comparing the two models in terms of their correlation to observations and their standard deviations, relative to observations. A perfect model would be located at the middle of the bottom axis, with a correlation coefficient of 1.0 and a normalised standard deviation of 1.0. The closer a model is to this ideal point, the better a representation of the data it provides. Figure 19 shows that EcoGEnIE is located further from the ideal point than cGEnIE, in terms of oxygen, alkalinity, phosphate, and DIC. The new model seems to provide a universally worse representation of global ocean biogeochemistry. This is perhaps not surprising, given that the BIOGEM component of cGEnIE has at various times been systematically tuned to match the observation data (e.g. Ridgwell et al., 2007a; Ridgwell and Death, 2018). EcoGEnIE has not yet been optimised in this way.
The marine ecosystem is a central component of the Earth system, harnessing solar energy to sustain the biogeochemical cycling of elements between dissolved inorganic nutrients, living biomass, and decaying organic matter. The interaction of these components with the global carbon cycle is critical to our interpretation of past, present, and future climates, and has motivated the development of a wide range of models. These can be placed on a spectrum of increasing complexity, from simple and computationally efficient box models to fully coupled Earth system models with extremely large computational costs.
cGEnIE is a model of intermediate complexity on this spectrum. It has been designed to allow rapid model evaluation while at the same time retaining somewhat realistic global dynamics that facilitate comparison with observations. With this goal in mind, the biological pump was parameterised as a simple vertical flux defined as a function of environmental conditions (Ridgwell et al., 2007a). This simplicity is well suited to questions concerning the interactions of marine biogeochemistry and climate, but at the same time precludes any investigation of the role of ecological interactions with the broader Earth system.
Here, we have presented an ecological extension to cGEnIE that opens up this area of investigation. EcoGEnIE is rooted in size-dependent physiological and ecological constraints (Ward et al., 2012). The ecophysiological parameters are relatively well constrained by observations, even in comparison to simpler ecosystem models that are based on much more aggregated functional groups (Anderson, 2005; Litchman et al., 2007). The size-based formulation has the additional benefit of linking directly to functional aspects of the ecosystem, such as food web structure and particle sinking (Ward and Follows, 2016).
The aim of this paper is to provide a detailed description of the new ecological component. It is clear from Fig. 19 that the switch from the parameterised biological pump to the explicit ecological model has led to a deterioration in the overall ability of cGEnIE to reproduce the global distributions of important biogeochemical tracers. This is an acceptable outcome, as our goal here is simply to provide a full description of the new model. Given that the original model was calibrated to the observations in question (Ridgwell et al., 2007a), that process will need to be repeated for the new model before any sort of objective comparison can be made. We also note that EcoGEnIE is still capable of reproducing approximately 90 % of the global variability in DIC, more than 70 % for phosphate, oxygen, and alkalinity, and more than 50 % for surface chlorophyll.
Despite a slight overall deterioration in terms of model–observation misfit, the biogeochemical components of the model retain the key features that should be expected. At the same time, the ecological community conforms to expectations in terms of standing stocks and fluxes, both in terms of large-scale spatial distributions and the seasonal cycles at specific locations (Figs. 14 and 17). Overall patterns of community structure and physiological limitation also follow expectations based on observations and theory.
As presented, the model is limited to three limiting resources (light, phosphorus, and iron) and two plankton functional types (phytoplankton and zooplankton). We have written the model equations and code to facilitate the extension of the model to include additional components. In particular, the model capabilities can be extended by enabling silicon and nitrogen limitation, leveraging the silicon and nitrogen cycles already present in BIOGEM (Monteiro et al., 2012). Adding these nutrients will enable the addition of diatoms and diazotrophs, which are both likely to be important factors affecting the long-term strength of the biological pump (Tyrrell, 1999; Armstrong et al., 2002).
Muffin
A manual, detailing code installation, basic model configuration, plus an extensive series of tutorials covering various aspects of the cGEnIE “muffin” release, experimental design, and results' output and processing, is provided. The Latex source of the manual along with pre-built PDF file can be obtained by cloning (https://github.com/derpycode/muffindoc).
A muffin manual version (0.9.1b) corresponding to the model code release can be downloaded at https://github.com/derpycode/muffindoc/archive/1.9.1b.zip or at https://github.com/derpycode/muffindoc/archive/1.9.1b.tar.gz and has a DOI of https://doi.org/10.5281/zenodo.1407658 (Ridgwell et al., 2018).
Instructions
The muffin manual contains instructions for obtaining, installing, and testing the code, plus how to run experiments. Specifically,
-
Section 1.1 provides a basic overview of the software environment required for installing and running muffin.
-
Section 1.2.2 provides a basic overview of cloning and testing the code.
-
Section 17.4 provides a detailed guide to cloning the code and configuring an Ubuntu (18.04) software environment including netCDF library installation, plus running a basic test.
-
Section 17.6 provides a detailed guide to cloning the code and configuring a Mac OS software environment including netCDF library installation, plus running a basic test.
-
Section 1.3 provides a basic guide to running experiments (also, see Sect. 1.6 and 1.7).
-
Section 1.4 provides a basic introduction to model output (much more detail is given in Sect. 12).
The code for the cGENIE.muffin model is hosted on GitHub. The specific version used in this paper is tagged as release 0.9.1 and can be obtained by cloning (https://github.com/derpycode/cgenie.muffin) or downloading (https://github.com/derpycode/cgenie.muffin/archive/0.9.1.zip) or https://github.com/derpycode/cgenie.muffin/archive/0.9.1.tar.gz, and is assigned a DOI: https://doi.org/10.5281/zenodo.1404210 (Ridgwell and Reinhard, 2018) (Note that the discussion paper version of muffin was tagged as 0.9.0 and was assigned a DOI:https://doi.org/10.5281/zenodo.1312518 (Ridgwell and ophiocordyceps, 2018). The difference simply reflects an incorrect plankton definition file included in the code of the earlier tagged release and that did not reflect the results. The differences in results obtained using the incorrect earlier configuration file were negligible.) Configuration files for the specific experiments presented in the paper can be found in the following directory:
cgenie.muffin\genie-userconfigs\MS\
wardetal.2018
Details of the different experiments, plus the command line needed to run each one, are given in readme.txt.
Finally, Sect. 9 of the muffin manual provides a set of tutorials surrounding the configuration and capabilities of the ECOGEM ecosystem model.
BW, AR and JW developed the model. RD, JW and AR developed the iron biogeochemistry. All authors wrote the paper.
The authors declare that they have no conflict of interest.
This work was supported by the European Research Council “PALEOGENiE”
project (ERC-2013-CoG-617313). Ben A. Ward thanks the Marine System Modelling group at
the National Oceanography Centre, Southampton. Satellite ocean colour data
(Sea-viewing Wide Field-of-view Sensor; SeaWiFS) were obtained from the
National Aeronautics and Space Administration (NASA) Goddard Space Flight
Center.
Edited by: Paul
Halloran
Reviewed by: Erik Buitenhuis and one anonymous
referee
Anderson, T. R.: Plankton functional type modelling: Running before we can walk?, J. Plankton Res., 27, 1073–1081, 2005. a, b
Archer, D. E. and Johnson, K.: A model of the iron cycle in the ocean, Global Biogeochem. Cy., 14, 269–279, 2000. a
Armstrong, R. A., Lee, C., Hedges, J. I., Honjo, S., and Wakeham, S. G.: A new, mechanistic model for organic carbon fluxes in the ocean based on the quantitative association of POC with ballast materials, Deep-Sea Res. Pt. II, 49, 219–236, 2002. a
Aumont, O., Maier-Reimer, E., Blain, S., and Pondaven, P.: An ecosystem model of the global ocean including Fe, Si, P co-limitations, Global Biogeochem. Cy., 17, 1060, https://doi.org/10.1029/2001GB001745, 2003. a
Aumont, O., Ethé, C., Tagliabue, A., Bopp, L., and Gehlen, M.: PISCES-v2: an ocean biogeochemical model for carbon and ecosystem studies, Geosci. Model Dev., 8, 2465–2513, https://doi.org/10.5194/gmd-8-2465-2015, 2015. a
Baas-Becking, L. G. M.: Geobiologie of Inleiding Tot de Milieukunde, Van Stockum & Zoon, The Hague, 1934. a
Bacastow, R. and Maier-Reimer, E.: Ocean-circulation model of the carbon cycle, Clim. Dynam., 4, 95–125, 1990. a, b
Bec, B., Collos, Y., Vaquer, A., Mouillot, D., and Souchu, P.: Growth rate peaks at intermediate cell size in marine photosynthetic picoeukaryotes, Limnol. Oceanogr., 53, 863–867, 2008. a
Behrenfeld, M. J. and Falkowski, P. G.: Photosynthetic rates derived from satellite-based chlorophyll concentration, Limnol. Oceanogr., 42, 1–20, 1997. a, b
Bruggeman, J. and Kooijman, S. A. L. M.: A biodiversity-inspired approach to aquatic ecosystem modeling, Limnol. Oceanogr., 52, 1533–1544, 2007. a
Butenschön, M., Clark, J., Aldridge, J. N., Allen, J. I., Artioli, Y., Blackford, J., Bruggeman, J., Cazenave, P., Ciavatta, S., Kay, S., Lessin, G., van Leeuwen, S., van der Molen, J., de Mora, L., Polimene, L., Sailley, S., Stephens, N., and Torres, R.: ERSEM 15.06: a generic model for marine biogeochemistry and the ecosystem dynamics of the lower trophic levels, Geosci. Model Dev., 9, 1293–1339, https://doi.org/10.5194/gmd-9-1293-2016, 2016. a
Cao, L., Eby, M., Ridgwell, A., Caldeira, K., Archer, D., Ishida, A., Joos, F., Matsumoto, K., Mikolajewicz, U., Mouchet, A., Orr, J. C., Plattner, G.-K., Schlitzer, R., Tokos, K., Totterdell, I., Tschumi, T., Yamanaka, Y., and Yool, A.: The role of ocean transport in the uptake of anthropogenic CO2, Biogeosciences, 6, 375–390, https://doi.org/10.5194/bg-6-375-2009, 2009. a, b, c
Caperon, J.: Growth response of Isochrysis galbana to nitrate variation at limiting concentrations, Ecology, 49, 886–872, 1968. a, b
Carr, M.-E., Friedrichs, M. A. M., Schmeltz, M., Aita, M. N., Antoine, D., Arrigo, K. R., Asanuma, I., Aumont, O., Barber, R., Behrenfeld, M., Bidigare, R., Buitenhuis, E. T., Campbell, J., Ciotti, A., Dierssen, H., Dowell, M., Dunne, J., Esaias, W., Gentili, B., Gregg, W., Groom, S., Hoepffner, N., Ishizaka, J., Kameda, T., le Quéré, C., Lohrenz, S., Marra, J., Mélin, F., Moore, K., Morel, A., Reddy, T. E., Ryan, J., Scardi, M., Smyth, T., Turpie, K., Tilstone, G., Waters, K., and Yamanaka, Y.: A comparison of global estimates of marine primary production from ocean color, Deep-Sea Res. Pt. II, 53, 541–770, 2006. a
Claussen, M., Mysak, L., Weaver, A., Crucifix, M., Fichefet, T., Loutre, M.-F., Weber, S., Alcamo, J., Alexeev, V., Berger, A., Calov, R., Ganopolski, A., Goosse, H., Lohmann, G., Lunkeit, F., Mokhov, I., Petoukhov, ., Stone, P., and Wang, Z.: Earth system models of intermediate complexity: closing the gap in the spectrum of climate system models., Clim. Dynam., 18, 579–586, 2002. a
Dierssen, H. M.: Perspectives on empirical approaches for ocean color remote sensing of chlorophyll in a changing climate, P. Natl. Acad. Sci. USA, 107, 17073–17078, 2010. a
Doney, S., Lindsay, K., Fung, I., and John, J.: Natural variability in a stable, 1000-yr global coupled climate–carbon cycle simulation, J. Climate, 19, 3033–3054, 2006. a
Droop, M. R.: Vitamin B12 and Marine Ecology, IV. The kinetics of uptake, growth and inhibition in Monochrysis lutheri, J. the Marine Biological Association of the United Kingdom, 48, 689–733, 1968. a, b
Edwards, N. and Marsh, R.: Uncertainties due to transport-parameter sensitivity in an efficient 3-D ocean-climate model, Clim. Dynam., 24, 415–433, 2005a. a, b
Edwards, N. R. and Marsh, R.: Uncertainties due to transport-parameter sensitivity in an efficient 3-D ocean-climate model, Clim. Dynam., 24, 415–433, 2005b. a
Falkowski, P. G., Katz, M. E., Knoll, A. H., Quigg, A., Raven, J. A., Schofield, O., and Taylor, F. J. R.: The Evolution of Modern Eukaryotic Phytoplankton, Science, 305, 354–360, 2004. a
Finkel, Z. V., Beardall, J., Flynn, K. J., Quigg, A., Rees, T. A. V., and Raven, J. A.: Phytoplankton in a changing world: cell size and elemental stoichiometry, J. Plankton Res., 32, 119–137, 2010. a
Flynn, K. J.: The importance of the form of the quota curve and control of non-limiting nutrient transport in phytoplankton models, J. Plankton Res., 30, 423–438, 2008. a
Follows, M. J., Dutkiewicz, S., Grant, S., and Chisholm, S. W.: Emergent Biogeography of Microbial Communities in a Model Ocean, Science, 315, 1843–1846, 2007. a, b, c
Friedrichs, M. A. M., Hood, R. R., and Wiggert, J. D.: Ecosystem model complexity versus physical forcing: Quantification of their relative impact with assimilated Arabian Sea data, Deep-Sea Res. Pt. II, 53, 576–600, 2006. a
Friedrichs, M. A. M., Dusenberry, J. A., Anderson, L. A., Armstrong, R., Chai, F., Christian, J. R., Doney, S. C., Dunne, J., Fujii, M., Hood, R. R., McGillicuddy, D., Moore, J. K., Schartau, M., Spitz, Y. H., and Wiggert, J. D.: Assessment of skill and portability in regional marine biogeochemical models: the role of multiple planktonic groups, J. Geophysical Res., 112, C08001, https://doi.org/10.1029/2006JC003852, 2007. a, b
Garcia, H. E., Locarnini, R. A., Boyer, T. P., Antonov, J. I., Zweng, M. M., Baranova, O. K., and Johnson, D. R.: World Ocean Atlas 2009, Volume 4: Nutrients (phosphate, nitrate, and silicate). NOAA Atlas NESDIS 71, U.S. Government Printing Office, Washington, DC, 2010. a
Geider, R. J., MacIntyre, H. L., and Kana, T. M.: A dynamic regulatory model of phytoacclimation to light, nutrients and temperature, Limnol. Oceanogr., 43, 679–694, 1998. a, b, c, d, e
Gibbs, S. J., Bown, P. R., Ridgwell, A., Young, J. R., Poulton, A. J., and O'Dea, S. A.: Ocean warming, not acidification, controlled coccolithophore response during past greenhouse climate change, Geology, 44, 59–62, https://doi.org/10.1130/G37273.1, 2015. a
Guidi, L., Stemmann, L., Jackson, G. A., Ibanez, F., Claustre, H., Legendre, L., Picheral, M., and Gorsky, G.: Effects of phytoplankton community on production, size and export of large aggregates: A world-ocean analysis, Limnol. Oceanogr., 54, 1951–1963, 2009. a
Hain, M. P., Sigman, D. M., and Haug, G. H.: The biological pump in the past, in: Treatise on Geochemistry, vol. 8, pp. 485–517, Elsevier, 2nd edn., 2014. a
Hansen, P. J., Bjørnsen, P. K., and Hansen, B. W.: Zooplankton grazing and growth: Scaling with the 2–2000-µm body size range, Limnol. Oceanogr., 42, 678–704, 1997. a
Hargreaves, J. C., Annan, J. D., Edwards, N. R., and Marsh, R.: An efficient climate forecasting method using an intermediate complexity Earth System Model and the ensemble Kalman filter, Clim. Dynam., 23, 745–760, https://doi.org/10.1007/s00382-004-0471-4, 2004. a
Heinze, C., Maier-Reimer, E., and Winn, K.: Glacial pCO2 reduction by the world ocean: Experiments with the Hamburg carbon cycle model, Paleoceanography, 6, 395–430, 1991. a
Hollowed, A. B., Barange, M., Beamish, R. J., Brander, K., Cochrane, K., Drinkwater, K., Foreman, M. G. G., Hare, J. A., Holt, J., Ito, S., Kim, S., King, J., Loeng, H., MacKenzie, B. R., Mueter, F. J., Okey, T. A., Peck, M. A., Radchenko, V. I., Rice, J. C., Schirripa, M. J., Yatsu, A., and Yamanaka, Y.: Projected impacts of climate change on marine fish and fisheries, ICES J. Marine Science, 5, 1023–1037, 2013. a
Hülse, D., Arndta, S., Wilson, J. D., Munhoven, G., and Ridgwell, A.: Understanding the causes and consequences of past marine carbon cycling variability through models, Earth-Sience Reviews, 171, 349–382, 2017. a
John, E., Wilson, J., Pearson, P., and Ridgwell, A.: Temperature-dependent remineralization and carbon cycling in the warm Eocene oceans, Palaeogeogr. Palaeocl., 413, 158–166, https://doi.org/10.1016/j.palaeo.2014.05.019, 2014. a
Kraus, E. B. and Turner, J. S.: A one-dimensional model of the seasonal thermocline II. The general theory and its consequences, Tellus, 19, 98–106, 1967. a
Kwiatkowski, L., Yool, A., Allen, J. I., Anderson, T. R., Barciela, R., Buitenhuis, E. T., Butenschön, M., Enright, C., Halloran, P. R., Le Quéré, C., de Mora, L., Racault, M.-F., Sinha, B., Totterdell, I. J., and Cox, P. M.: iMarNet: an ocean biogeochemistry model intercomparison project within a common physical ocean modelling framework, Biogeosciences, 11, 7291–7304, https://doi.org/10.5194/bg-11-7291-2014, 2014. a
Le Quéré, C.: Reply to Horizons article “Plankton functional type modelling: running before we can walk?” Anderson (2005): I. Abrupt changes in marine ecosystems?, J. Plankton Res., 28, 871–872, 2006. a
Le Quéré, C., Harrison, S. P., Prentice, I. C., Buitenhuis, E. T., Aumont, O., Bopp, L., Claustre, H., Cotrim da Cunha, L., Geider, R., Giraud, X., Klaas, C., Kohfeld, K. E., Legendre, L., Manizza, M., Platt, T., Rivkin, R. B., Sathyendranath, S., Uitz, J., Watson, A. J., and Wolf-Gladrow, D.: Ecosystem dynamics based on plankton functional types for global ocean biogeochemistry models, Glob. Change Biol., 11, 2016–2040, 2005. a, b, c
Lenton, T. M., Marsh, R., Price, A. R., Lunt, D. J., Aksenov, Y., Annan, J. D., Cooper-Chadwick, T., Cox, S. J., Edwards, N. R., Goswami, S., Hargreaves, J. C., Harris, P. P., Jiao, Z., Livina, V. N., Payne, A. J., Rutt, I. C., Shepherd, J. G., Valdes, P. J., Williams, G., Williamson, M. S., and Yool, A.: Effects of atmospheric dynamics and ocean resolution on bi-stability of the thermohaline circulation examined using the Grid ENabled Integrated Earth system modelling (GENIE) framework, Clim. Dynam., 29, 591–613, 2007. a
Litchman, E., Klausmeier, C. A., Schofield, O. M., and Falkowski, P. G.: The role of functional traits and trade-offs in structuring phytoplankton communities: scalling from cellular to ecosystem level, Ecol. Lett., 10, 1170–1181, 2007. a, b
Losa, S. N., Vezina, A., Wright, D., Lu, Y., Thompson, K., and Dowd, M.: 3D ecosystem modelling in the North Atlantic: Relative impacts of physical and biological parameterisations, J. Marine Syst., 61, 230–245, 2006. a
Maier-Reimer, E.: Geochemical cycles in an ocean general circulation model. Preindustrial tracer distributions, Global Biogeochem. Cy., 7, 645–677, 1993. a
Marañón, E., Cermeño, P., López-Sandoval, D. C., Rodríguez-Ramos, T., Sobrino, C., Huete-Ortega, M., Blanco, J. M., and Rodríguez, J.: Unimodal size scaling of phytoplankton growth and the size dependence of nutrient uptake and use, Ecol. Lett., 16, 371–379, 2013. a
Marchal, O., Stocker, T. F., and Joos, F.: A latitude-depth, circulation-biogeochemical ocean modelfor paleoclimate studies, Development and sensitivities, Tellus B, 50, 290–316, 1998. a
Marsh, R., Müller, S. A., Yool, A., and Edwards, N. R.: Incorporation of the C-GOLDSTEIN efficient climate model into the GENIE framework: “eb_go_gs” configurations of GENIE, Geosci. Model Dev., 4, 957–992, https://doi.org/10.5194/gmd-4-957-2011, 2011. a, b, c, d
Martin, J. H., Knauer, G. A., Karl, D. M., and Broenkow, W. W.: Vertex: carbon cycling in the northeast Pacific, Deep-Sea Res., 34, 267–285, 1987. a
Meyer, K. M., Kump, L. R., and Ridgwell, A.: Biogeochemical controls on photic-zone euxinia during the end-Permian mass extinction, Geology, 36, 747–750, 2008. a
Meyer, K. M., Ridgwell, A., and Payne, J. L.: The influence of the biological pump on ocean chemistry: implications for long-term trends in marine redox chemistry, the global carbon cycle, and marine animal ecosystems, Geobiology, 14, 207–219, https://doi.org/10.1111/gbi.12176, 2016. a
Monteiro, F. M., Follows, M. J., and Dutkiewicz, S.: Distribution of diverse nitrogen fixers in the global ocean., Global Biogeochem. Cy., 24, GB3017, https://doi.org/10.1029/2009GB003731, 2010. a
Monteiro, F. M., Pancost, R. D., Ridgwell, A., and Donnadieu, Y.: Nutrients as the dominant control on the spread of anoxia and euxinia across the Cenomanian-Turonian oceanic anoxic event (OAE2): Model-data comparison, Paleoceanography, 27, PA4209, https://doi.org/10.1029/2012PA002351, 2012. a, b, c
Monteiro, F. M., Bach, L. T., Brownlee, C., Bown, P., Rickaby, R. E. M., Tyrrell, T., Beaufort, L., Dutkiewicz, S., Gibbs, S., Gutowska, M. A., Lee, R., Poulton, A. J., Riebesell, U., Young, J., and Ridgwell, A.: Calcification in marine phytoplankton: Physiological costs and ecological benefits, Sci. Adv., 2, e1501822, https://doi.org/10.1126/sciadv.1501822, 2016. a
Moore, C. M., Mills, M. M., Arrigo, K. R., Berman-Frank, I., Bopp, L., Boyd, P. W., Galbraith, E. D., Geider, R. J., Guieu, C., Jaccard, S. L., Jickells, T. D., Roche, J. L., Lenton, T. M., Mahowald, N. M., Marañón, E., Marinov, I., Moore, J. K., Nakatsuka, T., Oschlies, A., Saito, M. A., Thingstad, T. F., Tsuda, A., and Ulloa, O.: Processes and patterns of oceanic nutrient limitation, Nat. Geosci., 6, 701–710, 2013. a
Moore, J. K., Doney, S. C., Kleypas, J. A., Glover, D. M., and Fung, I. Y.: An intermediate complexity marine ecosystem model for the global domain, Deep-Sea Res. Pt. II, 49, 403–462, 2002. a, b
Najjar, R. G., Sarmiento, J. L., and Toggweiler, J. R.: Downward transport and fate of organic matter in the ocean: Simulations with a general circulation model, Global Biogeochem. Cy., 6, 45–76, 1992. a, b
Norris, R., Kirtland Turner, S., Hull, P., and Ridgwell, A.: Marine ecosystem responses to Cenozoic global change, Science, 341, 492–498, https://doi.org/10.1126/science.1240543, 2013. a
Olsen, A., Key, R. M., van Heuven, S., Lauvset, S. K., Velo, A., Lin, X., Schirnick, C., Kozyr, A., Tanhua, T., Hoppema, M., Jutterström, S., Steinfeldt, R., Jeansson, E., Ishii, M., Pérez, F. F., and Suzuki, T.: The Global Ocean Data Analysis Project version 2 (GLODAPv2) – an internally consistent data product for the world ocean, Earth Syst. Sci. Data, 8, 297–323, https://doi.org/10.5194/essd-8-297-2016, 2016. a
Oschlies, A.: Model-derived estimates of new production: New results point to lower values, Deep-Sea Res. Pt. II, 48, 2173–2197, 2001. a
Parekh, P., Follows, M. J., Dutkiewicz, S., and Ito, T.: Physical and biological regulation of the soft tissue carbon pump, Paleoceanography, 21, PA3001, https://doi.org/10.1029/2005PA001258, 2006. a
Raven, J. A.: Why are there no picoplanktonic O2 evolvers with volumes less than 10−19 m3?, J. Plankton Res., 16, 565–580, 1994. a
Redfield, A. C.: On the proportions of organic derivatives in sea water and their relation to the composition of plankton, James Johnstone Memorial Volume, Liverpool, 176–192, 1934. a
Ridgwell, A. and Death, R.: Iron limitation in an efficient model of global carbon cycling and climate, in preparation, 2018. a, b, c, d, e, f
Ridgwell, A. and ophiocordyceps: derpycode/cgenie.muffin: Ward et al. (2018) (GMD) (Version 0.9.0), Zenodo, https://doi.org/10.5281/zenodo.1312518, 2018.
Ridgwell, A. and Reinhard, C.: derpycode/cgenie.muffin: Ward et al. (2018) (GMD) [revised] (Version 0.9.1), Zenodo, https://doi.org/10.5281/zenodo.1404210, 2018.
Ridgwell, A. and Schmidt, D. N.: Past constraints on the vulnerability of marine calcifiers to massive carbon dioxide release, Nat. Geosci., 3, 196–200, https://doi.org/10.1038/ngeo755, 2010. a
Ridgwell, A., Hargreaves, J. C., Edwards, N. R., Annan, J. D., Lenton, T. M., Marsh, R., Yool, A., and Watson, A.: Marine geochemical data assimilation in an efficient Earth System Model of global biogeochemical cycling, Biogeosciences, 4, 87–104, https://doi.org/10.5194/bg-4-87-2007, 2007a. a, b, c, d, e, f, g, h
Ridgwell, A., Zondervan, I., Hargreaves, J. C., Bijma, J., and Lenton, T. M.: Assessing the potential long-term increase of oceanic fossil fuel CO2 uptake due to CO2-calcification feedback, Biogeosciences, 4, 481–492, https://doi.org/10.5194/bg-4-481-2007, 2007. a
Ridgwell, A., Peterson, C., Ward, B., and Jones, R.: derpycode/muffindoc: Ward et al. (2018) (GMD) manual release (b) (Version 1.9.1b), Zenodo, https://doi.org/10.5281/zenodo.1407658, 2018.
Schartau, M. and Oschlies, A.: Simultaneous data-based optimization of a 1D-ecosystem model at three locations in the North Atlantic: Part I – Method and parameter estimates, J. Marine Res., 61, 765–793, 2003a. a
Schartau, M. and Oschlies, A.: Simultaneous data-based optimization of a 1D-ecosystem model at three locations in the North Atlantic: Part II – Standing stocks and nitrogen fluxes, J. Marine Res., 61, 795–821, 2003b. a
Shigsesada, N. and Okubo, A.: Analysis of the self-shading effect on algal vertical distribution in natural waters, J. Math. Biol., 12, 311–326, 1981. a
Tagliabue, A., Mtshali, T., Aumont, O., Bowie, A. R., Klunder, M. B., Roychoudhury, A. N., and Swart, S.: A global compilation of dissolved iron measurements: focus on distributions and processes in the Southern Ocean, Biogeosciences, 9, 2333–2349, https://doi.org/10.5194/bg-9-2333-2012, 2012. a
Tagliabue, A., Aumont, O., DeAth, R., Dunne, J. P., Dutkiewicz, S., Galbraith, E., Misumi, K., Moore, J. K., Ridgwell, A., Sherman, E., Stock, C., Vichi, M., Völker, C., and Yool, A.: How well do global ocean biogeochemistry models simulate dissolved iron distributions?, Global Biogeochem. Cy., 30, 149–174, https://doi.org/10.1002/2015GB005289, 2016. a, b, c
Tang, E. P. Y.: The allometry of algal growth rates, J. Plankton Res., 17, 1325–1335, 1995. a
Tyrrell, T.: The relative influences of nitrogen and phosphorous on oceanic primary production, Nature, 400, 525–531, 1999. a
Ward, B. A. and Follows, M. J.: Marine mixotrophy increases trophic transfer efficiency, net community production and carbon export, P. Natl. Acad. Sci. USA, 113, 2958–2963, 2016. a, b, c, d, e, f, g
Ward, B. A., Friedrichs, M. A. M., Anderson, T. R., and Oschlies, A.: Parameter optimisation and the problem of underdetermination in marine biogeochemical models, J. Marine Syst., 81, 34–43, 2010. a
Ward, B. A., Dutkiewicz, S., Jahn, O., and Follows, M. J.: A size structured food-web model for the global ocean, Limnol. Oceanogr., 57, 1877–1891, 2012. a, b, c, d
Ward, B. A., Martin, A. P., Schartau, M., Follows, M. J., and Anderson, T. R.: When is a biogeochemical model too complex? Objective model reduction for North Atlantic time-series sites, Prog. Oceanogr., 116, 49–65, 2013. a
Watson, A. J., Bakker, D. C. E., Ridgwell, A. J., Boyd, P. W., and Law, C. S.: Effect of iron supply on Southern Ocean CO2 uptake and implications for glacial atmospheric CO2, Nature, 407, 730–733, 2000. a, b
Westberry, T., Behrenfeld, M. J., Siegel, D. A., and Boss, E.: Carbon-based primary productivity modeling with vertically resolved photoacclimation, Global Biogeochem. Cy., 22, GB2024, https://doi.org/10.1029/2007GB003078, 2008. a
Wroblewski, J. S., Sarmiento, J. L., and Flierl, G. R.: An ocean basin scale model of plankton dynamics in the North Atlantic. 1. Solutions for the climatological oceanographic conditions in May, Global Biogeochem. Cy., 2, 199–218, 1988. a
Yool, A., Popova, E. E., and Anderson, T. R.: MEDUSA-2.0: an intermediate complexity biogeochemical model of the marine carbon cycle for climate change and ocean acidification studies, Geosci. Model Dev., 6, 1767–1811, https://doi.org/10.5194/gmd-6-1767-2013, 2013. a, b
Zeebe, R. E. and Wolf-Gladrow, D.: CO2 in seawater, Elsevier Science, 2001. a


